Stochastic Trend Evaluator (STE)Stochastic Trend Evaluator (STE): Detailed Description
Overview :
The Stochastic Trend Evaluator (STE) is a sophisticated trading tool designed for TradingView that combines stochastic oscillation analysis with Exponential Moving Average (EMA) trends. It is tailored to assist traders in identifying potential buy and sell opportunities in various market conditions, particularly focusing on trend reversals and momentum shifts.
Functionality & Concept :
The STE is built on two core components – the Stochastic Oscillator and the 200-period EMA.
Stochastic Oscillator :
This oscillator is a momentum indicator comparing a particular closing price of a security to a range of its prices over a certain period.
Settings:
- %K Length: 14
- %K Smoothing: 3
- %D Smoothing: 3
The %K line is the main line indicating momentum, while the %D line is a moving average of %K, providing signal triggers.
200 EMA :
The 200-period EMA serves as a dynamic trend indicator.
It helps in distinguishing between bullish and bearish market phases.
A closing price above the 200 EMA suggests a bullish trend, while below it indicates a bearish trend.
Signal Generation :
STE generates signals based on the interaction between the Stochastic Oscillator and the 200 EMA.
Buy Signal :
Occurs when the stochastic %K crosses above 20 (indicative of oversold conditions), and the closing price is above the 200 EMA.
Represented visually by green label-up arrows.
Sell Signal :
Triggered when the stochastic %K crosses below 80 (suggestive of overbought conditions), and the closing price is below the 200 EMA.
Indicated by red label-down arrows.
Background Color Indicator :
The background color of the chart changes to enhance visual interpretation of the market condition.
Green background for a bullish market scenario (when a buy signal is active).
Red background for a bearish market scenario (when a sell signal is active).
Usage Guidelines :
The STE is best used in markets that exhibit clear trends.
Ideal for traders focusing on medium to long-term trade setups.
Can be used in conjunction with other indicators for confirmation and risk management.
Note : The STE, being a proprietary tool, is based on a unique blend of standard technical analysis concepts and custom logic to provide these trading signals. It is designed to give traders a comprehensive view of the market momentum and trend strength without revealing the intricate details of its algorithm.
Cari skrip untuk "stoch"

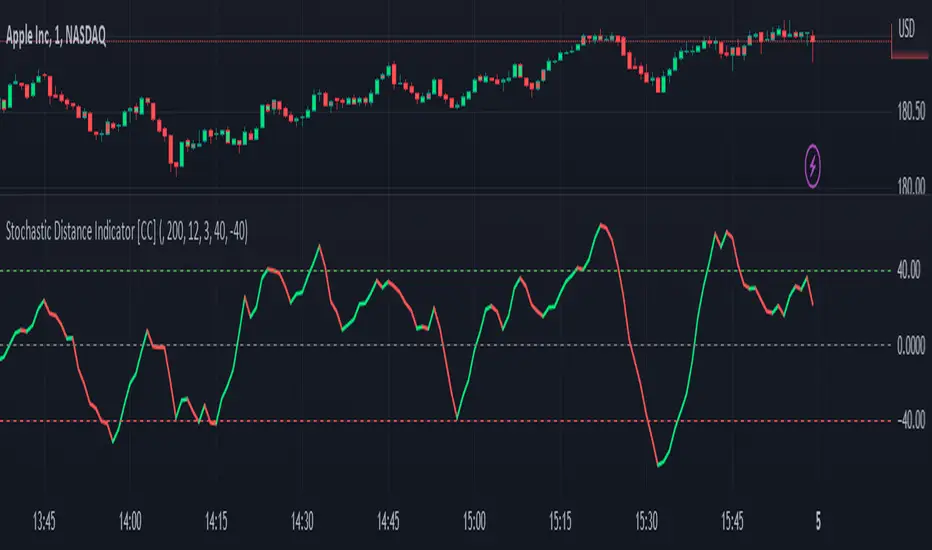
Stochastic Distance Indicator [CC]The Stochastic Distance Indicator was created by Vitali Apirine (Stocks and Commodities Jun 2023 pgs 16-21), and this is a new method that measures the absolute distance between a price and its highest and lowest values over a long period. It uses the stochastic formula to create an oscillator using this distance value and smooths the value. Obviously, there is a lag in signals due to the lookback periods, but it does a good job of staying above the midline when the stock is in a strong uptrend and vice versa. Of course, I'm open to suggestions, but I'm deciding to create buy and sell signals based on comparing the unsmoothed and smoothed values. Buy when the line turns green and sell when it turns red.
Let me know if there are any other indicators you would like to see me publish!
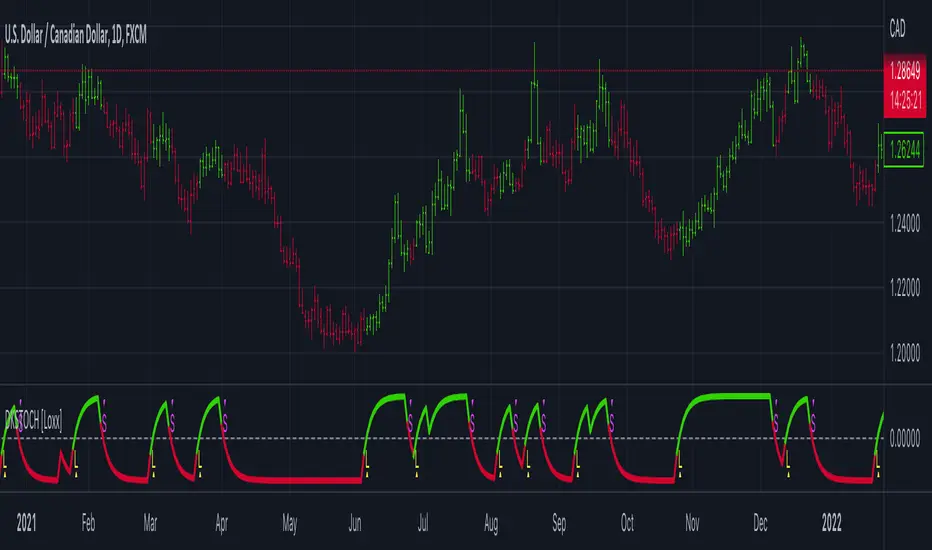
Digital Kahler Stochastic [Loxx]Digital Kahler Stochastic is a Digital Kahler filtered Stochastic. This modification significantly reduces noise.
What is Digital Kahler?
From Philipp Kahler's article for www.traders-mag.com, August 2008. "A Classic Indicator in a New Suit: Digital Stochastic"
Digital Indicators
Whenever you study the development of trading systems in particular, you will be struck in an extremely unpleasant way by the seemingly unmotivated indentations and changes in direction of each indicator. An experienced trader can recognise many false signals of the indicator on the basis of his solid background; a stupid trading system usually falls into any trap offered by the unclear indicator course. This is what motivated me to improve even further this and other indicators with the help of a relatively simple procedure. The goal of this development is to be able to use this indicator in a trading system with as few additional conditions as possible. Discretionary traders will likewise be happy about this clear course, which is not nerve-racking and makes concentrating on the essential elements of trading possible.
How Is It Done?
The digital stochastic is a child of the original indicator. We owe a debt of gratitude to George Lane for his idea to design an indicator which describes the position of the current price within the high-low range of the historical price movement. My contribution to this indicator is the changed pattern which improves the quality of the signal without generating too long delays in giving signals. The trick used to generate this “digital” behavior of the indicator. It can be used with most oscillators like RSI or CCI .
First of all, the original is looked at. The indicator always moves between 0 and 100. The precise position of the indicator or its course relative to the trigger line are of no interest to me, I would just like to know whether the indicator is quoted below or above the value 50. This is tantamount to the question of whether the market is just trading above or below the middle of the high-low range of the past few days. If the market trades in the upper half of its high-low range, then the digital stochastic is given the value 1; if the original stochastic is below 50, then the value –1 is given. This leads to a sequence of 1/-1 values – the digital core of the new indicator. These values are subsequently smoothed by means of a short exponential moving average . This way minor false signals are eliminated and the indicator is given its typical form.
Calculation
The calculation is simple
Step1: create the CCI
Step 2: Use CCI as Fast MA and smoothed CCI as Slow MA
Step 3: Multiple the Slow and Fast MAs by their respective input ratios, and then divide by their sum. if the result is greater than 0, then the result is 1, if it's less than 0 then the result is -1, then chart the data
if ((slowr * slow_k + fastr * fast_k) / (fastr + slowr) > 50.0)
temp := 1
if ((slowr * slow_k + fastr * fast_k) / (fastr + slowr) < 50.0)
temp := -1
Step 4: Profit
Other implementations of Digital Kahler
This is to better understand the process the DK process and it's result, and furthermore, I'm linking these because for many in the Forex community, they see DK filtered indicators as the best implementations of standard indicators.
Digital Kahler MACD
VHF-Adaptive, Digital Kahler Variety RSI w/ Dynamic Zones
Digital Kahler CCI
Included:
Bar coloring
Signals
Alerts
Loxx's Expanded Source Types
Loxx's Moving Averages
Dynamic Zones of On Chart Stochastic [Loxx]Dynamic Zones of On Chart Stochastic is a Stochastic indicator that sits on top of the chart instead of below as an oscillator. Dynamic zone levels are included to find breakouts/breakdowns and reversals.
What is the Stochastic Oscillator?
A stochastic oscillator is a momentum indicator comparing a particular closing price of a security to a range of its prices over a certain period of time. The sensitivity of the oscillator to market movements is reducible by adjusting that time period or by taking a moving average of the result. It is used to generate overbought and oversold trading signals, utilizing a 0–100 bounded range of values.
What are Dynamic Zones?
As explained in "Stocks & Commodities V15:7 (306-310): Dynamic Zones by Leo Zamansky, Ph .D., and David Stendahl"
Most indicators use a fixed zone for buy and sell signals. Here’ s a concept based on zones that are responsive to past levels of the indicator.
One approach to active investing employs the use of oscillators to exploit tradable market trends. This investing style follows a very simple form of logic: Enter the market only when an oscillator has moved far above or below traditional trading lev- els. However, these oscillator- driven systems lack the ability to evolve with the market because they use fixed buy and sell zones. Traders typically use one set of buy and sell zones for a bull market and substantially different zones for a bear market. And therein lies the problem.
Once traders begin introducing their market opinions into trading equations, by changing the zones, they negate the system’s mechanical nature. The objective is to have a system automatically define its own buy and sell zones and thereby profitably trade in any market — bull or bear. Dynamic zones offer a solution to the problem of fixed buy and sell zones for any oscillator-driven system.
An indicator’s extreme levels can be quantified using statistical methods. These extreme levels are calculated for a certain period and serve as the buy and sell zones for a trading system. The repetition of this statistical process for every value of the indicator creates values that become the dynamic zones. The zones are calculated in such a way that the probability of the indicator value rising above, or falling below, the dynamic zones is equal to a given probability input set by the trader.
To better understand dynamic zones, let's first describe them mathematically and then explain their use. The dynamic zones definition:
Find V such that:
For dynamic zone buy: P{X <= V}=P1
For dynamic zone sell: P{X >= V}=P2
where P1 and P2 are the probabilities set by the trader, X is the value of the indicator for the selected period and V represents the value of the dynamic zone.
The probability input P1 and P2 can be adjusted by the trader to encompass as much or as little data as the trader would like. The smaller the probability, the fewer data values above and below the dynamic zones. This translates into a wider range between the buy and sell zones. If a 10% probability is used for P1 and P2, only those data values that make up the top 10% and bottom 10% for an indicator are used in the construction of the zones. Of the values, 80% will fall between the two extreme levels. Because dynamic zone levels are penetrated so infrequently, when this happens, traders know that the market has truly moved into overbought or oversold territory.
Calculating the Dynamic Zones
The algorithm for the dynamic zones is a series of steps. First, decide the value of the lookback period t. Next, decide the value of the probability Pbuy for buy zone and value of the probability Psell for the sell zone.
For i=1, to the last lookback period, build the distribution f(x) of the price during the lookback period i. Then find the value Vi1 such that the probability of the price less than or equal to Vi1 during the lookback period i is equal to Pbuy. Find the value Vi2 such that the probability of the price greater or equal to Vi2 during the lookback period i is equal to Psell. The sequence of Vi1 for all periods gives the buy zone. The sequence of Vi2 for all periods gives the sell zone.
In the algorithm description, we have: Build the distribution f(x) of the price during the lookback period i. The distribution here is empirical namely, how many times a given value of x appeared during the lookback period. The problem is to find such x that the probability of a price being greater or equal to x will be equal to a probability selected by the user. Probability is the area under the distribution curve. The task is to find such value of x that the area under the distribution curve to the right of x will be equal to the probability selected by the user. That x is the dynamic zone.
Included
Bar coloring
Signals
Alerts
4 types of signal smoothing

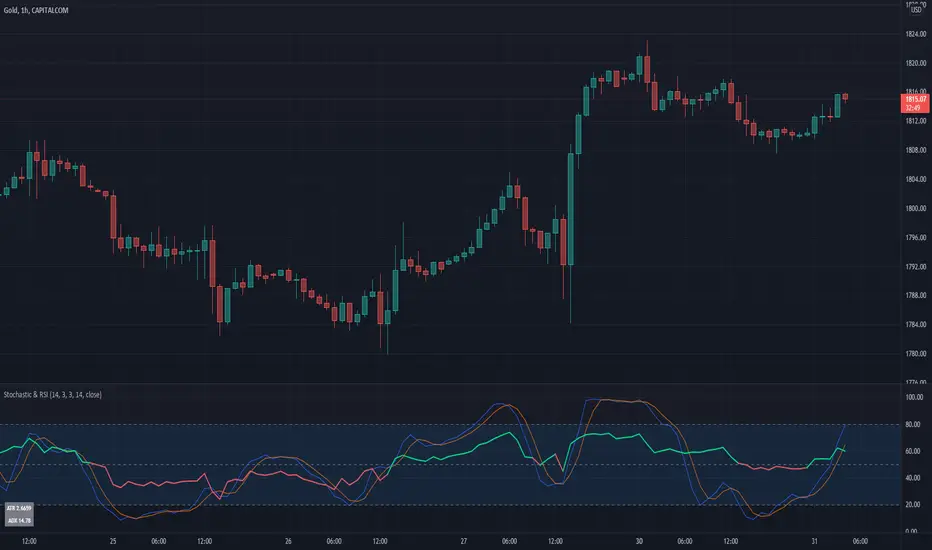
Stochastic & RSIThis script is a simple extension of the Built-In Stochastic RSI that also plots the RSI and prints the values of ATR and ADX of the last bar of the current timeframe to a small table in the corner.
The script can be used to define the entry for a trade when the stochastics crossed and RSI is below or above 0.50 (for going long or short).
OANDA:BTCUSD
I like to use the Stochastics and RSI indicators for pullback strategies, and with this inidcator you dont have to add both indicators to your setup. The ATR can be used to define the value of your stop-loss and the ADX (e.g. > 25) give you a hint for the strength of the current trend.
Stochastics and RSI HybridThis is an interesting study. We know bollinger bands can be a useful tool for price action, but what if we applied them to other indicators?
The top chart is the Stochastics and bottom chart represents RSI. We can see a relationship between the two indicators, where the signal line bounces of the bollinger bands.
The strategy is simple, when the signal lines bounce of their bollinger bands together, review price action and then take the trade. If you see one indicator going in the opposite direction to the other, or opposite to price action, then you may be observing divergence in which case a big move is about to happen.
If you wish to have this indicator further customised, please do not hesitate to contact me.

CCI Stochastic and a quick lesson on Scalping & Trading SystemsHello traders
Still on holidays but I don't and will never forget you <3
I realize more and more that you guys don't only want some indicators and learn about pinescript. You also want some guidance and get some mentors providing you with comprehensive and simple trading methods and tricks.
I'm against those posting many scripts a day that in the end will make you lose your money because they don't give you the methodology to use them
It might look nice on the charts but we're not here to do some painting.... but to improve our lifestyle right :)
The today indicator is based on an indicator that I used for scalping : Fxcodebase CCI Stochastic
A CCI stochastic is very reactive and allows us to take many scalps trades per day with a few pips/USD gain for each trade. I don't recommend novice traders to use it and I strongly recommend everyone reading my disclaimer below basically saying "I'm not a financial advisor, don't be dumb, stay safe"
(I also recommend the few scripts copy-pasters to read my disclaimer as well)
What's a novice trader, sir? Well... thanks for asking. A novice trader is any trader with less than 5 years of live trading experience
From a pinescript perspective, this script will be however interesting for everyone :)
How to use it?
The indicator gives 3 possible entries for Longs and Shorts:
- Arrows at Enter - Will give signals whenever the Stoch CCI will enter in the BUY/SELL zone
- Arrows at Exit - Will give signals whenever the Stoch CCI will exit the BUY/SELL zone
- Arrows at Center - Signals whenever the Stoch CCI will cross the mid-line (50)
All arrows have different colors because ... painting is cool and nice.... kidding.... it gives clearer and more readable signals on the chart (but painting sir...)
A possible trading method could be to use the 3 modes at the same time to get the maximum of opportunities.
The safer bet is to use the "Arrows at Exit" only mode but for those who want to accumulate more scalping positions, adding the "Arrows at Enter" mode is an option as well. In other words, you accumulate a few scalping positions whenever the Stoch CCI get in the BUY/SELL zone and will stop accumulating whenever it will exit the BUY/SELL zone
You can add a few extra positions whenever the Stoch CCI will cross the mid-line as it often translates in a trend continuation
Life hack
Very important note : (probably the most important gem I shared until now) The inputs set by default will have to be changed for your asset/timeframe and can't be generic for everything. You have to play with the inputs until the signals will make sense to you
The indicator/strategy with a unique configuration that you'll never check or update according to the market condition DOES NOT exit.
If you find such a tool and prove me that you're making constant gains with it over a year, please patent it and then show it to me as I'd like to study it to replicate :) But most likely this is a myth/unicorn
Who I am to say this? Well, I worked in a Bank with real traders and I have a good sense of what works and what will certainly not work
My guru said scalping crypto in 1 second timeframe was the way to get rich quick. Do you agree sir?
But in trading, this is not because you take the maximum of trades possible that your gains will increase. This is the contrary.
There is a strong and proven inverse correlation between the number of trades taken and how fast you'll burn your capital. A swing trader taking 2/3 trades a month is more likely to beat 99% of the scalpers out there trying to predict all market movements. (and I'm not even talking about how dangerous it is to scalp with leverage)
You're starting to know me a bit more right now. I prefer to tell you what you need to hear vs what you want to hear because the second option doesn't allow to stay in the game very long.
I might lose some futures clients along the way by saying that but for my own conscience and ethics, I prefer to warn about the true risks of trading and to select who you listen very carefully (the advice also works for me, if you feel what I said doesn't make sense, this is totally your right but I hope this is because I'm french and not because of the content ^^).
See you tomorrow for another indicator or idea
Love you all
Dave
____________________________________________________________
Be sure to hit the thumbs up. Building those indicators take a lot of time and likes are always rewarding for me :) (tips are accepted too)
- If you want to suggest some indicators that I can develop and share with the community, please use my personal TRELLO board
- I'm an officially approved PineEditor/LUA/MT4 approved mentor on codementor. You can request a coaching with me if you want and I'll teach you how to build kick-ass indicators and strategies
Jump on a 1 to 1 coaching with me
- You can also hire for a custom dev of your indicator/strategy/bot/chrome extension/python
Disclaimer:
Trading involves a high level of financial risk, and may not be appropriate because you may experience losses greater than your deposit. Leverage can be against you.
Do not trade with capital that you can not afford to lose. You must be aware and have a complete understanding of all the risks associated with the market and trading. We can not be held responsible for any loss you incur.
Trading also involves risks of gambling addiction.
Please notice I do not provide financial advice - my indicators, strategies, educational ideas are intended to provide only some source code for anyone interested in improving their trading
The proprietary indicators and strategies developed by Best Trading Indicator, the object of intellectual property rights are and remain the exclusive property of Best Trading Indicator, at the exclusion of images and videos and texts free of rights or provided by the Company or external legal or physical person.
No assignment of intellectual property rights is carried out through these Terms and Conditions.
Any total or partial reproduction, modification or use of these properties for any reason whatsoever is strictly prohibited without the express written authorization of the Company.

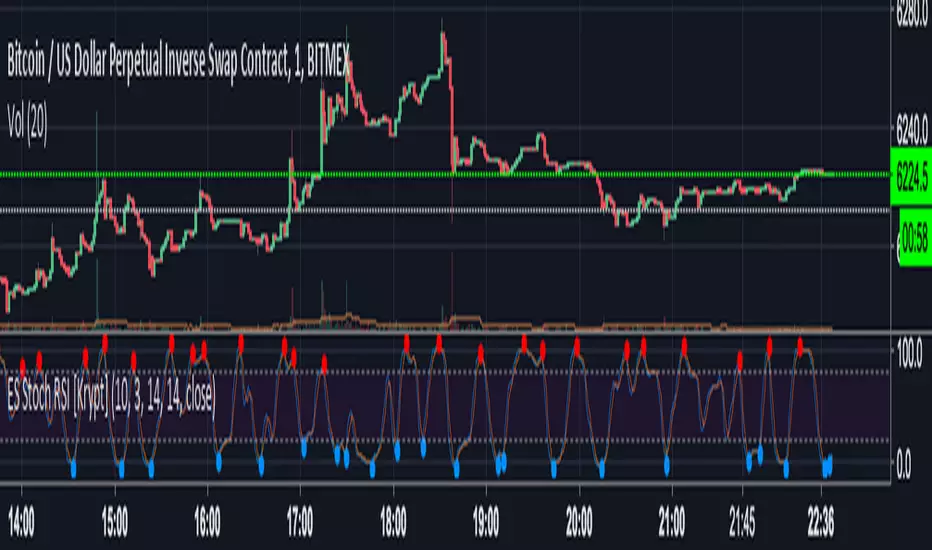
Ehlers-Smoothed Stochastic RSI AlertES Stoch RSI Alert for use with AutoView using script by fskrypt.
Sell Alert <=20.0
Buy Alert >=80.0
StochRSI RangeIndicator for getting StochRSI reading while looking at RSI.
White background plots RSI lows and highs over lookback period. (14 is the default)
Both lines are smoothed like original RSI.

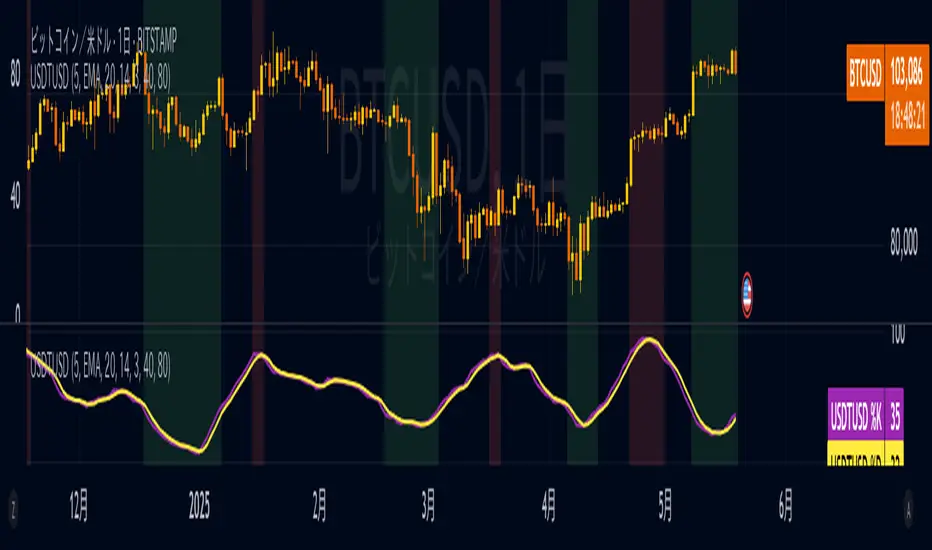
USDTUSD Stochastic RSI [SAKANE]Release Note
■ Overview
The USDTUSD Stochastic RSI indicator visualizes shifts in market sentiment and liquidity by applying the Stochastic RSI to the USDT/USD price pair.
Rather than tracking the price of Bitcoin directly, this tool observes the momentum of USDT, a key intermediary in most crypto transactions, to detect early signals of trend reversals.
■ Background & Motivation
USDT exhibits two distinct characteristics:
Its credibility as a long-term store of value is limited.
Yet, it serves as one of the most liquid assets in the crypto space and is widely used as a trading base pair.
Because most BTC trades involve converting fiat into USDT and vice versa, USDT/USD frequently deviates slightly from its peg to USD.
These deviations—though subtle—often occur just before major shifts in the broader crypto market.
This indicator is designed to detect such moments of structural imbalance by applying momentum analysis to USDT itself.
■ Feature Highlights
Calculates RSI and Stochastic RSI on the USDT/USD closing price
Supports customizable smoothing via SMA or EMA
Background shading dynamically visualizes overheated or cooled market states (thresholds are adjustable)
Displayed in a separate pane, keeping it visually distinct from the price chart
■ Usage Insights
This indicator is based on an observable pattern:
When the Stochastic RSI bottoms out, Bitcoin tends to form a price bottom shortly afterward
Conversely, when the indicator peaks, Bitcoin tends to top out with a slight delay
Since USDT acts as a gateway for capital in and out of the market, changes in its momentum often foreshadow turning points in BTC.
This allows traders to anticipate shifts in sentiment rather than merely reacting to them.
■ Unique Value Proposition
Unlike conventional price-based indicators, this tool offers a structural perspective.
It focuses on USDT as a mechanism of liquidity flow, making it possible to detect the "hidden rhythm" of the crypto market.
In that sense, this is not just a technical tool, but an entry point into market microstructure analysis—allowing users to read the market’s intentions rather than just its movements.
■ Practical Tips
Look for reversals in momentum as potential BTC entry or exit points.
Overlay this indicator with the BTC chart to compare timing and divergence.
Combine with other tools such as on-chain data or macro indicators for comprehensive analysis.
■ Final Thoughts
USDTUSD Stochastic RSI is designed with the belief that the most important market signals often come from what drives the price, not the price itself.
By tuning into the “heartbeat” of capital flow, this indicator sheds light on market dynamics that would otherwise remain unseen.
We hope it proves useful in your trading and research.
Stochastic RMIThe Relative Momentum Index (RMI) is a technical analysis indicator used to analyze the price movements of assets in a financial market. Similar to the RSI (Relative Strength Index), it helps measure the momentum and strength of the asset's price movements over the recent period. However, the RMI offers a "smoother" view, unlike the RSI. This means that there is less "noise" in the indicator.
As is known, the Stochastic RSI indicator is based on the RSI. What I did was to create a stochastic based on the RMI. If you compare this indicator with the "Stochastic RSI", you will see that there is no difference between them, except that the "Stochastic RMI" is more "smooth" and noiseless.

Multiple Ticker Stochastic RSIThe Stochastic RSI is a technical indicator ranging between 0 and 100, based on applying the Stochastic oscillator formula to a set of relative strength index (RSI). Unlike the original Stochastic RSI indicator, this allows you to define up to two additional tickers for which all three will be averaged and outputted visually looking like a standard Stochastic RSI indicator. Potential buy and sell visuals are included, as well as alerts. Please note that this indicator is not meant to be used by itself.

Stochastic GuppyDerived from TradingView's built-in Stochastic indicator. Switched from SMA to EMA and applied Guppy (GMMA) indicator short and long term periods.

Stochastic OB/OS Zones HeatmapThe code is based on the Stochastic RSI Heatmap, but uses a normal Stochastic instead the Stochastic RSI when calculating "k" for more accuracy. Credit for the idea goes to Indicator-Jones.
The heatmap starts from the oversold (20) / overbought (80) levels respectively. The more oversold / overbought the price, the more intense the color (blue / fuchsia)

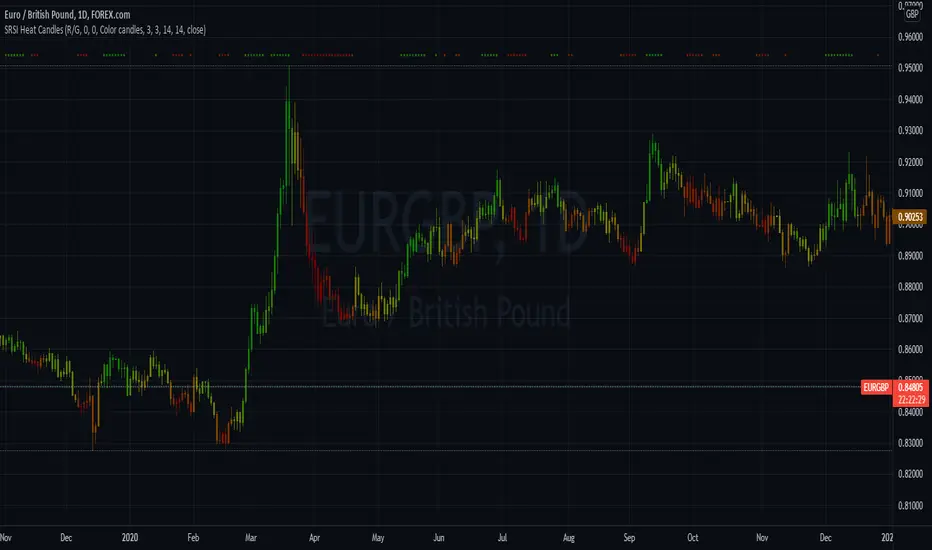
Stochastic RSI Heat Candles OverlayThis script is based on the Stochastic RSI indicator.
Candles are dynamically colored with a customizable RGB shading directly generated from the average Stochastic RSI current value.
By default, colors represent the following status -> green is overgought & red is oversold.
Options:
Shading colors: Choose between Red/Green, Green/Blue, and Blue/Red shadings to represent the SRSI heat.
Invert colors: Switch colors of the selected shading.
Third color: Select a value from 0 to 255 for the third color which does not vary.
Transparency: Select the transparency value.
Overlay style : Choose to color the whole candle, or only borders and wick.
Show candle side: If you choose to fully fill candles with the SRSI heat color , enable this option to plot shapes representing the candles directions.
Candle marks colors: Select bull and bear colors for direction shapes.
Overbought and Oversold situations are also represented by colored shapes at the top of the chart.
Standards Stochastic RSI parameters.
Examples:
Notes:
Do not forget to bring the script to the front of your chart to avoid being covered by default candles.
Next improvements would probably be a better coloring algorithm, however, do not hesitate to suggest any modifications in comments.
Initially, I shared a Stochastic RSI Heat Bollinger Bands indicator which gave me the idea to develop this one, you can find it on my profile.
MESA Stochastic Multi LengthJohn Ehler's MESA Stochastic uses super smoothing to give solid signals. This indicator uses the same rules as every other Stochastic indicator so it would be worth looking into if you are not already familiar with reading a Stochastic. There are 4 different lengths displayed to give traders an edge on reading the market. This is a great tool to analyze waves and find tops and bottoms. It gives great pump and dump signals and even helps filter out bad trades when used with other indicators such as Boom Hunter.
Below are some examples of signals to look out for:
oo

Stochastic Weights - Basic [BigBitsIO]This script is a compilation of several different stochastic indicators (and RSI) where the K value of each indicator is equally weighted. The purpose of the indicator is to combine many indicators together in a fashion that weights them easier. By default, the Stochastic and Stochastic RSI are both enabled - the idea is to speed up the relatively slower Stochastic and to slow down the relatively fast Stochastic RSI. Other Stochastics are also available, including some of my own custom calculations that can also be added to the weighted calculation. Only the K value is weighted, as the D value is just a moving average of the weighted K.
Explained:
- Calculates enabled indicators
- Calculates the weighted value of K for enabled indicators
- Calculates a D value from the weighted K
FAQ:
- Why is this script useful?
- To weight multiple indicators together so that you can attempt to find optimal values shared amongst the indicators. Ex: If Stochastic RSI is 100 and Stochastic is 50, K would be 75 and not particularly high. If you add in a 50 RSI, the K would be 67 in this example. If we weight indicators together that all have a high value they could potentially help find elements that align together to produce a stronger signal.
DISCLAIMER: For educational and entertainment purposes only. Nothing in this content should be interpreted as financial advice or a recommendation to buy or sell any sort of security or investment including all types of crypto. DYOR, TYOB.
stoch rsi dmi plusSo in this indicator I put the improved DMI together with stoch rsi
the area in light blue are buy zone by the improved DMI
the area in light red are potential sell zone by the improved DMI
the green columns are stoch rsi crossing up
the red columns are stoch rsi crossing down

Stochastic + Stochastic RSIJust a basic indicator I rigged up to help reduce screen real estate that ended up providing more insight than expected; overlays both the stochastic and stochastic RSI. While I initially made this to save space, I've begun to pick up on some interesting patterns in cryptocurrencies based on the divergence of stochastic from the stochastic RSI, and the comparison of their swing lows.
Left all settings modifiable, since this is simply a combination indicator I've left the source code open unlike other proprietary indicators I use.
Happy trading!
Austin Doyle
CTO
Crypto Playhouse

MTF Stochastic Range FinderThis indicator compares Stochastic RSI from 2 timeframes to signal possible reversals. Default 5 minute and 2 minute. Both Stochastic RSIs are customizable.
Allows for 6 support/resistance lines and allows a tolerance to filter proximity to levels for entry.
Can filter price level by manual support/resistance levels and/or VWAP

Stochastic with 4 %K LinesQuad Rotation Stochastic Strategy – Indicator Description
The Quad Rotation Strategy is a momentum-based technical analysis tool that overlays four distinct Stochastic %K lines on a single chart. Each line is calculated using a unique set of parameters, allowing traders to visualize and compare momentum signals across varying sensitivities — from fast-reacting setups to slower, trend-confirming ones.
This multi-speed stochastic view is designed to help traders:
Identify rotation points where shorter-term stochastic lines cross faster than longer-term lines, signaling early reversals or trend continuation.
Confirm strength or weakness in price action by observing alignment or divergence among the %K lines.
Fine-tune entries and exits by using fast %K lines for timing and slower ones for confirmation.
🔍 How It Works:
Four separate %K lines are plotted, each with configurable Length and Smoothing.
All lines are calculated using the standard Stochastic formula:
(%K = SMA of (Close - Low) / (High - Low) over period)
No %D lines are included to keep the focus on %K behavior across different speeds.
Standard overbought (80), oversold (20), and midline (50) levels are provided for context.
This indicator is best used in:
Trend continuation setups where faster stochastics pull back to oversold while slower ones remain bullish.
Reversal zones where all four %K lines converge or cross in extreme levels.
Range-bound environments where confluence of extremes offers swing trade opportunities.

4x Stochastic Dingue4 Stochastic indicator into 1.
Different lengths produce short-term and long-term indicators that can help with finding the trend and impulses within the trend.
It can also find reversal points when all 4 are at the extreme at the same time. Ex. All 4 Stoch are above 90 or under 10 !! This could signal a bottom or top is soon to happen. (This is not always true as it depends on many factors.)
Many visual options make it even more customizable. Fill between Stoch, background colors, Crosses.
Divergences are not always accurate, depending on settings and timeframe, but they can be useful in certain situations.
---------------------
In closing, no indicator can give perfect signals, you need to use them in conjunction with other information to make better decisions.
I hope you like my indicators and that they help your trading.
If you have any questions please ask.
Thank you.

Triangular Stoch RSI BandsThe indicator calculates Triangularity over Stoch RSI Overbought and Oversold Conditions
So Ever wondered how a overbought and oversold condition looks if the values are triangualrised
The indicator plots auto band levels on top of price
Enjoy!
