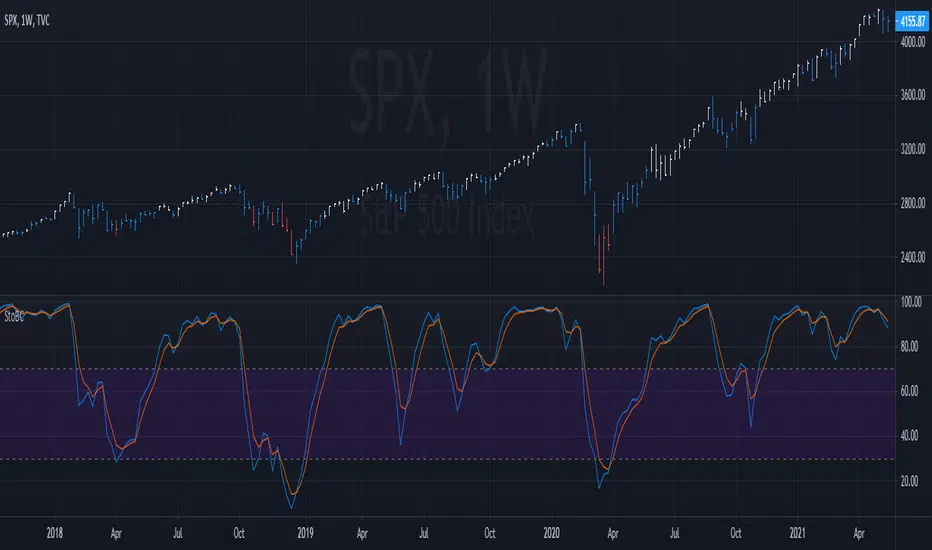
Stochastic Weighted RSI w/ Divergence + Signals🐢 Tawtis' Stochastic Weighted Relative Strength Index , aka SWRSI
This indicator combines the Stochastic RSI and the classic RSI we all know and love to create a more effective indication of seller/buyer dominance, and in turn, trend. I have named it the "Stochastic Weighted RSI". The script also includes a standard RSI, so you can use both at the same time!
Loads of customisation, pretty much every input can be changed to fit your preferences, however, the default settings are what I would personally recommend for the best results. Either way, feel free to change them!
By looking at the indicator, you can also establish the trend that may follow in the candles to come.
Typically, an indicator reading of over 70 is considered overbought, and an indicator reading of under 30 is considered oversold.
The calculations for the SWRSI and its signals take into account a multitude of exponential moving averages, a Stochastic RSI and a classic RSI, among other things.
There are 2 types of signals provided by the indicator, being strong and weak. You do not have to follow these, and they aren't always accurate (it's impossible to be accurate 100% of the time), however, they can give a good idea of the trend that will ensue.
Strong buy signals are created when:
SWRSI is under 30
SWRSI is over the EMA (default 2) of the SWRSI
Short EMA (default 20) is under the long EMA (default 50)
Strong sell signals are created when:
SWRSI is over 70
SWRSI is under the EMA (default 2) of the SWRSI
Short EMA (default 20) is over the long EMA (default 50)
Weak buy and sell signals are printed as green and red background highlights, and operate the same as the strong buy and sells, without the short/long EMA criterion. Both of these signal types can be toggled off using the settings if you do not want to see them.
Enjoy!
Cari skrip untuk "stoch"

Stochastic Relative strength Index Smoothed Alma [DM]Greetings colleagues
here I sahre a StoRSI script with the Arnaud Legoux moving average smoothing .
I think it is the stochastic has been built "with coherence", I have established some signal lengths so that the behavior is as close to the normal Stochastic RSI 14-14-3-3.
Right now I am working on other indicators and over time I will try to share which lengths I think are the best, but I always recommend increasing the main length and then
adjusting the smooth on every plots.
Warning signs and plotshapes are incorporated
Color changes
adjustable overbought and oversold zones
I hope you enjoy

Stochastic Barcolor 2021-5-22This one is the stochastic with barcolor added to it. In this example, the bars are white when the stochastic line is above is above both 70 AND its signal (vice-versa the bars are red). Adjust the lines and overbought/oversold levels however you see fit for your needs. On higher time frames, this can be used to spot the most bullish/bearish trends. On lower time frames it can be used to take profits. This setting is most effective when used on multiple time frames. Enjoy!
Stochastic RSIA formula based Stochastic RSI escaping Trading View's internal indicator modules
Uses custom
- RSI
- RMA
- STOCHASTIC
Stochastic RSI, RSI & MACDIndicate the strong signal happening in green highlight column. Where the condition of:-
Fast Stochastic > Slow Stochastic
RSI above 50
Current RSI higher than before candle
MACD is a bullish

Stochastic RSI + RSI + MFI + RVI + Divergence IndicatorThis script is a simple edit of my previous script "Stoch.RSI+RSI+MFI+CM_Williams_Vix_Fix_V3"
It plots up to 4 oscillators (Stochastic RSI, RSI, MFI, RVI) and divergences between RSI and price. By default only Stochastic RSI, RSI and Regular divergences are enabled. But you can also enable the remaining oscillators and hidden divergences from the script settings.
So basically there are few, but significant, differences between this script and the original one.
Changelog:
- Removed the CM_Williams_Vix_fix code.
- Added RVI plot.
- Added divergences detection.
@Bezzus

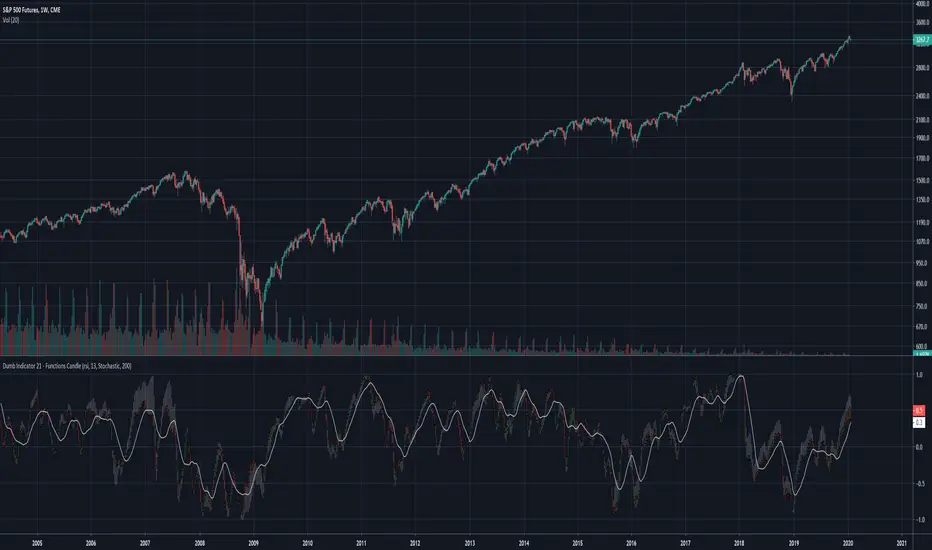
Dumb Indicator 21 - Function's Candlestick Bar's StyleThe idea is help traders to see the patterns and levels from a different point o view.
This script create candlestick using the opening, high, low and close price as source on your favorite function.
It's very simple to use:
Select a function in the drop box list, the number of bars length, check or uncheck the boxes to treat source as logarithm, smooth, and if you want to plot the SMA from the results.
To make a deeper analysis, you can select to plot the candles in Stochastic or in Percent Rank way.
The Stochastic and Percent Rank plot will show how far the price is close to highest or lowest value of the source from the last "Stochastic Length" number of bars.
Some functions with different names can plot the same results.
This indicator works on every kind of market, but you will need to find the best function and length to use.
Please, if you find anything good with this, share to everyone.

Salty GRaB Wave with Highlights for Squeeze CCI-Arrows SlowStochThis indicator shows GRaB candles and allows several moving averages to be displayed at the same time.
It uses background coloring to identify momentum shifts. Wide bands of color can be used to identify trends while short bands of color can be used to identify reversals.
It has arrows above or below the candles to show CCI values above 100 or below -100 with the arrow pointing in the direction of the momentum.
It has red background coloring to show slow stochastic Overbought ranges and dark red signals indicating a cross of the fast and slow lines.
It has green background coloring to show slow stochastic Oversold ranges and dark green signals indicating a cross of the fast and slow lines.
It has yellow background to show squeezes with additional Squeeze information shown at the bottom of the chart in the form of letters and momentum arrows.

Stochastic of Exponential Moving AverageHi Traders,
This indicator is a classic EMA with a smoothed Stochastic oscillating around it, using the EMA as midpoint of the Stochastic oscilator.
It can be used as an overlay on your chart using the EMA as support and resistance or as an independent indicator under your chart.
You have to trim the width of the Stochastic depending on the value of your asset, so USD/JPY=1 and EUR/USD=300.
This is a great trend following and momentum indicator.
Cheers, Indicat

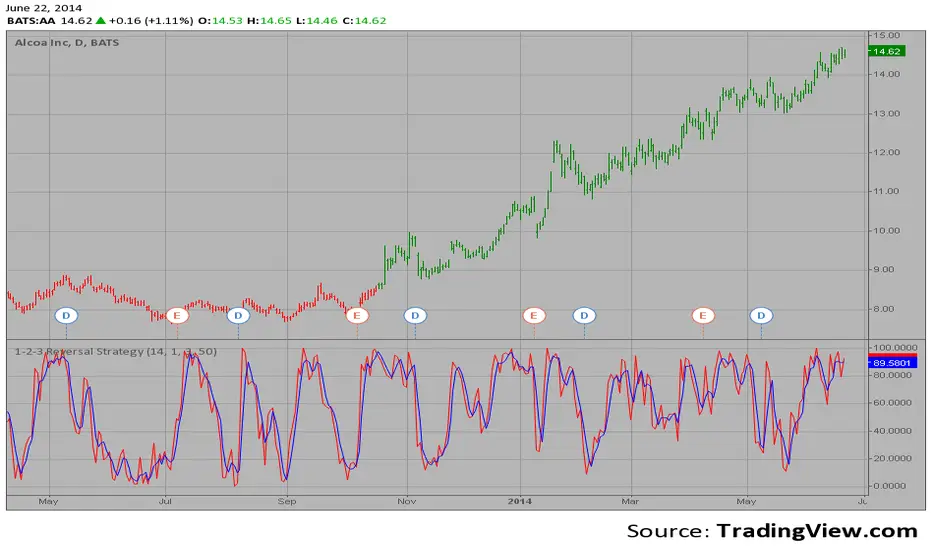
1-2-3 Reversal Strategy This System was created from the Book "How I Tripled My Money In The
Futures Market" by Ulf Jensen, Page 183. This is reverse type of strategies.
The strategy buys at market, if close price is higher than the previous close
during 2 days and the meaning of 9-days Stochastic Slow Oscillator is lower than 50.
The strategy sells at market, if close price is lower than the previous close price
during 2 days and the meaning of 9-days Stochastic Fast Oscillator is higher than 50.
Stochastic Ensembling of OutputsStochastic Ensembling of Outputs
🙏🏻 This is a simple tool/method that would solve naturally many well known problems:
“Price reversed 1 tick before the actual level, not executing my limit order”
“I consider intraday trend change by checking whether price is above/below VWAP, but is 1 tick enough? What to do, price is now whipsawing around vwap...”.
“I want to gradually accumulate a position around a chosen anchor. But where exactly should I put my orders? And I want to automate it ofc.“
“All these DSP adepts are telling you about some kind of noise in the markets… But how can I actually see it?”
The easy fix is to make things more analog less digital, by synthesizing numerous noise instances & adding it to any price-applied metric of yours. The ones who fw techno & psytrance, and other music, probably don’t need any more explanations. Then by checking not just 2 lines or 1 process against another one, you will be checking cloud vs cloud of lines, even allowing you to introduce proxies of probabilities. More crosses -> more confirmation to act.
How-to use:
The tool has 2 inputs: source and target:
Sources should always be the underlying process. If you apply the tool to price based metric, leave it hlcc4 unless you have a better one point estimate for each bar;
Target is your target, e.g if you want to apply it to VWAP, pick VWAP as target. You can thee on the chart above how trading activity recently never exactly touched VWAP, however noised instances of VWAP 'were' touched
The code is clean and written in modular form, you can simply copy paste it to any script of yours if you don't want to have multiple study-on-study script pairs.
^^ applied to prev days highs and lows
^^ applied to MBAD extensions and basis
^^ applied to input series itself
Here’s how it works, no ML, no “AI”, no 1k lines of code, just stats:
The problem with metrics, even if they are time aware like WMA, is that they still do not directly gain information about “changes” between datapoints. If we pick noise characteristics to match these changes, we’d effectively introduce this info into our ops.
^^ this screenshot represents 2 very different processes: a sine wave and white noise, see how the noise instances learned from each process differ significantly.
Changes can be represented as AR1 process . It’s dead simple, no PHD needed, it’s just how the current datapoint is related (or not) to the previous datapoint, no more than 1, and how this relationship holds/evolves over time. Unlike the mainstream approach like MLE, I estimate this relationship (phi parameter) via MoM but giving more weights to more recent datapoints via exponential smoothing over all the data available on your charts (so I encode temporal information), algocomplexity is O(1), lighting fast, just one pass. <- that gives phi , we’d use it as color for our noise generator
Then we just need to estimate noise amplitude ( gamma ) via checking what AR1 model actually thought vs the reality, variance of these innovations. Same via exponential smoothing, time aware, O(1), one pass, it’s all it does.
Then we generate white gaussian noise, and apply 2 estimated parameters (phi and gamma), and that’s all.
Omg, I think I just made my first real DSP script xd
Just like Monte Carlo for risk management, this is so simple and natural I can’t believe so many “pros” hide it and never talk about it in open access. Sharing it here on TradingView would’ve not done anything critical for em, but many would’ve benefited.
∞

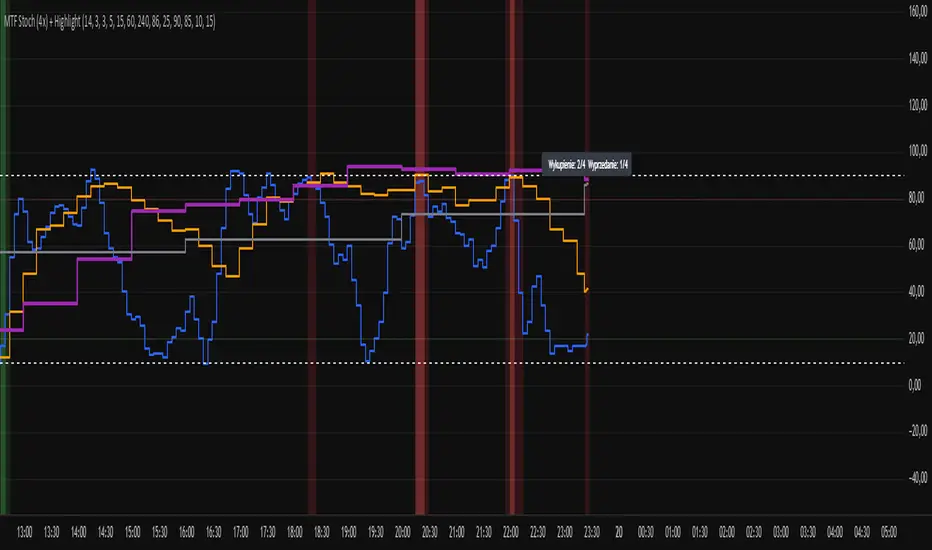
Multi-Timeframe Stochastic (4x) z PodświetlaniemStochastic z możliwością paru tfów gdzie jak są w danej strefie to podświetla
Stochastic ExcessThe stochastic indicator is a technical analysis tool used in finance to assess the momentum of an asset’s price. It measures the current closing price relative to its price range over a specified period, usually a short one. This indicator helps identify overbought or oversold conditions, signaling when an asset might be about to reverse its trend.

Stochastic Momentum Index (SMI) of Money Flow Index (MFI)"He who does not know how to make predictions and makes light of his opponents, underestimating his ability, will certainly be defeated by them."
(Sun Tzu - The Art of War)
▮ Introduction
The Stochastic Momentum Index (SMI) is a technical analysis indicator that uses the difference between the current closing price and the high or low price over a specific time period to measure price momentum.
On the other hand, the Money Flow Index (MFI) is an indicator that uses volume and price to measure buying and selling pressure.
When these two indicators are combined, they can provide a more comprehensive view of price direction and market strength.
▮ Improvements
By combining SMI with MFI, we can gain even more insights into the market. One way to do this is to use the MFI as an input to the SMI, rather than just using price.
This means we are measuring momentum based on buying and selling pressure rather than just price.
Another way to improve this indicator is to adjust the periods to suit your specific trading needs.
▮ What to look
When using the SMI MFI indicator, there are a few things to look out for.
First, look at the SMI signal line.
When the line crosses above -40, it is considered a buy signal, while the crossing below +40 is considered a sell signal.
Also, pay attention to divergences between the SMI MFI and the price.
If price is rising but the SMI MFI is showing negative divergence, it could indicate that momentum is waning and a reversal could be in the offing.
Likewise, if price is falling but the SMI MFI is showing positive divergence, this could indicate that momentum is building and a reversal could also be in the offing.
In the examples below, I show the use in conjunction with the price SMI, in which the MFI SMI helps to anticipate divergences:
In summary, the SMI MFI is a useful indicator that can provide valuable insights into market direction and price strength.
By adjusting the timeframes and paying attention to divergences and signal line crossovers, traders can use it as part of a broader trading strategy.
However, remember that no indicator is a magic bullet and should always be used in conjunction with other analytics and indicators to make informed trading decisions.

Stochastic by BTBSA little word before you are going to use it, this indicator is just a MODIFIED script.
The calculation part is NOT FROM ME , its still the original script by TradingView.
The Usage is still the same as you can take out of the info tab by TradingView.
The only difference is that the Color Changes red when:
1. %K is over 80 (Upper Band-High Band)=(OVERBOUGHT)
2. %D lays over %K (%D>%K)
Changes green when:
1.%K is under 20 (Lower Band-Low Band)=(OVERSOLD)
%K lays over %D (%K>%D)
Tell me what I can add or do better :)
Tag me if you use this in a public Analysis :)
Stochastic ATR Volatility OscillatorNOTES: As x, k and d use;
21-10-3 for 1 Hour candles
5-4-2 for 4 Hour candles
21-21-3 for 1 Day candles
Yellow plot is the main oscillator. Orange plot, and hlines at 20, 50 and 80 can be used as signal lines.
I personally use hlines as the signal in 1H as it's the best timeframe for the indicator.
If you are in a long position, sell when yellow plot crosses 80 or 50 line downwards;
and buy when the line crosses 20, 50 or 75 upwards while you are not in a trade.

Amino FT ModifiedThis oscillator is designed by Amino (Amin Dehghan) which includes four K percent lines (derivated from Stochastic Oscillator ). The value of these lines are multiplied by 4 (which is the main multiplier of Ichimoku System ) which are 240, 60, 30, 15. The slowing line is 1 by default.
Please like and follow for more indicators and system templates from Amino.
WEALTH FOR ALL.

Stochastic distanceHello. I've used stochastic indicator basic formula and added distance columns of %D & %K to it. The idea of columns is from MACD indicator that have distance columns in it that rising and descending these columns shows the power of trend rising or descending. I hope it will be practical and useful.

CyclesThis is a modified Stochastic indicator. Modifications include:
1. The output is now centered on "0" and the scale is from -50 to +50, so that histograms and columns can be used to plot the output.
2. Added visual trade setup triggers. A trigger to the up side is a cycle high and indicates a "sell signal". A trigger to the down side is a cycle low and indicates a "buy" signal.
3. Added an alert trigger to be used to setup alerts. Selecting "Alert" to be Greater Than (>) Value = 0.00 will trigger an alert if either the buy or sell triggers occur.
4. Added a force indicator output. This indicates the rate of change in "D", or mathematically "dD/dt", as was done in the Power Analyzer indicator. When Force and D are in-phase, the maximum power is achieved.
5. Added "Slow Average Momentum" and "Slow Average Force" as was done in the Power Analyzer indicator.
6. Added an internal MACD and EMA as part of the trade setup trigger equation. There is a new input variable for the EMA length.
7. Added an input variable for the "Trigger Threshold", which ranges from -50 to 50, to be used as a screening filter.

SMI Stochastic Momentum Index 2x set per Baiynd -Tom1traderStochastic Momemtum Index - a true strength indix tsi with a moving average signal.
This uses the built in with modifications per Anne-Marie Baiynds recommendations - she uses a SIMPLE MOVING AVERAGE
for the signal (signal length at 4x the short length seems to work best to reflect actual price action support or resistance)
Note: Default settings in this code have been updated to her most recent recommendations that I have seen.
video is entitled "The Most Reliable Technical Indicator I Have Ever Used"
Note: I have not discussed this with Ms . Baiynd this is my interpretation of the vids I have seen.
Anne-Marie Baiynd also in talks / videos refers to the use of short / long of 4/20 and 6/40 and have combined both of them here
This overlays both of them with their respective SMAs- a 4/20 lengths and a 6/40 lengths in darker colors and smallest linewidth.
this gives a perspective on slightly higher time frame action.
USAGE: Generally above and below the black dashed zero line is long or short
KEYS: -Plot position relative to zero black, red overbought, green oversold and the gray lines at .25 -.25
Indicator action often more significant out side of the more "neutral" +.25/-.25 area
and near or above/below the red/green dashed lines.
-Steepness of slopes
Slopes of smi plots relate directly to price action where steeper is more momentum.
- -SMI blue relation to its simple moving average orange and the SMI longer dark blue with moving average purple.
MAJOR FEATURE - The average acts as support or resistance to the SMI and the price unless breaking out.
Price is often pausing or reversing iin finding primary/secondary support or resistance as well at those times.
You Can See and anticipate Where Support or Resistance may be Encountered. (much unlike most indicators)
My standard caveat -use at your own risk. Like anyone else I do not know what the next bar/candle is going to do
and I place all of my trades with a management plan in place for the worst case scenario.
That said enjoy your charting and trading.
This was coded starting with the built-in indicator "SMI Ergontic Oscilator / Indicator". You do this by within the Pine Editor select "New" tab and
choose the indicator that you want the code for. This populates the editor with the code for the built in indicator and you can modify it to suit your
purposes and save it / publish it and etc. Thanks for following this and Keep Smiling!

K/D DifferenceThis script provides a histogram for easier analysis of K D difference of a Stochastic oscillator.

Stochastic RSI DivergencesAdapted from TradingView's RSI Divergences to instead use Stochastic RSI as the oscillator.
