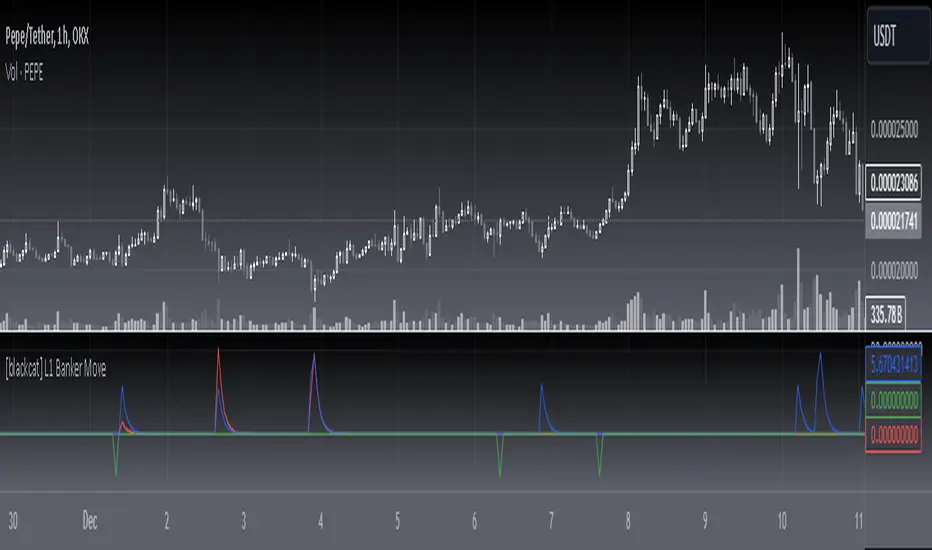
[blackcat] L1 Banker Move█ OVERVIEW
The Pine Script is an indicator designed to analyze market signals for institutional and short-term investors. It calculates and plots three main signals: Institutional Signal, Institutional Build, and Short-Term Investor Signal. The script uses a combination of price, volume, and moving average data to generate these signals, which can help traders identify potential buying or selling opportunities.
█ LOGICAL FRAMEWORK
The script is structured into several main sections:
1 — Input Parameters
The script does not explicitly define any input parameters, relying on default values for calculations.
2 — Custom Functions
• reference_value(values, length) : Retrieves the first non-NA value from a specified number of past values.
• calculate_institutional_and_short_term_signals(low, close, open, volume) : Calculates the institutional and short-term investor signals based on price, volume, and moving average data.
3 — Calculations
• Price and Volume Metrics: The script calculates various smoothed price changes, lowest and highest values over different periods, and volume-weighted prices.
• Moving Averages: It computes simple moving averages (SMA) and exponential moving averages (EMA) for different periods.
• RSI Calculation: The script calculates a custom RSI for different periods.
• Signal Generation: It generates the institutional and short-term investor signals based on the calculated metrics.
4 — Plotting
The script plots the three main signals on the chart using the plot function.
The flow of data and logic is as follows:
• The reference_value function is used to find reference values for calculations.
• The calculate_institutional_and_short_term_signals function performs the core calculations and returns the institutional and short-term investor signals.
• The main script calls this function and plots the results.
█ CUSTOM FUNCTIONS
1 — reference_value(values, length)
• Purpose : Retrieves the first non-NA value from a specified number of past values.
• Parameters :
• values: An array of values.
• length: The number of past values to consider.
• Return Value : The first non-NA value found or na if no valid value is found.
• Functionality : Iterates through the specified number of past values and returns the first non-NA value.
2 — calculate_institutional_and_short_term_signals(low, close, open, volume)
• Purpose : Calculates the institutional and short-term investor signals based on price, volume, and moving average data.
• Parameters :
• low: Low price series.
• close: Close price series.
• open: Open price series.
• volume: Volume series.
• Return Values :
• institutional_signal: The institutional signal.
• institutional_build: The institutional build signal.
• short_term_investor_signal: The short-term investor signal.
• Functionality :
• Computes various price and volume metrics.
• Calculates moving averages and volume-weighted prices.
• Generates the institutional and short-term investor signals based on these metrics.
█ KEY POINTS AND TECHNIQUES
1 — Advanced Pine Script Features
• Custom Functions: The script defines and uses custom functions to encapsulate complex logic.
• Conditional Statements: Extensive use of iff and if statements to control the flow of calculations.
• Looping Constructs: The for loop in reference_value function to iterate through past values.
• Exponential Moving Averages (EMA): Used to smooth out price and signal changes.
• Volume-Weighted Price (VWP): Calculated to factor in volume in price analysis.
• Custom RSI Calculation: A custom RSI formula is used, which differs from the standard RSI calculation.
2 — Optimization Techniques
• Efficient Data Handling: The reference_value function efficiently finds the first non-NA value without unnecessary computations.
• Smoothed Signals: Using EMAs to smooth out noisy signals for better trend identification.
3 — Unique Approaches
• Combination of Metrics: The script combines multiple metrics (price, volume, moving averages, and custom RSI) to generate comprehensive signals.
• Institutional Build Signal: A unique approach to detect institutional activity by comparing current price levels with historical lows and smoothed price changes.
█ EXTENDED KNOWLEDGE AND APPLICATIONS
1 — Potential Modifications
• Input Parameters: Add input parameters to allow users to customize the lengths and thresholds used in the calculations.
• Strategy Version: Convert the indicator into a strategy by adding buy/sell signals based on the generated signals.
• Additional Indicators: Integrate other technical indicators (e.g., MACD, Bollinger Bands) to enhance the signal generation process.
2 — Similar Trading Scenarios
• Institutional Activity Analysis: Use similar techniques to analyze institutional activity in other markets or assets.
• Volume Analysis: Apply the volume-weighted price and volume analysis to identify significant price movements.
• Multi-Timeframe Analysis: Extend the script to analyze signals across multiple timeframes for a more robust trading strategy.
3 — Related Pine Script Concepts
• Pine Script Functions: Understanding how to define and use custom functions effectively.
• Conditional Logic: Mastering the use of iff and if statements for complex logic.
• Looping Constructs: Familiarity with for loops for iterating through data.
• Moving Averages: Knowledge of different types of moving averages and their applications.
• Volume Analysis: Techniques for incorporating volume data into price analysis.
Indikator dan strategi
DonAlt - Smart Money Toolkit [BigBeluga]DonAlt - Smart Money Toolkit is inspired by the analytical insights of popular crypto influencer DonAlt.
This advanced toolkit integrates smart money concepts with key technical analysis elements to enhance your trading decisions.
🔵 KEY FEATURES:
SUPPORT AND RESISTANCE LEVELS Automatically identifies critical market turning points with significant volume. Levels turn green when the price is above them and red when below, providing a visual cue for key market thresholds.
ORDER BLOCKS: Highlights significant price zones preceding major price movements.
- If the move is down , it searches for the last bullish candle and plots a block from its body.
- If the move is up , it searches for the last bearish candle and creates a block from its body.
These blocks help identify areas of institutional interest and potential reversals.
TRENDLINES: Automatically plots trendlines to identify breakout zones or price accumulation areas.
• Bullish trendlines accumulation form when the current low is higher than the previous low.
• Bearish trendlines accumulation emerge when the current high is lower than the previous high.
• Bullish trendlines Breakout form when the price break above it.
• Bearish trendlines Breakout form when the price break below it.
Volatility Integration: The levels incorporate normalized volatility to ensure only significant zones are highlighted, filtering noise and emphasizing meaningful data.
🔵 WHEN TO USE:
This toolkit is ideal for traders seeking to align with "smart money" strategies by identifying key areas of institutional activity, strong support and resistance zones, and potential breakout setups.
🔵 CUSTOMIZATION:
Toggle the visibility of levels, order blocks, or trendlines to match your trading style and focus.
Colors of the Bull and Bear key features
Extend trendline

MA Multi-Timeframe [ChartPrime]The MA Multi-Timeframe indicator is designed to provide multi-timeframe moving averages (MAs) for better trend analysis across different periods. This tool allows traders to monitor up to four different MAs on a single chart, each coming from a selectable timeframe and type (SMA, EMA, SMMA, WMA, VWMA). The indicator helps traders gauge both short-term and long-term price trends, allowing for a clearer understanding of market dynamics.
⯁ KEY FEATURES AND HOW TO USE
⯌ Multi-Timeframe Moving Averages :
The indicator allows traders to select up to four MAs, each from different timeframes. These timeframes can be set in the input settings (e.g., Daily, Weekly, Monthly), and each moving average can be displayed with its corresponding timeframe label directly on the chart.
Example of different timeframes for MAs:
⯌ Moving Average Types :
Users can choose from several types of moving averages, including SMA, EMA, SMMA, WMA, and VWMA, making the indicator adaptable to different strategies and market conditions. This flexibility allows traders to tailor the MAs to their preference.
Example of different types of MAs:
⯌ Dashboard Display :
The indicator includes a built-in dashboard that shows each MA, its timeframe, and whether the price is currently above or below that MA. This dashboard provides a quick overview of the trend across different timeframes, allowing traders to determine whether the overall trend is up or down.
Example of trend overview via the dashboard:
⯌ Polyline Representation :
Each MA is plotted using polylines to avoid plot functions and create a curves across up to 4000 bars back, ensuring that historical data is visualized clearly for a deeper analysis of how the price interacts with these levels over time.
if barstate.islast
for i = 0 to 4000
cp.push(chart.point.from_index(bar_index , ma ))
polyline.delete(polyline.new(cp, curved = false, line_color = color, line_style = style) )
Example of polylines for moving averages:
⯌ Customization Options :
Traders can customize the length of the MAs for all timeframes using a single input. The color, style (solid, dashed, dotted) of each moving average are also customizable, giving users full control over the visual appearance of the indicator on their chart.
Example of custom MA styles:
⯁ USER INPUTS
MA Type : Select the type of moving average for each timeframe (SMA, EMA, SMMA, WMA, VWMA).
Timeframe : Choose the timeframe for each moving average (e.g., Daily, Weekly, Monthly).
MA Length : Set the length for the moving averages, which will be applied to all four MAs.
Line Style : Customize the style of each MA line (solid, dashed, or dotted).
Colors : Set the color for each MA for better visual distinction.
⯁ CONCLUSION
The MA Multi-Timeframe indicator is a versatile and powerful tool for traders looking to monitor price trends across multiple timeframes with different types of moving averages. The dashboard simplifies trend identification, while the customizable options make it easy to adapt to individual trading strategies. Whether you're analyzing short-term price movements or long-term trends, this indicator offers a comprehensive solution for tracking market direction.

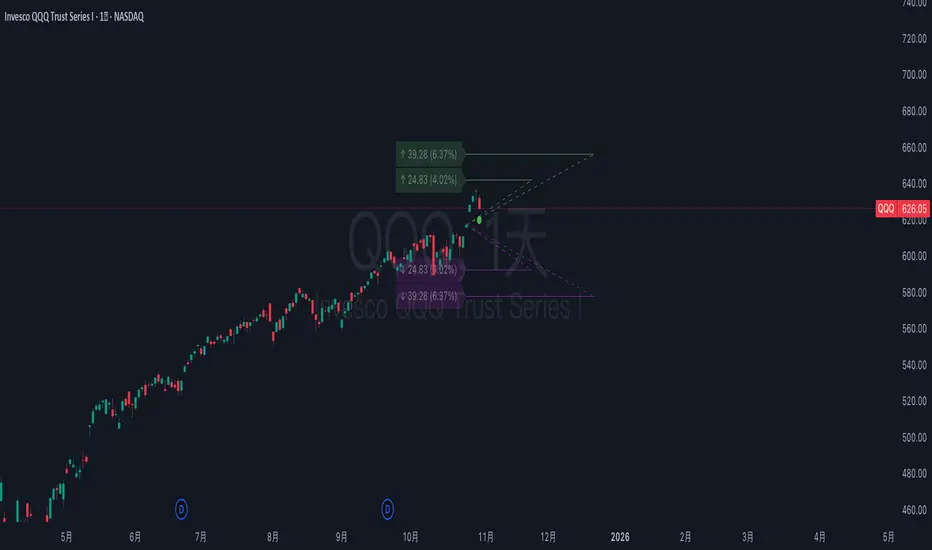
Options Betting Range - Extended# Options Betting Range - Extended
**Options Betting Range - Extended** is a versatile TradingView indicator designed to assist traders in identifying and visualizing optimal options trading ranges for multiple symbols. By leveraging predefined prediction and execution dates along with specific high and low price points, this indicator dynamically draws trendlines to highlight potential options betting zones, enhancing your trading strategy and decision-making process.
## **Key Features**
- **Multi-Symbol Support:** Automatically adapts to popular symbols such as SPY, IWM, QQQ, DIA, TLT, and GOOG, providing tailored options betting ranges for each.
- **Dynamic Trendlines:** Draws both dashed and solid trendlines based on user-defined prediction and execution dates, clearly marking high and low price boundaries.
- **Customizable Parameters:** Easily configure prediction and execution dates, high and low prices, and timezones to suit your specific trading requirements.
- **Single Execution:** Ensures that each trendline is drawn only once per specified prediction date, preventing clutter and maintaining chart clarity.
- **Clear Visual Indicators:** Utilizes color-coded labels to denote high (green) and low (red) price points, making it easy to identify critical trading levels at a glance.
## **How It Works**
1. **Initialization:**
- Upon adding the indicator to your chart, it initializes with predefined symbols and their corresponding high and low price points for two trendlines each.
2. **Configuration:**
- **Trendline 1:**
- **Prediction Date:** Set the year, month, and day when the trendline should be predicted.
- **Execution Date:** Define the year, month, and day when the trendline will be executed.
- **Timezone:** Choose the appropriate timezone to ensure accurate date matching.
- **Trendline 2:**
- Similarly, configure the prediction and execution dates along with the timezone.
3. **Trendline Drawing:**
- On reaching the specified prediction date, the indicator draws dashed trendlines representing the high and low price ranges.
- Solid trendlines are then drawn to solidify the high and low price boundaries.
- Labels are added to clearly mark the high and low price points on the chart.
4. **Visualization:**
- The trendlines and labels provide a visual framework for potential options trading ranges, allowing traders to make informed decisions based on these predefined levels.
## **How to Use**
1. **Add the Indicator:**
- Open your TradingView chart and apply the **Options Betting Range - Extended** indicator.
2. **Select a Symbol:**
- Ensure that the chart is set to one of the supported symbols (e.g., SPY, IWM, QQQ, DIA, TLT, GOOG) to activate the corresponding trendline configurations.
3. **Configure Trendline Parameters:**
- Access the indicator settings to input your desired prediction and execution dates, high and low prices, and select the appropriate timezone for each trendline.
4. **Monitor Trendlines:**
- As the chart progresses to the specified prediction dates, observe the dynamically drawn trendlines and labels indicating the options betting ranges.
5. **Make Informed Trades:**
- Utilize the visual cues provided by the trendlines to identify optimal entry and exit points for your options trading strategies.
## **Benefits**
- **Enhanced Strategy Visualization:** Clearly outlines potential trading ranges, aiding in the formulation and execution of precise options strategies.
- **Time-Saving Automation:** Automatically draws trendlines based on your configurations, reducing the need for manual chart analysis.
- **Improved Decision-Making:** Provides objective price levels for trading, minimizing emotional bias and enhancing analytical precision.
## **Important Considerations**
- **Timezone Accuracy:** Ensure that the timezones selected in the indicator settings align with your chart's timezone to maintain accurate date matching.
- **Chart Timeframe:** The prediction dates should correspond to the timeframe of your chart (e.g., daily, hourly) to ensure that trendlines are triggered correctly.
- **Visible Price Range:** Verify that the high and low prices set for trendlines are within the visible range of your chart to ensure that all trendlines and labels are clearly visible.
## **Conclusion**
**Options Betting Range - Extended** is a powerful tool for traders seeking to automate and visualize their options trading ranges across multiple symbols. By providing clear, customizable trendlines based on specific prediction and execution dates, this indicator enhances your ability to identify and act upon strategic trading opportunities with confidence.
---
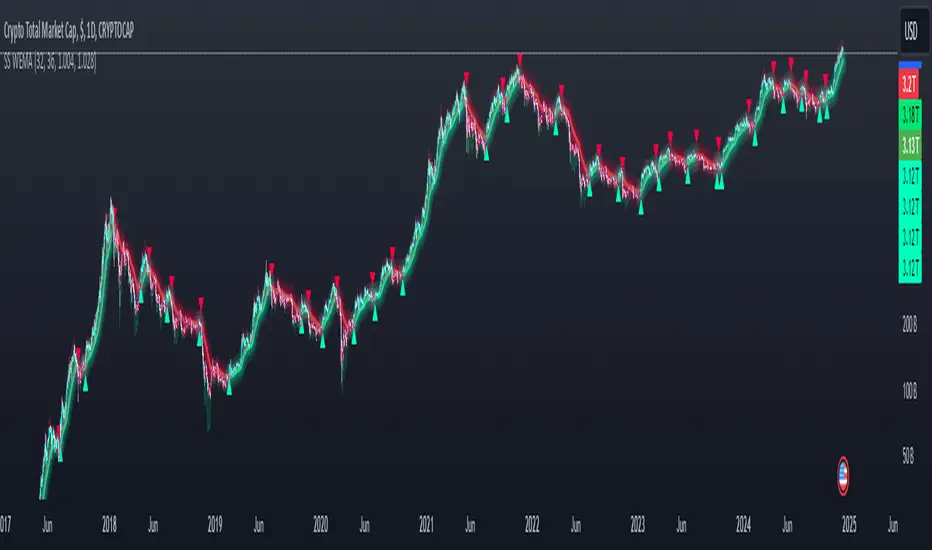
Smoothed Source Weighted EMAThe Smoothed Source EMA is a tool designed to help traders identify potential buying and selling opportunities in the market. It combines two key elements: price smoothing (using standard deviation) and an Exponential Moving Average (EMA). The purpose is to filter out the day-to-day price fluctuations and create clearer buy and sell signals.
Key Concepts Behind the Indicator:
Price Smoothing (Standard Deviation):
To make the price action easier to follow, the indicator first "smooths" the price. This is done by looking at how much the price tends to move up and down (known as standard deviation).
It then creates two "bands" around the current price—one above and one below. These bands represent a smoothed version of the price and help filter out the noise caused by small, random price movements.
Exponential Moving Average (EMA):
The indicator also uses an Exponential Moving Average (EMA), which is a line that represents the average price over a certain period of time (but gives more weight to recent prices). The EMA helps capture the general trend of the price.
The indicator uses this EMA to compare the current price with the overall trend.
How Does the Indicator Work?
Once the indicator calculates the smoothed price bands and the EMA, it looks for specific conditions to trigger a buy or sell signal:
Long (Buy) Signal:
A buy signal happens when the smoothed price (the lower band) is above the EMA. In simple terms, the price is moving up, and the indicator is telling you it's a good time to buy.
The more "weight" or influence you give to the EMA, the slower this buy signal will appear, meaning it’ll only trigger when there’s a strong enough upward movement.
Short (Sell) Signal:
A sell signal occurs when the smoothed price (the upper band) is below the EMA. This suggests the price is moving down, and the indicator signals that it might be time to sell.
Again, the more "weight" you put on the EMA, the slower the sell signal will appear, as the indicator waits for a clearer downtrend.
Why is this Useful for Traders?
Smoothing the Price: Many traders struggle with the noise of price fluctuations, where the price moves up and down quickly without a clear trend. By smoothing the price, this indicator helps traders focus on the bigger picture and avoid reacting to every small movement.
Clear Buy and Sell Signals: The indicator generates easy-to-understand buy and sell signals based on the relationship between the smoothed price and the EMA. If the price is above the smoothed level and EMA, it’s a signal to buy. If it’s below, it’s a signal to sell.
Customizable Sensitivity: The indicator lets traders adjust how sensitive the buy and sell signals are. By changing certain settings, such as the smoothing length and the weight of the EMA, traders can make the indicator react faster or slower depending on how quickly they want to catch changes in the market.
How the Indicator Appears on the Chart:
EMA Line: A line that represents the trend of the price.
Upper and Lower Smoothed Bands: Two bands above and below the price that help identify when the price is moving up or down relative to the trend.
Buy and Sell Arrows: Small arrows on the chart show where the indicator suggests buying or selling.
Colored Bars: The bars on the chart may change color to visually indicate whether the indicator suggests a buy (green) or a sell (red).
In Summary:
The Smoothed Source EMA helps you identify trends by smoothing out price movements using standard deviation, then comparing these smoothed prices with the Exponential Moving Average (EMA).
When the smoothed price moves above or below the EMA, it gives you a signal: a buy when the smoothed price is above the EMA, and a sell when it’s below.
You can adjust how quickly or slowly these signals appear by modifying the settings, giving you control over how sensitive the indicator is to changes in the market.
This indicator is useful for traders who want to reduce noise and focus on the overall trend, using clear, visually simple signals to guide their trading decisions.
Tomas' Financial Conditions Z Score"The indicator is a composite z-score comprised of the following four components (equally-weighted):
Credit spreads - ICE BofA High Yield Option Adjusted Spread (BAMLH0A0HYM2) and ICE BofA Corporate Index Option Adjusted Spread (BAMLC0A0CM)
Volatility indexes - VIX (S&P 500 implied volatility) and MOVE (US Treasury bond implied volatility)
I've got it set to a 160-day lookback period, which I think is roughly the best setting after some tinkering.
When the z-score is above zero, it throws a red signal - and when the z-score is below zero, it throws a green signal.
This indicator is a follow-on from the "traffic light financial conditions indicator" that I wrote a thread about a couple of months ago.
I moved on from that previous indicator because it is based on the Federal Reserve's NFCI, which is regularly revised, but I didn't take that into account at the time.
So not a great real-time indicator, if the signal can be subsequently revised in the opposite direction weeks later.
This new indicator is based on real-time market data, so there's no revisions, and it also updates daily, as opposed to weekly for the NFCI"

Intraday Trend CandlesThe Intraday Trend Candles (ITC) indicator is a Pine Script-based tool designed for traders seeking to visualize market trends effectively. Using a combination of the Look Back Period, a multiplier for true range, and linearly weighted moving averages (LWMA), this indicator calculates dynamic trend limits that adapt to price movements. It identifies key trend shifts by comparing the current price to these dynamic thresholds, resulting in a visually intuitive display of market bias directly on the chart. The indicator is particularly well-suited for intraday trading, as it provides responsive insights tailored to short-term price action.
The ITC plots color-coded candles, highlighting bullish trends in blue and bearish trends in yellow, with gray indicating indecision or trend continuation. This color-coded approach makes it easy to identify reversals and trend dynamics at a glance. Additionally, a trend line is plotted to enhance clarity, signaling whether the price is favoring the upper or lower threshold of the calculated range. With built-in alerts for trend reversals, traders can stay informed about critical market shifts without constantly monitoring the chart. This combination of visual cues and alerts makes the ITC a versatile and powerful tool for traders focusing on momentum and trend-following strategies.

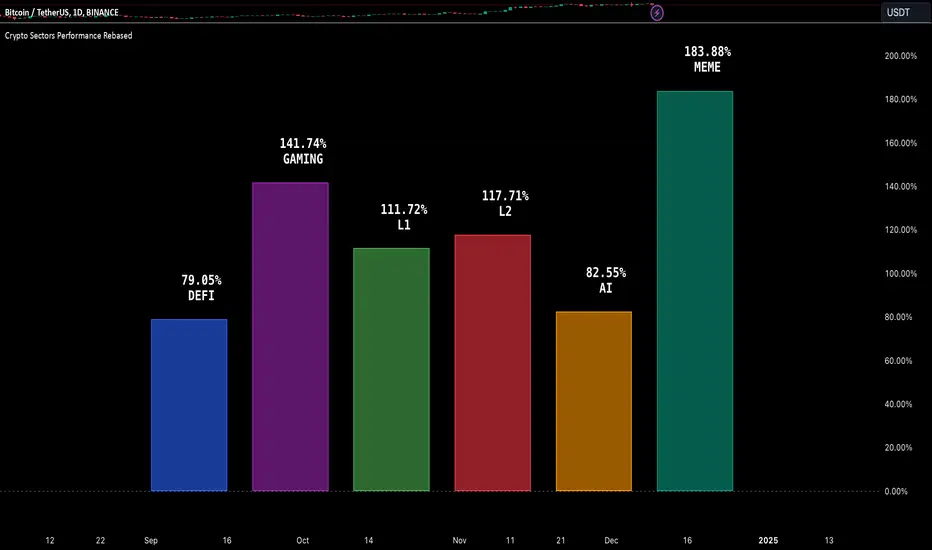
Crypto Sectors Performance [Daveatt]IMPORTANT
⚠️ This script must be used on the Daily timeframe only.
OVERVIEW
This indicator brings the powerful sector analysis capabilities from velo.xyz/market's
Sector Performance chart to TradingView.
It enables traders to track and compare performance across the crypto market's major sectors, providing essential insights for sector rotation strategies and market analysis.
CALCULATION METHOD
The indicator calculates performance across six key crypto sectors: DeFi, Gaming, Layer 1s, Layer 2s, AI, and Memecoins.
For each sector, it computes a rolling percentage performance by averaging the performance of multiple representative tokens.
All sector performances are rebased to 0% at the start of each period, making relative comparisons clear and intuitive.
VISUALIZATION MODES
The script features two distinct visualization methods:
Plots Mode:
Displays continuous performance lines for each sector over time, ideal for tracking relative strength trends and sector momentum. Each sector has its own color-coded line with performance values clearly marked.
Bars Mode:
Presents current sector performance as vertical bars, offering an immediate visual comparison of sector gains and losses.
The bars are color-coded and labeled with exact percentage values for precise analysis.
For the "Bars Mode", I used the box.new() function
SECTOR COMPOSITION
Each sector comprises carefully selected representative tokens:
- DeFi: AAVE, 1INCH, JUP, MKR, UNI
- Gaming: GALA, AXS, RONIN, SAND
- Layer 1: BTC, ETH, AVAX, APT, SOL, BNB, SUI
- Layer 2: ARB, OP, ZK, POL, STRK, MNT
- AI: FET, NEAR, RENDER, TAO
- Memecoins: PEPE, BONK, SHIB, DOGE, WIFU, POPCAT
PERFORMANCE TRACKING
The indicator implements a rolling window approach for performance calculations.
Starting from 0% at the beginning of each period, it tracks relative performance with positive values indicating outperformance and negative values showing underperformance.
Multiple timeframe options (1W, 1M, 3M, 6M, and 1Y) allow for both short-term and long-term analysis.
APPLICATIONS
This tool proves invaluable for:
- Sector rotation analysis
- Identifying trending sectors
- Comparing relative strength
- Gauging market sentiment
- Understanding market structure through sector performance
Thanks for reading and for the support
Daveatt
Candled LWMA (Loacally Weighted MA)The Locally Weighted Moving Average (LWMA) is a type of moving average that emphasizes recent data points by assigning them higher weights compared to older values. Unlike the Simple Moving Average (SMA), which treats all data points equally, or the Exponential Moving Average (EMA), which uses a fixed weighting factor, the LWMA applies a linear weighting scheme. This means that the most recent prices contribute more significantly to the average, making the LWMA more responsive to price changes while retaining a smooth curve.
In trading, the LWMA is particularly useful for identifying trends and detecting price reversals with reduced lag. By giving more importance to the latest prices, it provides a clearer picture of the current market dynamics. Traders often use the LWMA in combination with other indicators to confirm trends or spot potential entry and exit points. The adjustable length parameter allows for fine-tuning the indicator to match different market conditions and trading styles. Its ability to adapt to recent price behavior makes it a valuable tool for both short-term and long-term traders.

Fibonacci Zone with Latest Entries and LinesОписание работы скрипта: "Fibonacci Zone with Latest Entries and Lines"
Этот скрипт предназначен для анализа тренда и автоматического отображения ключевых уровней Фибоначчи и точек входа на графике. Он помогает трейдерам находить сильные зоны для открытия позиций и строить стратегию на основе актуальных данных.
Основные функции:
1. Уровни Фибоначчи:
Скрипт автоматически определяет последние максимум (high) и минимум (low) за выбранный период.
Строятся три линии Фибоначчи:
0% — соответствует последнему минимуму.
50% — срединный уровень.
100% — соответствует последнему максимуму.
Эти линии отображают ключевые уровни поддержки и сопротивления, где цена может отреагировать.
2. Трендовые точки входа:
Скрипт анализирует локальный и глобальный тренды:
Локальный тренд рассчитывается на основе короткой скользящей средней (по умолчанию 20 свечей).
Глобальный тренд рассчитывается на основе длинной скользящей средней (по умолчанию 50 свечей).
Если оба тренда совпадают (оба растущие или оба падающие), скрипт отображает точку входа:
Бычий вход — на уровне последнего минимума.
Медвежий вход — на уровне последнего максимума.
На графике отображаются только две последние точки входа, чтобы минимизировать загромождение.
3. Динамическое обновление данных:
Скрипт автоматически удаляет старые уровни Фибоначчи и точки входа, отображая только актуальные.
Как использовать:
1. Уровни Фибоначчи:
Линии 0%, 50% и 100% помогут определить ключевые зоны на графике.
Используйте эти уровни для оценки вероятных точек разворота цены или продолжения движения.
2. Точки входа:
Зеленая точка на графике указывает на возможный бычий вход (покупка).
Красная точка на графике указывает на возможный медвежий вход (продажа).
Эти точки основаны на совпадении трендов и позволяют искать оптимальные моменты для открытия позиций.
3. Адаптация параметров:
Вы можете настроить длину периодов для локального и глобального трендов (по умолчанию 20 и 50 свечей соответственно).
Также можно изменить период для расчета диапазона Фибоначчи (по умолчанию 50 свечей).
Преимущества:
Автоматическое определение тренда и ключевых зон.
Отображение только актуальных данных: самые новые уровни Фибоначчи и последние точки входа.
Простота использования даже для начинающих трейдеров.
Примечание:
Этот скрипт не является торговым сигналом. Используйте его в сочетании с другими инструментами анализа и соблюдайте правила управления рисками.
---
Теперь этот текст можно использовать для публикации, он понятен и информативен для трейдеров любого уровня подготовки.

[blackcat] L1 Main life line oscillator█ OVERVIEW
The Pine Script provided is an indicator named " L1 Main life line oscillator." Its primary function is to calculate and plot two oscillators: the Main Force and the Life Line. These oscillators are derived from smoothed price data, and the script also detects and labels crossovers and crossunders between the two lines, which can be used to generate buy and sell signals.
█ FEATURES
Key Features:
• Input Parameters: Users can define the period (n) and the weight for the oscillators.
• Custom Function: A function calculate_life_line_oscillator is defined to compute the Main Force and Life Line oscillators.
• Advanced Calculations: The script uses an adaptive moving average (ALMA) and exponential moving average (EMA) to smooth the price data and calculate the oscillators.
• Crossover and Crossunder Detection: Built-in functions ta.crossover and ta.crossunder are used to identify signal points.
• Label Drawing: Custom labels are drawn on the chart to indicate buy ("B") and sell ("S") signals.
█ HOW TO USE
1 — Configure Input Parameters: Adjust the period (n) and weight to suit your trading strategy.
2 — Interpret the Oscillators: Observe the Main Force and Life Line on the chart.
3 — Act on Signals: Look for crossovers and crossunders to generate buy and sell signals. Buy signals are indicated by the label "B" and sell signals by "S".
█ LIMITATIONS
• Lag in Signals: While the use of ALMA and EMA reduces lag, some delay may still occur, especially in volatile markets.
• False Signals: Crossovers and crossunders can sometimes produce false signals, so it is advisable to use this indicator in conjunction with other tools for confirmation.
█ NOTES
Advanced Pine Script Features:
• Adaptive Moving Average (ALMA): Provides a more responsive and adaptive oscillator.
• Exponential Moving Average (EMA): Smooths the price range and Main Force values.
• Crossover and Crossunder Detection: Utilizes built-in functions for signal identification.
• Label Drawing: Enhances visual signaling with custom labels.
Optimization Techniques:
• The use of ALMA and EMA helps in reducing lag and improving the responsiveness of the oscillators.
• The custom function encapsulates complex calculations, making the main script cleaner and more maintainable.
Unique Approaches:
• The combination of ALMA and EMA to create the Main Force oscillator provides a unique smoothing method.
• The Life Line is calculated using a weighted average of the previous and current Main Force values, adding an additional layer of smoothing and responsiveness.
█ THANKS
Thank you for using the " L1 Main life line oscillator." If you have any questions or suggestions, please feel free to reach out in the comments or on the TradingView or my Discord channel.
█ EXTENDED KNOWLEDGE AND APPLICATIONS
Potential Modifications:
• Additional Indicators: Extend the script to include other technical indicators (e.g., RSI, MACD) for a more comprehensive trading signal system.
• Customizable Colors and Styles: Allow users to customize the colors and styles of the plotted lines and labels.
• Alerts: Implement alerts for crossovers and crossunders to notify users in real-time.
Application Scenarios:
• Intraday Trading: The responsiveness of the oscillators makes this script suitable for intraday trading, where quick buy and sell signals are crucial.
• Long-Term Analysis: By adjusting the period n, the script can be used for long-term trend analysis and strategic trades.
• Backtesting: The script can be modified into a strategy to backtest the performance of the oscillator-based signals against historical data.
Related Pine Script Concepts:
• Strategy Development: Understanding how to convert indicators into strategies for backtesting and live trading.
• Advanced Plotting: Exploring more advanced plotting techniques, such as using different styles and customizing plot appearances.
• Signal Validation: Techniques for validating and filtering signals to reduce false positives and improve trade accuracy.


Virgin CPR and .95 Levels BY Sai Nandhan ReddyThis indicator is designed to plot Today's CPR, Forward CPR, Virgin CPR. Along with this you can plot EMA and SMA as per user input,
Note:-
1.) .95 Levels will be plotted only when the script timeframe is Daily.
How to use:-
1.) Positions can be taken based on overlap of Today's CPR & Forward CPR or bias can be seen through this.
2.) Virgin CPR can be used as an price objective in their respective direction. These levels act as a potential reversal zone(s).
3.) Mark the required .95 Levels and uncheck it. As it can be messy due to many marked lines on chart.
Warning:-
Note that barmerge.lookahead_on is used for plotting Forward CPR using real time data . This data is fetched from real time Daily Bar. Kindly, disable the Forward CPR when switching timeframes higher than Daily, as the indicator may mislead the intended usage.

MultiLayer Acceleration/Deceleration Strategy [Skyrexio]Overview
MultiLayer Acceleration/Deceleration Strategy leverages the combination of Acceleration/Deceleration Indicator(AC), Williams Alligator, Williams Fractals and Exponential Moving Average (EMA) to obtain the high probability long setups. Moreover, strategy uses multi trades system, adding funds to long position if it considered that current trend has likely became stronger. Acceleration/Deceleration Indicator is used for creating signals, while Alligator and Fractal are used in conjunction as an approximation of short-term trend to filter them. At the same time EMA (default EMA's period = 100) is used as high probability long-term trend filter to open long trades only if it considers current price action as an uptrend. More information in "Methodology" and "Justification of Methodology" paragraphs. The strategy opens only long trades.
Unique Features
No fixed stop-loss and take profit: Instead of fixed stop-loss level strategy utilizes technical condition obtained by Fractals and Alligator to identify when current uptrend is likely to be over (more information in "Methodology" and "Justification of Methodology" paragraphs)
Configurable Trading Periods: Users can tailor the strategy to specific market windows, adapting to different market conditions.
Multilayer trades opening system: strategy uses only 10% of capital in every trade and open up to 5 trades at the same time if script consider current trend as strong one.
Short and long term trend trade filters: strategy uses EMA as high probability long-term trend filter and Alligator and Fractal combination as a short-term one.
Methodology
The strategy opens long trade when the following price met the conditions:
1. Price closed above EMA (by default, period = 100). Crossover is not obligatory.
2. Combination of Alligator and Williams Fractals shall consider current trend as an upward (all details in "Justification of Methodology" paragraph)
3. Acceleration/Deceleration shall create one of two types of long signals (all details in "Justification of Methodology" paragraph). Buy stop order is placed one tick above the candle's high of last created long signal.
4. If price reaches the order price, long position is opened with 10% of capital.
5. If currently we have opened position and price creates and hit the order price of another one long signal, another one long position will be added to the previous with another one 10% of capital. Strategy allows to open up to 5 long trades simultaneously.
6. If combination of Alligator and Williams Fractals shall consider current trend has been changed from up to downtrend, all long trades will be closed, no matter how many trades has been opened.
Script also has additional visuals. If second long trade has been opened simultaneously the Alligator's teeth line is plotted with the green color. Also for every trade in a row from 2 to 5 the label "Buy More" is also plotted just below the teeth line. With every next simultaneously opened trade the green color of the space between teeth and price became less transparent.
Strategy settings
In the inputs window user can setup strategy setting: EMA Length (by default = 100, period of EMA, used for long-term trend filtering EMA calculation). User can choose the optimal parameters during backtesting on certain price chart.
Justification of Methodology
Let's explore the key concepts of this strategy and understand how they work together. We'll begin with the simplest: the EMA.
The Exponential Moving Average (EMA) is a type of moving average that assigns greater weight to recent price data, making it more responsive to current market changes compared to the Simple Moving Average (SMA). This tool is widely used in technical analysis to identify trends and generate buy or sell signals. The EMA is calculated as follows:
1.Calculate the Smoothing Multiplier:
Multiplier = 2 / (n + 1), Where n is the number of periods.
2. EMA Calculation
EMA = (Current Price) × Multiplier + (Previous EMA) × (1 − Multiplier)
In this strategy, the EMA acts as a long-term trend filter. For instance, long trades are considered only when the price closes above the EMA (default: 100-period). This increases the likelihood of entering trades aligned with the prevailing trend.
Next, let’s discuss the short-term trend filter, which combines the Williams Alligator and Williams Fractals. Williams Alligator
Developed by Bill Williams, the Alligator is a technical indicator that identifies trends and potential market reversals. It consists of three smoothed moving averages:
Jaw (Blue Line): The slowest of the three, based on a 13-period smoothed moving average shifted 8 bars ahead.
Teeth (Red Line): The medium-speed line, derived from an 8-period smoothed moving average shifted 5 bars forward.
Lips (Green Line): The fastest line, calculated using a 5-period smoothed moving average shifted 3 bars forward.
When the lines diverge and align in order, the "Alligator" is "awake," signaling a strong trend. When the lines overlap or intertwine, the "Alligator" is "asleep," indicating a range-bound or sideways market. This indicator helps traders determine when to enter or avoid trades.
Fractals, another tool by Bill Williams, help identify potential reversal points on a price chart. A fractal forms over at least five consecutive bars, with the middle bar showing either:
Up Fractal: Occurs when the middle bar has a higher high than the two preceding and two following bars, suggesting a potential downward reversal.
Down Fractal: Happens when the middle bar shows a lower low than the surrounding two bars, hinting at a possible upward reversal.
Traders often use fractals alongside other indicators to confirm trends or reversals, enhancing decision-making accuracy.
How do these tools work together in this strategy? Let’s consider an example of an uptrend.
When the price breaks above an up fractal, it signals a potential bullish trend. This occurs because the up fractal represents a shift in market behavior, where a temporary high was formed due to selling pressure. If the price revisits this level and breaks through, it suggests the market sentiment has turned bullish.
The breakout must occur above the Alligator’s teeth line to confirm the trend. A breakout below the teeth is considered invalid, and the downtrend might still persist. Conversely, in a downtrend, the same logic applies with down fractals.
In this strategy if the most recent up fractal breakout occurs above the Alligator's teeth and follows the last down fractal breakout below the teeth, the algorithm identifies an uptrend. Long trades can be opened during this phase if a signal aligns. If the price breaks a down fractal below the teeth line during an uptrend, the strategy assumes the uptrend has ended and closes all open long trades.
By combining the EMA as a long-term trend filter with the Alligator and fractals as short-term filters, this approach increases the likelihood of opening profitable trades while staying aligned with market dynamics.
Now let's talk about Acceleration/Deceleration signals. AC indicator is calculated using the Awesome Oscillator, so let's first of all briefly explain what is Awesome Oscillator and how it can be calculated. The Awesome Oscillator (AO), developed by Bill Williams, is a momentum indicator designed to measure market momentum by contrasting recent price movements with a longer-term historical perspective. It helps traders detect potential trend reversals and assess the strength of ongoing trends.
The formula for AO is as follows:
AO = SMA5(Median Price) − SMA34(Median Price)
where:
Median Price = (High + Low) / 2
SMA5 = 5-period Simple Moving Average of the Median Price
SMA 34 = 34-period Simple Moving Average of the Median Price
The Acceleration/Deceleration (AC) Indicator, introduced by Bill Williams, measures the rate of change in market momentum. It highlights shifts in the driving force of price movements and helps traders spot early signs of trend changes. The AC Indicator is particularly useful for identifying whether the current momentum is accelerating or decelerating, which can indicate potential reversals or continuations. For AC calculation we shall use the AO calculated above is the following formula:
AC = AO − SMA5(AO), where SMA5(AO)is the 5-period Simple Moving Average of the Awesome Oscillator
When the AC is above the zero line and rising, it suggests accelerating upward momentum.
When the AC is below the zero line and falling, it indicates accelerating downward momentum.
When the AC is below zero line and rising it suggests the decelerating the downtrend momentum. When AC is above the zero line and falling, it suggests the decelerating the uptrend momentum.
Now we can explain which AC signal types are used in this strategy. The first type of long signal is when AC value is below zero line. In this cases we need to see three rising bars on the histogram in a row after the falling one. The second type of signals occurs above the zero line. There we need only two rising AC bars in a row after the falling one to create the signal. The signal bar is the last green bar in this sequence. The strategy places the buy stop order one tick above the candle's high, which corresponds to the signal bar on AC indicator.
After that we can have the following scenarios:
Price hit the order on the next candle in this case strategy opened long with this price.
Price doesn't hit the order price, the next candle set lower high. If current AC bar is increasing buy stop order changes by the script to the high of this new bar plus one tick. This procedure repeats until price finally hit buy order or current AC bar become decreasing. In the second case buy order cancelled and strategy wait for the next AC signal.
If long trades are initiated, the strategy continues utilizing subsequent signals until the total number of trades reaches a maximum of 5. All open trades are closed when the trend shifts to a downtrend, as determined by the combination of the Alligator and Fractals described earlier.
Why we use AC signals? If currently strategy algorithm considers the high probability of the short-term uptrend with the Alligator and Fractals combination pointed out above and the long-term trend is also suggested by the EMA filter as bullish. Rising AC bars after period of falling AC bars indicates the high probability of local pull back end and there is a high chance to open long trade in the direction of the most likely main uptrend. The numbers of rising bars are different for the different AC values (below or above zero line). This is needed because if AC below zero line the local downtrend is likely to be stronger and needs more rising bars to confirm that it has been changed than if AC is above zero.
Why strategy use only 10% per signal? Sometimes we can see the false signals which appears on sideways. Not risking that much script use only 10% per signal. If the first long trade has been open and price continue going up and our trend approximation by Alligator and Fractals is uptrend, strategy add another one 10% of capital to every next AC signal while number of active trades no more than 5. This capital allocation allows to take part in long trades when current uptrend is likely to be strong and use only 10% of capital when there is a high probability of sideways.
Backtest Results
Operating window: Date range of backtests is 2023.01.01 - 2024.11.01. It is chosen to let the strategy to close all opened positions.
Commission and Slippage: Includes a standard Binance commission of 0.1% and accounts for possible slippage over 5 ticks.
Initial capital: 10000 USDT
Percent of capital used in every trade: 10%
Maximum Single Position Loss: -5.15%
Maximum Single Profit: +24.57%
Net Profit: +2108.85 USDT (+21.09%)
Total Trades: 111 (36.94% win rate)
Profit Factor: 2.391
Maximum Accumulated Loss: 367.61 USDT (-2.97%)
Average Profit per Trade: 19.00 USDT (+1.78%)
Average Trade Duration: 75 hours
How to Use
Add the script to favorites for easy access.
Apply to the desired timeframe and chart (optimal performance observed on 3h BTC/USDT).
Configure settings using the dropdown choice list in the built-in menu.
Set up alerts to automate strategy positions through web hook with the text: {{strategy.order.alert_message}}
Disclaimer:
Educational and informational tool reflecting Skyrex commitment to informed trading. Past performance does not guarantee future results. Test strategies in a simulated environment before live implementation
These results are obtained with realistic parameters representing trading conditions observed at major exchanges such as Binance and with realistic trading portfolio usage parameters.

Prakash Behura_20 EMA & 100 EMA (High/Low/Close)20 and 100 EMAs (exponential moving average) with High, Low, Close.

BB levels with Open and CloseThis indicator marks what is known as the BB system - Marks on your chart the :
premarket high and low,
current intraday high and low and
yesterday's Open, high, low and Close.
The screenshot is not showing horizontal lines, but you should see them when you add this to your charts.
Pick and select which levels you would like using the indicator and you can also turn on and off the labels if you don't want them.

[blackcat] L1 Institutional Golden Bottom Indicator█ OVERVIEW
The script " L1 Institutional Golden Bottom Indicator" is an indicator designed to identify potential institutional buying interest or a "golden bottom" in the market. It calculates a series of values based on price movements and plots them on a chart to help traders make informed decisions.
█ LOGICAL FRAMEWORK
The script is structured into several main sections:
1 — Function Definitions: Custom functions xsa and calculate_institutional_golden_bottom are defined.
2 — Input Parameters: The user can set a threshold value for institutional interest.
3 — Calculations: The script calculates various indicators and conditions, including the institutional buy signal.
4 — Plotting: The results of the calculations are plotted on the chart.
5 — Labeling: When a golden bottom is detected, a label is placed on the chart.
The flow of data starts with the input parameters, proceeds through the calculation functions, and finally results in plotted outputs and labels.
█ CUSTOM FUNCTIONS
1 — xsa(src, len, wei)
• Purpose: To calculate a weighted moving average.
• Parameters:
– src: Source data (e.g., price).
– len: Length of the moving average.
– wei: Weighting factor.
• Return Value: The calculated weighted moving average.
2 — calculate_institutional_golden_bottom(close, high, low, threshold)
• Purpose: To determine the institutional golden bottom indicator.
• Parameters:
– close: Closing price.
– high: Highest price.
– low: Lowest price.
– threshold: User-defined threshold for institutional interest. By tuning the threshold value the user can properly identify the institutional golden bottom of the instrument. So, I can say this parameter is used to tune the "sensitivity" of this indicator.
• Return Value: An array containing the institutional indicator, golden bottom signal, and additional values (a1, b1, c1, d1).
█ KEY POINTS AND TECHNIQUES
• Weighted Moving Average (WMA): The xsa function implements a weighted moving average, which is useful for smoothing price data.
• Crossover Detection: The script uses a crossover condition to detect when the institutional indicator crosses above the threshold, indicating a potential buying opportunity.
• Conditional Logic: The script includes conditional statements to control the output of certain values only when specific conditions are met.
• Plotting and Labeling: The script uses plot and label.new functions to visualize the indicator and highlight significant events on the chart.
█ EXTENDED KNOWLEDGE AND APPLICATIONS
• Modifications: The script could be enhanced by adding more customizable parameters, such as different lengths for the moving averages or additional conditions for the golden bottom signal.
• Extensions: Similar techniques could be applied to other types of indicators, such as momentum oscillators or trend-following systems to identify market turning points.
• Related Concepts: Understanding weighted moving averages, crossover signals, and conditional plotting in Pine Script would be beneficial for enhancing this script and applying similar logic to other trading strategies.

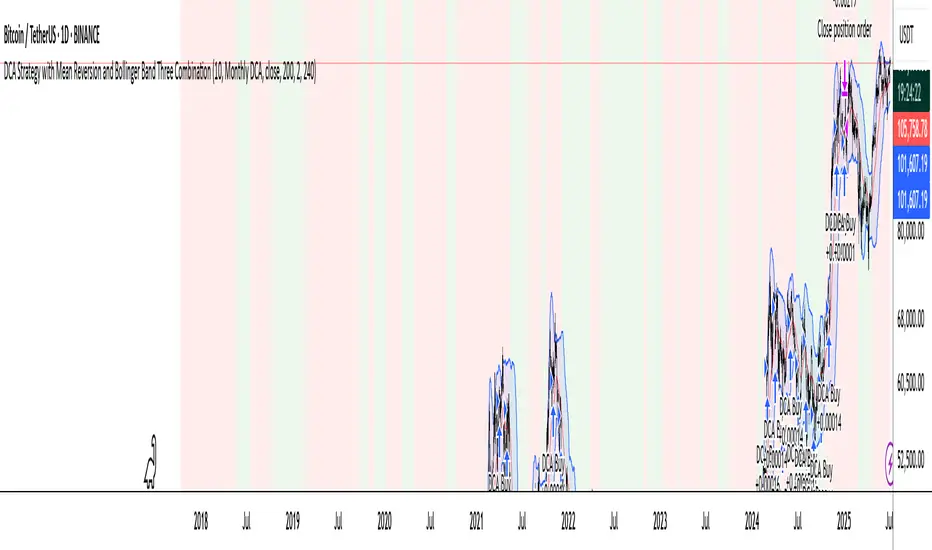
DCA Strategy with Mean Reversion and Bollinger BandDCA Strategy with Mean Reversion and Bollinger Band
The Dollar-Cost Averaging (DCA) Strategy with Mean Reversion and Bollinger Bands is a sophisticated trading strategy that combines the principles of DCA, mean reversion, and technical analysis using Bollinger Bands. This strategy aims to capitalize on market corrections by systematically entering positions during periods of price pullbacks and reversion to the mean.
Key Concepts and Principles
1. Dollar-Cost Averaging (DCA)
DCA is an investment strategy that involves regularly purchasing a fixed dollar amount of an asset, regardless of its price. The idea behind DCA is that by spreading out investments over time, the impact of market volatility is reduced, and investors can avoid making large investments at inopportune times. The strategy reduces the risk of buying all at once during a market high and can smooth out the cost of purchasing assets over time.
In the context of this strategy, the Investment Amount (USD) is set by the user and represents the amount of capital to be invested in each buy order. The strategy executes buy orders whenever the price crosses below the lower Bollinger Band, which suggests a potential market correction or pullback. This is an effective way to average the entry price and avoid the emotional pitfalls of trying to time the market perfectly.
2. Mean Reversion
Mean reversion is a concept that suggests prices will tend to return to their historical average or mean over time. In this strategy, mean reversion is implemented using the Bollinger Bands, which are based on a moving average and standard deviation. The lower band is considered a potential buy signal when the price crosses below it, indicating that the asset has become oversold or underpriced relative to its historical average. This triggers the DCA buy order.
Mean reversion strategies are popular because they exploit the natural tendency of prices to revert to their mean after experiencing extreme deviations, such as during market corrections or panic selling.
3. Bollinger Bands
Bollinger Bands are a technical analysis tool that consists of three lines:
Middle Band: The moving average, usually a 200-period Exponential Moving Average (EMA) in this strategy. This serves as the "mean" or baseline.
Upper Band: The middle band plus a certain number of standard deviations (multiplier). The upper band is used to identify overbought conditions.
Lower Band: The middle band minus a certain number of standard deviations (multiplier). The lower band is used to identify oversold conditions.
In this strategy, the Bollinger Bands are used to identify potential entry points for DCA trades. When the price crosses below the lower band, this is seen as a potential opportunity for mean reversion, suggesting that the asset may be oversold and could reverse back toward the middle band (the EMA). Conversely, when the price crosses above the upper band, it indicates overbought conditions and signals potential market exhaustion.
4. Time-Based Entry and Exit
The strategy has specific entry and exit points defined by time parameters:
Open Date: The date when the strategy begins opening positions.
Close Date: The date when all positions are closed.
This time-bound approach ensures that the strategy is active only during a specified window, which can be useful for testing specific market conditions or focusing on a particular time frame.
5. Position Sizing
Position sizing is determined by the Investment Amount (USD), which is the fixed amount to be invested in each buy order. The quantity of the asset to be purchased is calculated by dividing the investment amount by the current price of the asset (investment_amount / close). This ensures that the amount invested remains constant despite fluctuations in the asset's price.
6. Closing All Positions
The strategy includes an exit rule that closes all positions once the specified close date is reached. This allows for controlled exits and limits the exposure to market fluctuations beyond the strategy's timeframe.
7. Background Color Based on Price Relative to Bollinger Bands
The script uses the background color of the chart to provide visual feedback about the price's relationship with the Bollinger Bands:
Red background indicates the price is above the upper band, signaling overbought conditions.
Green background indicates the price is below the lower band, signaling oversold conditions.
This provides an easy-to-interpret visual cue for traders to assess the current market environment.
Postscript: Configuring Initial Capital for Backtesting
To ensure the backtest results align with the actual investment scenario, users must adjust the Initial Capital in the TradingView strategy properties. This is done by calculating the Initial Capital as the product of the Total Closed Trades and the Investment Amount (USD). For instance:
If the user is investing 100 USD per trade and has 10 closed trades, the Initial Capital should be set to 1,000 USD.
Similarly, if the user is investing 200 USD per trade and has 24 closed trades, the Initial Capital should be set to 4,800 USD.
This adjustment ensures that the backtesting results reflect the actual capital deployed in the strategy and provides an accurate representation of potential gains and losses.
Conclusion
The DCA strategy with Mean Reversion and Bollinger Bands is a systematic approach to investing that leverages the power of regular investments and technical analysis to reduce market timing risks. By combining DCA with the insights offered by Bollinger Bands and mean reversion, this strategy offers a structured way to navigate volatile markets while targeting favorable entry points. The clear entry and exit rules, coupled with time-based constraints, make it a robust and disciplined approach to long-term investing.
Supertrend & Bollinger BandsThis indicator plots SuperTrend and Bollinger Bands on any chart and any timeframe. The signals generated are very good and the settings can be adjusted as per the preferences of the user.

Optimal MA FinderIntroduction to the "Optimal MA Finder" Indicator
The "Optimal MA Finder" is a powerful and versatile tool designed to help traders optimize their moving average strategies. This script combines flexibility, precision, and automation to identify the most effective moving average (MA) length for your trading approach. Whether you're aiming to improve your long-only strategy or implement a buy-and-sell methodology, the "Optimal MA Finder" is your go-to solution for enhanced decision-making.
What Does It Do?
The script evaluates a wide range of moving average lengths, from 10 to 500, to determine which one produces the best results based on historical data. By calculating critical metrics such as the total number of trades and the profit factor for each MA length, it identifies the one that maximizes profitability. It supports both simple moving averages (SMA) and exponential moving averages (EMA), allowing you to tailor the analysis to your preferred method.
The logic works by backtesting each MA length against the price data and assessing the performance under two strategies:
Buy & Sell: Includes both long and short trades.
Long Only: Focuses solely on long positions for more conservative strategies.
Once the optimal MA length is identified, the script overlays it on the chart, highlighting periods when the price crosses over or under the optimal MA, helping traders identify potential entry and exit points.
Why Is It Useful?
This indicator stands out for its ability to automate a task that is often labor-intensive and subjective: finding the best MA length. By providing a clear, data-driven answer, it saves traders countless hours of manual testing while significantly enhancing the accuracy of their strategies. For example, instead of guessing whether a 50-period EMA is more effective than a 200-period SMA, the "Optimal MA Finder" will pinpoint the exact length and type of MA that has historically yielded the best results for your chosen strategy.
Key Benefits:
Precision: Identifies the MA length with the highest profit factor for maximum profitability.
Automation: Conducts thorough backtesting without manual effort.
Flexibility: Adapts to your preferred MA type (SMA or EMA) and trading strategy (Buy & Sell or Long Only).
Real-Time Feedback: Provides actionable insights by plotting the optimal MA directly on your chart and highlighting relevant trading periods.
Example of Use: Imagine you're trading a volatile stock and want to optimize your long-only strategy. By applying the "Optimal MA Finder," you discover that a 120-period EMA results in the highest profit factor. The indicator plots this EMA on your chart, showing you when to consider entering or exiting positions based on price movements relative to the EMA.
In short, the "Optimal MA Finder" empowers traders by delivering data-driven insights and improving the effectiveness of trading strategies. Its clear logic, combined with robust automation, makes it an invaluable tool for both novice and experienced traders seeking consistent results.

Buy and Sell Signal with EMA, MACD, RSI and ATROnly show buy and sell signals on multiple timeframes based on the 4 indicators combined.


