[blackcat] L2 Ehlers Stochastic RSILevel: 2
Background
John F. Ehlers introuced his Stochastic RSI in August, 2006.
Function
John Ehlers' article in August, 2006, "Modeling The Market = Building Trading Strategies," describes a process for extracting trend and cyclic elements from market data, then recombining them for trading purposes. He used the Stochastic RSI denoted the cyclic elements.
Key Signal
StochRSI--> Ehlers Stochastic RSI fast line
Trigger--> Ehlers Stochastic RSI slow line
Pros and Cons
100% John F. Ehlers definition translation, even variable names are the same. This help readers who would like to use pine to read his book.
Remarks
The 70th script for Blackcat1402 John F. Ehlers Week publication.
Readme
In real life, I am a prolific inventor. I have successfully applied for more than 60 international and regional patents in the past 12 years. But in the past two years or so, I have tried to transfer my creativity to the development of trading strategies. Tradingview is the ideal platform for me. I am selecting and contributing some of the hundreds of scripts to publish in Tradingview community. Welcome everyone to interact with me to discuss these interesting pine scripts.
The scripts posted are categorized into 5 levels according to my efforts or manhours put into these works.
Level 1 : interesting script snippets or distinctive improvement from classic indicators or strategy. Level 1 scripts can usually appear in more complex indicators as a function module or element.
Level 2 : composite indicator/strategy. By selecting or combining several independent or dependent functions or sub indicators in proper way, the composite script exhibits a resonance phenomenon which can filter out noise or fake trading signal to enhance trading confidence level.
Level 3 : comprehensive indicator/strategy. They are simple trading systems based on my strategies. They are commonly containing several or all of entry signal, close signal, stop loss, take profit, re-entry, risk management, and position sizing techniques. Even some interesting fundamental and mass psychological aspects are incorporated.
Level 4 : script snippets or functions that do not disclose source code. Interesting element that can reveal market laws and work as raw material for indicators and strategies. If you find Level 1~2 scripts are helpful, Level 4 is a private version that took me far more efforts to develop.
Level 5 : indicator/strategy that do not disclose source code. private version of Level 3 script with my accumulated script processing skills or a large number of custom functions. I had a private function library built in past two years. Level 5 scripts use many of them to achieve private trading strategy.
Cari skrip untuk "stoch"
MTF Stochastic with automatic divergenceThis is a stochastic indicator that show the stochastic in your current timeframe and also the stochastic from the timeframe above (if current is 15 mins - the above is 1 hour etc). When the 2 stochastics align the background colour highlights to emphasise that. The idea being that you have your current stochastic pushing down improving your change of a successful entry and the stochastic from above pushing down showing there is momentum in that direction.
In addition, the indicator will show when positive and negative divergence occurs on the current timeframe. Divergence can be a little subjective but it seems to find the important ones.
Finally, it highlights when the current stochastic crosses. I was finding once you squash it down it gets difficult to see so I made that easier.
For me I don't tend to use the divergence feature (which is ironic as i found it very hard to code) but being able to see what is happening on the timeframe above is a very effective filter saving me from bad trades.
The script is a little scruffy in places but neat enough to adapt to other indicators. Somewhere I have the same principle for MACD - one of these days I'll find it and make it available.
Hope thats useful to people and good luck.

Stuffed Oscillators/てんこ盛りオシレーターStuffed Oscillators
You can use Stochastic RSI, Stochastic, RSI at once.
てんこ盛りオシレーター
ストキャスティクスRSI, ストキャスティクス, RSIをいっぺんに使えます。


Adaptive StochasticAdapt To The Right Situation
There are already some Adaptive Stochastic scripts out there, but i didn't see the concept of using different periods highest/lowest for their calculations. What we want
for such oscillator is to be active when price is trending and silent during range periods. Like that the information we will see will be clear and easy to use.
Switching between a long term highest/lowest during range periods and a short term highest/lowest during trending periods is what will create the adaptive stochastic.
The switching is made thanks to the Efficiency Ratio , the period of the efficiency ratio is determined by the length parameter.
The period of the highest and lowest will depend on the slow and fast parameters, if our efficiency ratio is close to one (trending market) then the indicator will use highest and lowest of period fast , making the indicator more reactive, if our efficiency ratio is low (ranging market) then the indicator will use highest and lowest of period slow , making the indicator less reactive.
The source of the indicator is a running line ( lsma ) of period slow-fast .
it is also possible to switch the parameters values, making the indicator reactive during ranging market and less reactive during trending ones.
Hope you enjoy
For any questions/demands feel free to pm me, i would be happy to help you

NG [Multi-Stochastics]Multiple stochastic script with trend direction.
* Each base shows 3 lines multiplied by 1.618
* Possible to chose how to calculate MA of stochastics SMA, EMA, DEMA, TEMA.
* Possible to chose how to calculate trend.
* Trend adjustment is to adapt to current situation not for signals
Fast stochastics gives a lot of noise but some times good for scalping.

Market Exhaustion [WavesUnchained]Market Exhaustion
Multi-oscillator exhaustion detector combining MFI + optional CCI, HTF bias, StochRSI timing, and a divergence engine with an Exhaustion Score (0-100).
CORE CONCEPT
- Detects exhaustion via regular divergences anchored on price pivots
- Scores each divergence (0-100) using 5 components
- Line width = quality, color = direction (never thicker than main line)
OSCILLATOR MODES
- MFI : Engine uses MFI only
- CCI : Engine uses CCI mapped to 0-100
- MFI+CCI : Both plotted, engine source selectable (MFI or CCI)
EXHAUSTION SCORE (0-100)
1. Sequence (Div 1/2/3...) - repeated attempts increase score
2. Fatigue - no new oscillator extreme over lookback
3. Formation Time - bars between pivots
4. Reaction - post-divergence bounce/drop vs ATR
5. Impulse - MFI/CCI delta + swing size
DIVERGENCE ENGINE
- Price-pivot anchored (LL/HH) with osc confirmation (HL/LH)
- OS/OB gating with dynamic zones + fallback to 20/80
- Tolerant direction checks (price + osc eps)
- Auto cleanup (max objects)
HTF CONTEXT
- Auto-HTF MFI bias label
- Optional HTF filter for signals
- Bias bonus (optional) for Exhaustion Score
SIGNALS & TIMING
- StochRSI timing + MFI zone confirmation
- Context + timing signals (L/S markers)
- Zone confirm bars
VISUALIZATION
- Color-coded MFI line (OB/OS/neutral)
- Optional CCI (mapped 0-100) line
- Divergence line width = quality, endpoint markers
- Optional mid-label with score
- Dynamic zones + optional fill
BEST USE CASES
- Reversal scouting at extremes
- Filtering weak swings
- 15M-4H swing exhaustion reads
- HTF bias + divergence confluence
Version: 1.0.0
Author: WavesUnchained
Pine Script: v6

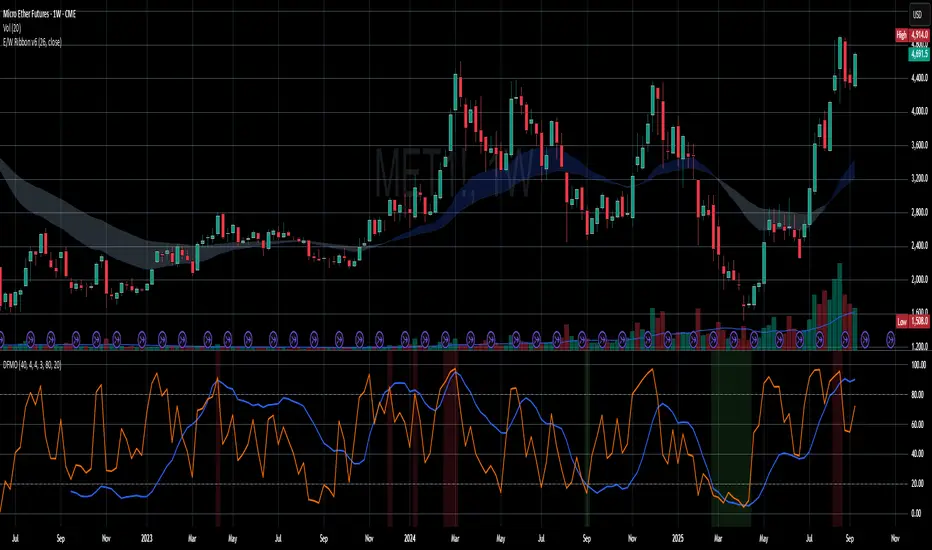
Dual-Frame Momentum OscillatorDual-Frame Momentum Oscillator (DFMO)
This is not just another oscillator. This is a confluence engine, built for the discerning trader who reads the story of price action and needs an objective tool to confirm the climax.
The Dual-Frame Momentum Oscillator was designed to solve a specific problem: how to differentiate a genuine, sustainable breakout from an exhaustive liquidity grab. It provides a visual confirmation for high-probability reversal and scalp setups by measuring momentum across two distinct time frames simultaneously.
This tool is for the trader who understands that indicators should not dictate trades, but rather confirm a well-defined thesis based on market structure, volume, and liquidity.
The Core Concept: Context Meets Trigger
The DFMO fuses a slow, methodical Stochastic with a hyper-sensitive RSI to give you a complete picture of momentum.
The Context (Slow Stochastic %K - default 40,4,4): This acts as your long-term momentum gauge. It tells you if the underlying trend is healthy or nearing exhaustion. A high reading suggests the market is overextended and vulnerable, while a low reading suggests the opposite.
The Trigger (Fast RSI - default 3): This is your immediate impulse reader. It measures the velocity and intensity of the current price thrust, making it incredibly sensitive to exhaustive moves, spikes, and bounces.
By themselves, they are useful. Together, they are formidable.
The Confluence Engine: Your Visual Edge
The true power of the DFMO lies in its "Confluence Engine." The indicator's background highlights in real-time when both oscillators are in agreement, visually flagging moments of maximum opportunity.
Bearish Confluence Zone (Red): The background turns red only when the Stochastic is overbought AND the RSI is overbought. This is your signal that the broader trend is exhausted and the current buying impulse has reached a climax. It is the ideal confirmation for a short entry following a liquidity sweep above a key high.
Bullish Confluence Zone (Green): The background turns green only when the Stochastic is oversold AND the RSI is oversold. This signals that the downtrend is tired and the immediate selling pressure is exhaustive, providing high-probability confirmation for a long entry at a key support level.
When these zones appear, the indicator is telling you that both the context and the trigger are aligned. This removes ambiguity and allows for decisive, confident execution.
Practical Application: The Liquidity Sweep
Imagine you're stalking a short on a futures contract like MCL or MES. You've marked the high of the day (HOD) as a key resistance level where liquidity is resting. You see a sharp, vertical impulse move that breaks the HOD, clearing out the stops.
Is this a real breakout, or is it a manipulation move—a classic liquidity grab?
You glance down at the DFMO. The moment price swept the high, the background flashed red. That's your objective confirmation. The slow Stoch was already overbought, and the fast RSI spiking confirmed the exhaustive, terminal nature of that price thrust. You now have the confidence to enter your short scalp, knowing you are aligned with the probable direction of the market's next move.
This is how you move from "feeling" the market to systematically executing a high-probability edge. This is how you aspire for greatness.
Add the Dual-Frame Momentum Oscillator to your toolkit and transform your ability to time entries with surgical precision.
Color Stochastic IndicatorThis Pine Script™ indicator, "Color Stochastic Indicator," is designed to visualize the stochastic oscillator with color-coded trends and shaded background levels, providing a clearer understanding of market trends and potential trading signals.
Key Features:
Customizable Parameters:
K Period: The period for the %K line in the stochastic calculation (default: 50).
D Period: The period for the %D line, which is the moving average of %K (default: 13).
Slowing: The slowing factor applied to the stochastic calculation (default: 2).
Smoothing: A factor for additional smoothing of the stochastic values (default: 1.0).
Use Crossover: Option to determine trend based on the crossover of %K and %D lines.
Display Levels: Option to show significant stochastic levels on the chart (0.2, 0.5, 0.8).
Price Field: Selection of the price field used in calculations.
Stoch Width: Line width for the %K line.
Signal Width: Line width for the %D line.
Background Colors:
Upper Level Background: Shaded area between 0.5 and 0.8 with a customizable color.
Lower Level Background: Shaded area between 0.2 and 0.5 with a customizable color.
Color-Coded Trends:
Wait (Gray): Neutral state when no clear trend is detected.
Uptrend (Green): Indicates a potential buying signal.
Downtrend (Red): Indicates a potential selling signal.
Signal Line (Blue): Represents the %D line for clearer signal identification.
Alerts:
Customizable alerts trigger when the trend changes, providing timely notifications for potential trade opportunities.
How It Works:
Stochastic Calculation:
The %K line is calculated based on the selected K Period.
The %D line is a simple moving average (SMA) of the %K line over the D Period.
Additional smoothing is applied to both %K and %D lines using the specified Smoothing factor.
Fisher Transform:
The script applies a Fisher transform to the smoothed %K values, enhancing the clarity of trend signals.
Trend Determination:
If Use Crossover is enabled, the trend is determined based on the crossover of smoothed %K and %D lines.
If Use Crossover is disabled, the trend is determined based on whether the smoothed %K value is above or below 0.5.
Background Shading:
Fixed background colors are applied using hline and fill functions, highlighting the specified levels on the chart (0.2, 0.5, 0.8).
Plotting:
The smoothed %K line is plotted with color coding based on its value relative to the %D line and threshold levels.
The %D line is plotted for reference.
How to Use:
Adding the Indicator:
Copy and paste the provided Pine Script™ code into a new indicator script in TradingView.
Save and add the indicator to your desired chart.
Configuring Parameters:
Adjust the input parameters (K Period, D Period, Slowing, etc.) according to your trading strategy and preferences.
Enable or disable the Use Crossover option based on whether you prefer trend determination by crossover or threshold.
Interpreting Signals:
Observe the color-coded %K line to identify potential buy (green) and sell (red) signals.
Use the shaded background areas to quickly assess overbought (0.5 to 0.8) and oversold (0.2 to 0.5) conditions.
Monitor alerts for trend changes to take timely trading actions.
Alerts Setup:
Set up custom alerts based on the provided alert conditions to receive notifications when the trend changes.
Originality:
This script combines the stochastic oscillator with color-coding and background shading for enhanced visualization.
It introduces a unique Fisher transform application to the smoothed %K values.
The crossover and threshold-based trend determination options provide flexibility for different trading strategies.
Customizable alert messages help traders stay informed about trend changes in real time.
By incorporating these features, the "Color Stochastic Indicator" offers a comprehensive tool for traders seeking to leverage stochastic analysis with improved clarity and actionable insights.

Reversal Candlestick Structure [LuxAlgo]The Reversal Candlestick Structure indicator detects multiple candlestick patterns occurring when trends are most likely to experience a reversal in real-time. The reversal detection method includes various settings allowing users to adjust the reversal detection algorithm more precisely.
A dashboard showing the percentage of patterns detected as reversals is also included.
🔶 USAGE
Candlestick patterns are ubiquitous to technical analysts, allowing them to detect trend continuations, reversals, and indecision.
The proposed tool effectively detects reversals by using the confluence between candlestick patterns and a reversal detection method based on the stochastic oscillator, acting as a filter for the patterns. If a candlestick pattern occurs while conditions suggest a potential reversal then the pattern is highlighted.
The displayed candle coloring allows users to observe the reversal detection method, with colored candles indicating potential reversals.
Users wanting to detect longer-term reversals can use a higher "Trend Length" setting, this can however lead to an increased amount of displayed candlestick patterns.
To prevent false positives users also have control over a "Threshold" setting in a range between (0, 100), with values closer to 100 preventing candlesticks from being detected at the start of trends.
The "Warmup Length" serves a similar purpose, and aims to prevent sudden moves to be classified as reversals. Higher values of this setting will require trends to be established for a longer period of time for reversal conditions to be detected.
🔹 Dashboard
To evaluate the role of individual candlestick patterns as potential reversal signals relative to the proposed reversal detection method, a dashboard displaying the percentage of candlestick patterns displayed (that occur when a potential reversal is detected) over the total amount detected.
Hovering on the dashboard cells of the "Reversal %" column allows displaying the total amount of patterns detected.
🔶 CANDLESTICKS PATTERNS
This tool detects 16 popular candlestick patterns, each listed in the sub-sections below.
🔹 Bullish Patterns
Hammer - A bullish reversal pattern that forms after a decline, characterized by a small body at the upper end of the trading range and a long lower shadow.
Inverted Hammer - A bullish reversal pattern that forms after a downtrend, featuring a small body at the lower end of the trading range and a long upper shadow.
Bullish Engulfing - A bullish reversal pattern where a small bearish candlestick is followed by a larger bullish candlestick that completely engulfs the previous candle.
Rising 3 - A bullish continuation pattern that consists of a long bullish candlestick followed by three smaller bearish candlesticks and then another long bullish candlestick.
3 White Soldiers - A bullish reversal pattern consisting of three consecutive long bullish candlesticks, each opening within the previous candle's body and closing higher.
Morning Star - A bullish reversal pattern made up of three candlesticks: a long bearish candlestick, followed by a short candlestick, and then a long bullish candlestick.
Bullish Harami - A bullish reversal pattern where a small bullish candlestick is completely within a previous larger bearish candlestick.
Tweezer Bottom - A bullish reversal pattern identified by an initial bullish candle, followed by a bearish candle, both having equal lows.
🔹 Bearish Patterns
Hanging Man - A bearish reversal pattern that forms after an uptrend, characterized by a small body at the upper end of the trading range and a long lower shadow.
Shooting Star - A bearish reversal pattern that forms after an uptrend, featuring a small body at the lower end of the trading range and a long upper shadow.
Bearish Engulfing - A bearish reversal pattern where a small bullish candlestick is followed by a larger bearish candlestick that completely engulfs the previous candle.
Falling 3 - A bearish continuation pattern that consists of a long bearish candlestick followed by three smaller bullish candlesticks and then another long bearish candlestick.
3 Black Crows - A bearish reversal pattern consisting of three consecutive long bearish candlesticks, each opening within the previous candle's body and closing lower.
Evening Star - A bearish reversal pattern made up of three candlesticks: a long bullish candlestick, followed by a short candlestick, and then a long bearish candlestick.
Bearish Harami - A bearish reversal pattern where a small bearish candlestick is completely within a previous larger bullish candlestick.
Tweezer Top - A bearish reversal pattern is identified by an initial bullish candle, followed by a bearish candle, both having equal highs."
🔶 SETTINGS
🔹 Patterns
Group including toggles for each of the supported candlestick patterns. Enabled toggles will allow detection of the associated candlestick pattern.
🔹 Reversal Detection
Trend Length: Determines the sensitivity of the reversal detection method to shorter-term variation, with higher values returning a detection method more sensitive to longer-term trends.
Threshold: Determines how easy it is for the reversal detection method to consider a trend at an extreme point.
Warmup Length: Warmup period in the reversal detection method, longer values will require a longer-term trend to detect potential reversals.
🔹 Style
Color Candles: Enable candle coloring on the user chart based on the reversal detection method.
Use Gradient: Use a gradient as candle coloring.
Label Size: Size of the labels displaying the detected candlesticks patterns.
🔹 Dashboard
Show Dashboard: Display the dashboard on the user chart when enabled.
Location: Dashboard location on the user chart.
Size: Size of the displayed dashboard.

Multi-Timeframe Momentum Indicator [Ox_kali]The Multi-Timeframe Momentum Indicator is a trend analysis tool designed to examine market momentum across various timeframes on a single chart. Utilizing the Relative Strength Index (RSI) to assess the market’s strength and direction, this indicator offers a multidimensional perspective on current trends, enriching technical analysis with a deeper understanding of price movements. Other oscillators, such as the MACD and StochRSI, will be integrated in future updates.
Regarding the operation with the RSI: when its value is below 50 for a given period, the trend is considered bearish. Conversely, a value above 50 indicates a bullish trend. The indicator goes beyond the isolated analysis of each period by calculating an average of the displayed trends, based on user preferences. This average, ranging from “Strong Down” to “Strong Up,” reflects the percentage of periods indicating a bullish or bearish trend, thus providing a precise overview of the overall market condition.
Key Features:
Multi-Timeframe Analysis : Allows RSI analysis across multiple timeframes, offering an overview of market dynamics.
Advanced Customization : Includes options to adjust the RSI period, the RSI trend threshold, and more.
Color and Transparency Options : Offers color styles for bullish and bearish trends, as well as adjustable transparency levels for personalized visualization.
Average Trend Display : Calculates and displays the average trend based on activated timeframes, providing a quick summary of the current market state.
Flexible Table Positioning : Allows users to choose the indicator’s display location on the chart for seamless integration.
List of Parameters:
RSI Period : Defines the RSI period for calculation.
RSI Up/Down Threshold: Threshold for determining bullish or bearish trends of the RSI.
Table Position: Location of the indicator’s display on the chart.
Color Style : Selection of the color style for the indicator.
Strong Down/Up Color (User) : Customization of colors for strong market movements.
Table TF Transparency : Adjustment of the transparency level for the timeframe table.
Show X Minute/Hour/Day/Week Trend : Activation of the RSI display for specific timeframes.
Show AVG : Option to display or not the calculated average trend.
the Multi-Timeframe Momentum Indicator , stands as a comprehensive tool for market trend analysis across various timeframes, leveraging the RSI for in-depth market insights. With the promise of future updates including the integration of additional oscillators like the MACD and StochRSI, this indicator is set to offer even more robust analysis capabilities.
Please note that the MTF-Momentum is not a guarantee of future market performance and should be used in conjunction with proper risk management. Always ensure that you have a thorough understanding of the indicator’s methodology and its limitations before making any investment decisions. Additionally, past performance is not indicative of future results.

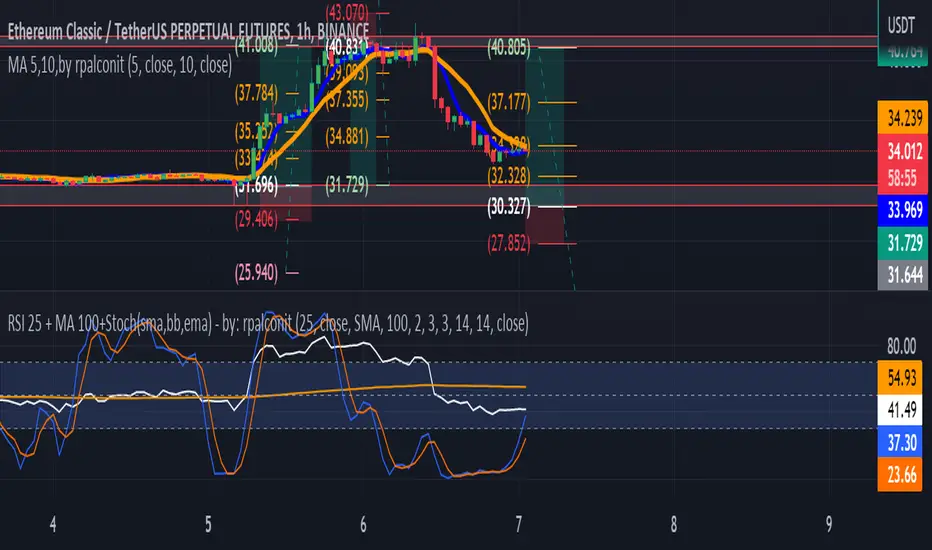
RSI 25 + MA 100+Stoch(sma,bb,ema) - by: rpalconitHello everyone,
This indicator uses RSI 25 + MA 100 + Stoch(sma,bb,ema to show buy and sell signals.
Signal Features:
• Buy Signal: It gives a buy signal when the RSI Length 25 bend upward below middle/lower bands and crosses MA 100 .
• Sell Signal: It gives a buy signal when the RSI Length 25 bend downward above middle/upper bands and crosses MA 100 .
• .
• Strong Buy Signal: It gives a strong buy signal when the RSI Length 25 bend upward below lower band and within overbought area of 30
• Storng Sell Signal: It gives a strong sell signal when the RSI Length 25 bend downward below lower band and within oversold area of 70.
You can change RSI length in any of your preference. And the Moving average you can select them from the list such as Simple Moving Average(SMA), Bollinger Bands( BB)and Exponential Moving Average (EMA.
In addition it includes momentum indicator like Stochastic RSI for more confirmation.
Details about the indicator
INPUTS
Time Frame
• Time Frames Chart: You can select your preferred timeframe at the dropdown list.
Relative Strength Index Settings
RSI Length: You can choose your preferred RSI length at the dropdown list.
RSI Source: You can choose your preferred RSI source at the dropdown list.
MA Setting:
1. MA Type: You can choose your preferred MA Type at the dropdown list.
2. MA Length: You can choose your preferred MA Length at the dropdown list.
3. stdDiv: You can choose your preferred the dropdown list.
Stochastic RSI gives you an idea about momentum if reach to the oversold and overbought areas.
Best regards,
ruelpalconit
[Sextan] MACD with Stoch RSI and Baseline with risk controlLevel 1
Background
An example to take 3 mintes to backtest "Full System MACD with Stoch RSI and Baseline with risk control" with sextan backtest framework
Function
Courtesy of @SoftKill21
Full System MACD with Stoch RSI and Baseline with risk control
This system can be used on all timeframes. It works on scalping, daytrading and swing trading.Its made from a Baseline slow and fast , together with MACD , Stochastic RSI .
Remarks
Courtesy of @SoftKill21
Feedbacks are appreciated.

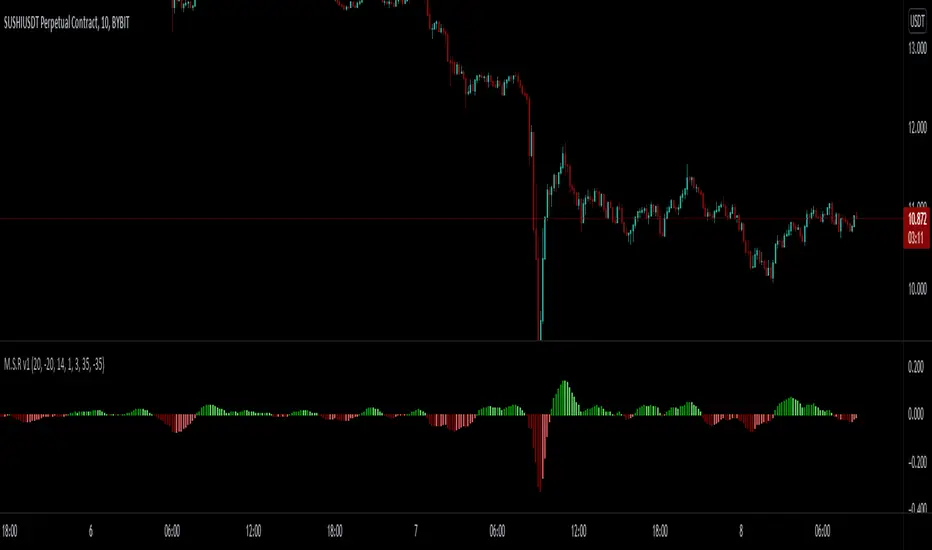
MACD - STOCH - RSI This indicator combines the
- MACD w/ Volume Conditions
- STOCHASTIC
- RSI
All into one place, to help find confluences between popular convergence / divergence indicators.
It's primary use is the histogram of the MACD.
The colors change whether or not the current bar is higher or lower than the previous.
Lighter shade signifies the bars are getting smaller.
You can also enable a feature which will change the color of the histogram depending on the volume.
There are 2 conditions which can be met which signify ' Increasing Volume ' and ' Above Average Volume '.
If the MACD is above 0,
Light Blue signifies increasing volume.
Dark Blue signifies above average volume
If the MACD is below 0,
Light Purple signifies increasing volume.
Dark Purple signifies above average volume.
Having volume conditions within the histogram are meant to act as confluence. For example, if the histogram is
rising and light blue or dark blue bars are shown, this could hint towards a larger move to the upside if previous
upswings on the histogram were only green.
Increased volume near the peak of a move can also signify lots of orders coming into the market in hopes
of reversing the current trend or starting a correction.
formula:
Avg of volume over past 10 bars * 1.5 = increasing volume
Avg of volume over past 10 bars * 2 = Above Average Volume
--
The RSI and STOCHASTIC have been run through a custom function which moves the values. The middle line is now 0.
Where on most RSI and STOCHASTIC indicators the middle line can be considered 50, with overbought levels nearing 70
and oversold levels around 30.
On the M.S.R , the RSI overbought levels are by default 20, and oversold -20.
I've done this because for myself it was easier to understand RSI was becoming oversold if it went below 0, not 50.
The same function also applies to the STOCHASTIC indicator.
The RSI and STOCHASTIC can also be displayed together to help see the conditions of both indicators at once.
--
[KBCUSTOM] Histogramified Stochastic RSI The public and regular stoch RSI does not come with a histogram which makes it hard to tell the magnitude of any cross. This version comes with one enabled by default and with includes buy and sell triggers on specified crosses.
Buy & Sell Options:
KB Cross Factor: this is the minimum stochastic change between candles that needs to be exceeded in order to trigger a buy or sell signal. For instance, if the previous candle has a value of -20, and the next one has 10, then the factor should be 30 in order for it to trigger a signal.
KB Cross Threshold: in order to minimize bad signals due to weak trend, you can set the minimum stochastic value any candle should have for an order signal to trigger. For instance, say the stochastic has a good cross factor (i.e. 30) and is met, and the stochastic has a value of 10 but your cross threshold is set at 20, then the signal will not trigger unless it is actually 20 or higher.
Let me know how it works.
Cheers.

RSI-MFI-STOCH + AverageSimple script that shows you the RSI, MFI and STOCH. Additionally it gives you the average of all 3.

FUERSTUses Normalized Price Oscillator and Stochastics and combines them as an ADX weighted measure.
During low trend intensity Stochastics gets higher weighted than Price Oscillator, and vice-versa in times of high trend-intensity.

The WWG Plan Indicator V2█ OVERALL
This indicator was specifically created for the Walsh Wealth Group.
In short it is a fusion of some of the most basic and widely used indicators to show overbought patterns and trend reversals.
Its best usage is with LTF scalping and agressive profit taking but can also be used to find HTF dips and buy-zones.
█ FEATURES
Buy Signal (Buy):
Printed only with all confirmations triggered
Small Buy Signal (B1 & B2)
Printed if some of the confirmations are triggered and can be treated as DCA entries or for further
confirmation with other indicators and basic TA.
Crayons (Color Bars):
Blue: RSI is oversold
Olive: RSI and Stoch RSI are oversold
Yellow: RSI, Stoch RSI are oversold and lower Bollinger Bands are crossed by Low
Orange: RSI, Stoch RSI and CCI are oversold
Trailing SL:
If activated in the config, a trailing SL can be displayed on the chart based on ATR.
█ SETTINGS
The underlying indicators used are RSI, Stoch RSI, Bollinger Bands, MACD and CCI.
All possible configs can be changed in the config settings.
█ GENERAL INFORMATION
Depending on the settings, the indicator performance will be highly affected.
This indicator is only displaying highly oversold areas and events of trend reversal it is not a *God*-Signal and will print false positives.
█ ALERTS
An alert for the main buy-signal is implemented and can be used via the TV alert functionality.

[blackcat] L2 Ehlers Super Smooth Stoch StrategyLevel: 2
Background
John F. Ehlers introuced Super Smooth Stochastic Indicator in Jan, 2014.
Function
In “Predictive And Successful Indicators” of in, 2014, John Ehlers presented another innovative way to eliminate noise from classic indicators and introduces some new smoothing indicators: the SuperSmoother filter, which is superior to moving averages for removing aliasing noise, and the MESA Stochastic oscillator, a stochastic successor that removes the effect of spectral dilation through the use of a roofing filter.
John Ehlers described a new method for smoothing market data while reducing the lag that most other smoothing techniques have. Ehlers had provided an approach for creating a strategy. For convenience, I made the same code available at tradingview pine v4 as well as an example strategy based on Ehlers’ description. Ehlers introduced a simple countertrend system that goes long when MESA Stochastic crosses below the oversold value and reverses the trade by taking a short position when the oscillator exceeds the overbought threshold.
Key Signal
MyStochastic --> Super Smooth Stochastic line
long ---> long entry signal
short ---> short entry signal
Pros and Cons
100% John F. Ehlers definition translation, even variable names are the same. This help readers who would like to use pine to read his book.
Remarks
The 81th script for Blackcat1402 John F. Ehlers Week publication.
Readme
In real life, I am a prolific inventor. I have successfully applied for more than 60 international and regional patents in the past 12 years. But in the past two years or so, I have tried to transfer my creativity to the development of trading strategies. Tradingview is the ideal platform for me. I am selecting and contributing some of the hundreds of scripts to publish in Tradingview community. Welcome everyone to interact with me to discuss these interesting pine scripts.
The scripts posted are categorized into 5 levels according to my efforts or manhours put into these works.
Level 1 : interesting script snippets or distinctive improvement from classic indicators or strategy. Level 1 scripts can usually appear in more complex indicators as a function module or element.
Level 2 : composite indicator/strategy. By selecting or combining several independent or dependent functions or sub indicators in proper way, the composite script exhibits a resonance phenomenon which can filter out noise or fake trading signal to enhance trading confidence level.
Level 3 : comprehensive indicator/strategy. They are simple trading systems based on my strategies. They are commonly containing several or all of entry signal, close signal, stop loss, take profit, re-entry, risk management, and position sizing techniques. Even some interesting fundamental and mass psychological aspects are incorporated.
Level 4 : script snippets or functions that do not disclose source code. Interesting element that can reveal market laws and work as raw material for indicators and strategies. If you find Level 1~2 scripts are helpful, Level 4 is a private version that took me far more efforts to develop.
Level 5 : indicator/strategy that do not disclose source code. private version of Level 3 script with my accumulated script processing skills or a large number of custom functions. I had a private function library built in past two years. Level 5 scripts use many of them to achieve private trading strategy.

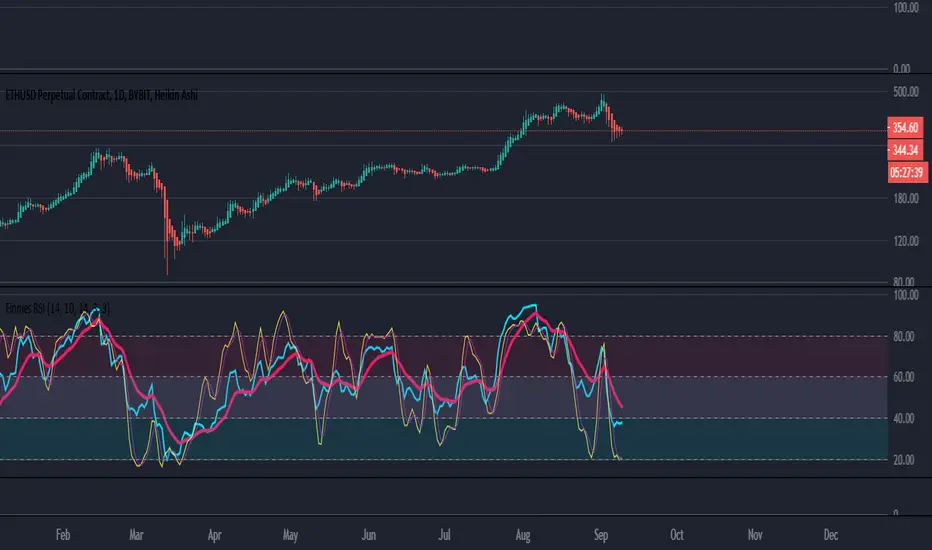
Finnie's RSI with EMA + MFI + Stoch V2RSI seams to be one of the most used indicators by far, and that comes because of merit . With that in mind, the goal of this indicator is to expand upon the tradition RSI or Relative Strength Index we all know and love :) I started by adding an EMA crossover. Which gives you, the users, a general idea of when to buy and sell outside of just watching a line go down and up. To take thinks even further, I decided to add options for both Fast and Slow Stochastic oscillators. Adding STOCH brings in another variable when deciding on an entry, technically its a bit hard to explain but in practice it would go something like this: you notice RSI is down around the level 20 mark and RSI is crossing up above it's EMA , which is BULLISH signal, and you're thinking about going long. As a second confirmation you can look at the STOCH rsi , if it's also crossing above the previously spoken EMA that's another BULLISH signal. This process can be repeated once RSI has risen to find an exit.
V2 changes:
-added MFI
-added overbought(yellow)/oversold(red) visual indicator
-removed K stoch in order to clean the indicator up visually, I haven't regretted it since :)

Finnie's RSI with EMA crossover + StochRSI seams to be one of the most used indicators by far, and that comes because of merit. With that in mind, the goal of this indicator is to expand upon the tradition RSI or Relative Strength Index we all know and love :) I started by adding an EMA crossover. Which gives you, the users, a general idea of when to buy and sell outside of just watching a line go down and up. To take thinks even further, I decided to add options for both Fast and Slow Stochastic oscillators. Adding STOCH brings in another variable when deciding on an entry, technically its a bit hard to explain but in practice it would go something like this: you notice RSI is down around the level 20 mark and RSI is crossing up above it's EMA, which is BULLISH signal, and you're thinking about going long. As a second confirmation you can look at the STOCH rsi, if it's also crossing above the previously spoken EMA that's another BULLISH signal. This process can be repeated once RSI has risen to find an exit.
EDIT: If you find the indicator is a bit too cluttered for you, feel free to disable the 'STOCH rsi' feature in settings :)
3 in 1 Indicators as used by JN (RSI, Stoch, DMI Stoch)This Indicator comprises the following individual indicators:
- RSI 4
- Stochastic 14,3,3
- DMI Stochastic 10,3
Analisis:
- By using this indicator alongside with the 4 in 1 JN Indicators (posted before this one), you can determine the change in trend when:
- When the bollinger bands are broken
- When an EMA is reached
- When all lines in the indicator are above or below the overbough/oversold lines
That means a change of Trend.