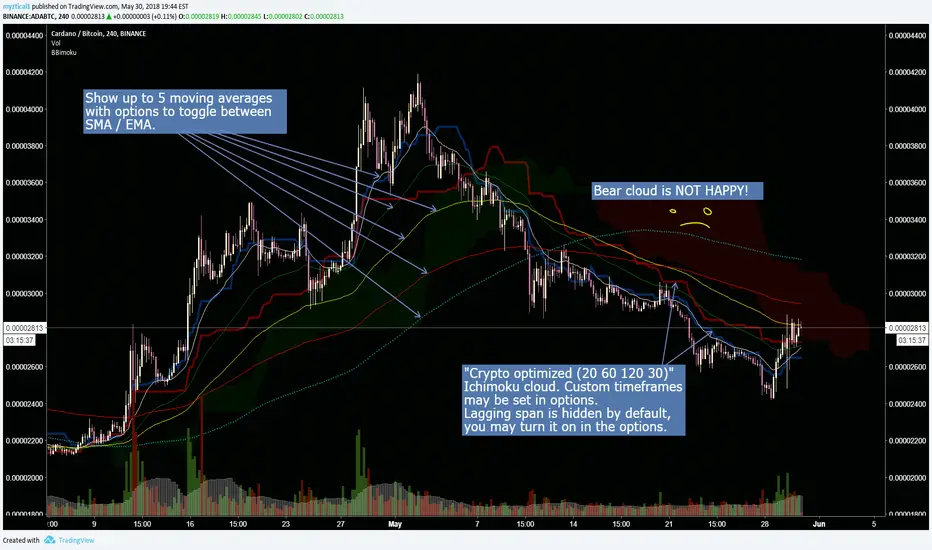
Crypto optimized Ichimoku and 5 variable SMA / EMAThis script has the option for showing up to 5 moving averages with options to toggle between SMA / EMA. Also includes crypto optimized Ichimoku cloud.
********This script was pieced together from various other's contributions from this site, and I cannot remember who the original authors are*******
Im just combining them to help others with free accounts and limited indicator availability like myself.
I hope this can help someone! Thank you and enjoy.
Cari skrip untuk "crypto"
Crypto optimized Ichimoku and 5 variable SMA / EMAThis script has the option for showing up to 5 moving averages with options to toggle between SMA / EMA. Also includes crypto optimized Ichimoku cloud.
********This script was pieced together from various other's contributions from this site, and I cannot remember who the original authors are*******
Im just combining them to help others with free accounts and limited indicator availability like myself.
I hope this can help someone! Thank you and enjoy.

Crypto Wave Rider Indicator - Bitcoin & Crypto SignalerAfter months of research and testing, I have developed the first public beta of my Crypto trading script.
Note the following:
1.) This algo works best with /USD pairings (e.g. ETH/USD). Doesn't work as well with /BTC pairings (e.g. ETH/BTC). I believe this is because USD is stable and allows for better data (rather than comparing two very volatile assets to each other).
2.) This algo works best on swing trading time frames (4 hour - 12 hour) but can also be used on lower time frames (although lower than 1 hr is not recommended). For reference, I've found the best time frames to be as follows: BTC - 6 hour, LTC - 4 hour, ETH - 12 hr
So far, the results have been far better than the other bots/indicators I've come across.
This indicator has been optimized for use on Bitcoin with 6 hour candles just because Bitcoin is the oldest crypto & has the most backtesting data available. And 6 hour time frame because I prefer swing trading over day trading.
Feel free to test on different time frames and coins to see what gets the best results.
Comments and feedback appreciated!!
************Note: Please do not ask me for the source code. It is protected for a reason....I won't be giving it out to anyone.*************

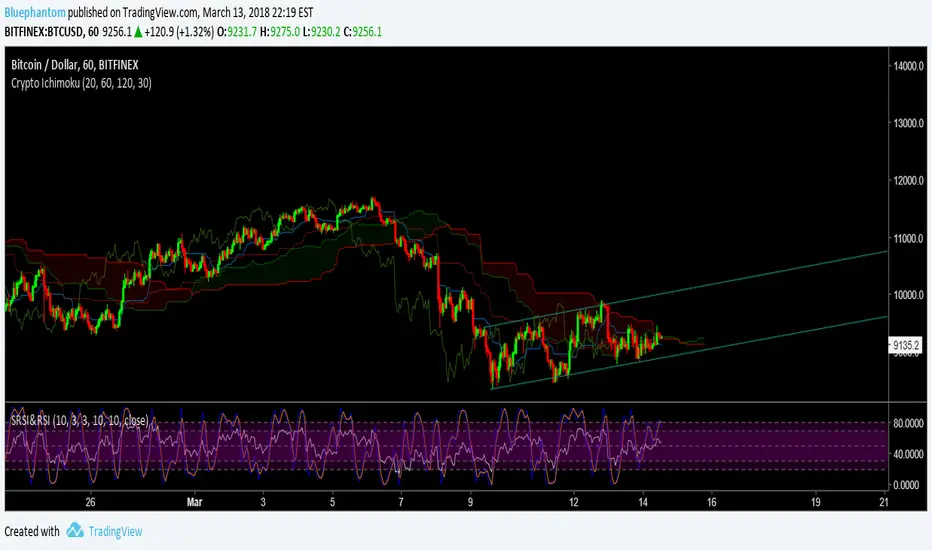
Crypto Ichimoku by BluephantomAs Cryptocurrencies are a 24/7 market I've created a cryptocurrency version of the Ichimoku.
I haven't made any major changes to how the ichimoku works.
Default settings are (20,60,120,30);
you can also try (10,30,60,30).
If you find my Scripts useful and would like to donate:
BTC:
3DVzwAggm2PuQ9y3ENxB8UWe5Sij7L55Nz
LTC:
MDTsyKDp9eshASbMvcwXFM2MRNBDEBbXiA
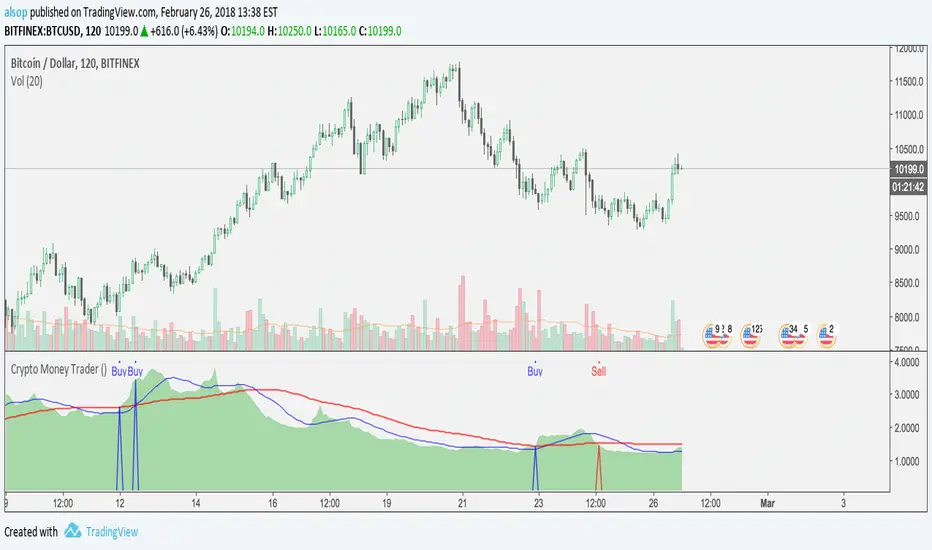
Crypto Money Trader - Indicator for Buy and Sell SignalsThis is it... the one that many have been waiting for.
We have taken everything we have learned from the Crypto Money Index and Crypto Money Bot and combined it into the best indicator possible for trading crypto currencies. This version also includes logic for shorts (sell) and another criteria for longs (buys).
The code is cleaner as well so there is less signal noise and more precise entries.
Before we released this script, we did backtesting on all the current supported USD pairs for optimal results.
Here is one set of results for BTC on 2 hour chats using $5,000 starting balance, 1 trade at once maximum, and 1 contract size:
www.cryptosignalsbot.com
Net Profit: $25,582, 511.64%
Total Trades: 17
Percent Profitable: 70.59%
Profit Factor: 4.304
Maximum Downdraw: $6,629
AvgTrade: $1,504.82, 30.1%
These results get even crazier when you get into settings where you can have 4 trades at once - beyond 700% return... crazy...
The indicator also includes alerts that you can setup so you are aware when a Buy or Sell signal is triggered. Just set an indicator alert for the Trigger Buy or Trigger Sell greater then a value of 0 and you will always know when it is time to look at the charts.
--== STRATEGY ==--
You can combine this indicator with other indicators in your strategy. Many of our most successful users of our previous scripts do just that as it helps them tune a perfect time for an entry.
Personally, we use the indicator and simple trendline entries. When a Buy or Sell triggers, draw a trendline and support / resistance lines and enter on a breakout. That's it.
Please note: this is not a "buy it or sell it now" kind of indicator. Sometimes it will signal a few hours early before a move.
--== SUPPORTED PAIRS ==--
We are always adding pairs, but as of February, 2018 this is our supported USD based pairs: BTC, ETH, LTC, XRP, NEO, BCH, IOT, EOS, BTG, ETC, ETP, OMG, EDO, ZEC, XMR, TRX, SAN, DSH, SNG
--== TELEGRAM CHANNEL ==--
All subscribers to this indicator will get access to our Exclusive Telegram Group where all the signals are analyzed and posted for you to see how we are playing the calls. You can either use this to learn how we use the indicator, or to trade from (at your own risk of course).
The alerts are all posted in this channel automatically and only the timeframes with the highest returns from extensive backtests are posted here automatically. However, we will sometimes post analysis on other timeframes as well.
--== BONUS ==--
As a subscriber, not only do you get this amazing indicator, but as a subscriber you will get access to our Crypto Money Index and the Crypto Money Bot
--== ACCESS ==--
Access is simple, go to our new website and register: Crypto Signals Bot
We will work to get you access to everything as quickly as possible. If you have any issues or questions, use the contact form on the website.
Crypto IchimokuIchimoku Cloud with settings recommended for crypto by trader IAmSatoshi. Includes a handy checkbox to double inputs, and alerts that can be set for when the price crosses the bottom or top of the cloud.
This script also includes an ichimoku signal count. The signal count is an UNWEIGHTED sum of positive or negative ichimoku signals with the greatest total being shown in either green(long>short) or red(short>long) or white(0, long==short). The signal count is only shown when their is a new signal or a signal is no longer valid.
If you use a major portion of the code please cite me. If you like the script and make a bunch of money using it, feel free to donate using the crypto addresses below.
BTC: 34uVepgjGJAKqf9i3mfdq8AG1dzTthjCgb
ETH: 0x71B15Beb6AF985853B5fC80205ddb3595C51B63e
LTC: MVzvSu53K5qPfjiQn4nk9D6WVLJKCMzXHJ
DASH: XoKVDBnhiyPvJeyRdpHjcWu1WtVjCbhP68
XMR: 46jnYGp7v5vCSAV8pzGXPbWM7YFiZNB4eaFCHsezitQ46KM1E6FgPM9ZaYJEfDVk5zdKoPQ7vw27ke34jMxERogvJDQhfQW

Crypto-Adjusted Parabolic Stop and Reverse (CAPSAR)Finally, a more accurate PSAR is here!
This PSAR will show up , and stick around when a majority of the Crypto-Currencies in the index below conform in the same direction.
The CAPSAR can be applied to any Crypto-currency and ANY time-frame!
This Crypto-Index makes up over 90% of the Crypto-Currency market cap (total global Crypto investment).
Bitcoin
Ethereum
Bitcoin Cash
Ripple
Litecoin
Nemcoin
Thick Blue lines beneath the price indicate a change in direction, and momentum up.
Thick Red lines above the price indicate a change in direction, and momentum down.
This indicators holds three editable parameters:
1. "Start" - The starting value for the Acceleration Factor (.02 is the Default).
2. "Increment" = The increment in which the Acceleration Factor will move (.02 is Default).
3. "Max" - The maximum value of the Acceleration Factor (.20 is the Default)

Crypto-Adjusted Exponential Moving Average (CAEMA)This exponential moving average (EMA) can be applied to any Crypto-currency and ANY time-frame!
Request use in the comments :)
This EMA is adjusted to give weight to the performance of the 6 largest Cryptocurrencies by market-cap.
This is the Crypto-Index that affects the EMA.
Bitcoin
Ethereum
Bitcoin Cash
Ripple
Litecoin
Nem Coin.
The use of this indicator is to observe divergence between the price of the underlying asset that is the basis of your chart, and the rest of the Crypto-currency market.
If more Crypto-currencies go down while your observed currency goes up, the CAEMA will sit lower and a blue pool will become visible showing that that the chart is performing better than the Crypto-Weighted Index listed above. If more Crypto-currencies go up while your observed currency goes down, the CAEMA will sit higher and a red cloud will form, showing that the chart is performing worse than the Crypto-weighted Index.
The indicator uses two variables that can be changed:
" EMA_Length " = This is the length of the exponential moving average and is set to 50 by default.
" CryptoFactor " = This is the weighting given to the movement of the Crypto-Index. Essentially, this is the factor as to how much the movement of the Crypto-Index effects the weight of the EMA. If you set this at 0, the line will be an exponential moving average of the set length without any affect of the Crypto-Index.
By default, the CryptoFactor is set to 0.8 .

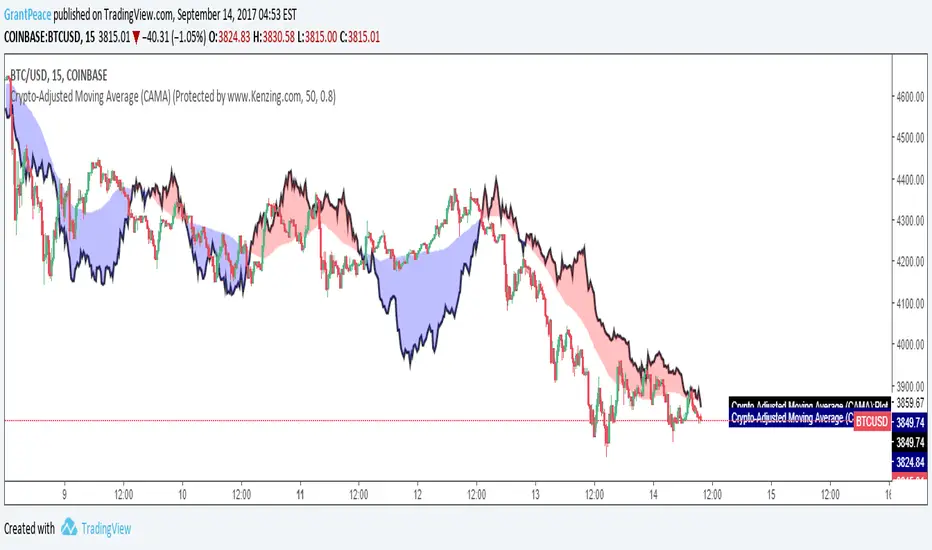
Crypto-Adjusted Moving Average (CAMA)UPDATED! This moving average can now be applied to any Crypto-currency and ANY time-frame!
Request use in the comments :)
This moving average is adjusted to give weight to the performance of the 6 largest Cryptocurrencies by market-cap.
This is the Crypto-Index that affects the moving average.
Bitcoin
Ethereum
Bitcoin Cash
Ripple
Litecoin
Nem Coin.
The use of this indicator is to observe divergence between the price of the underlying asset that is the basis of your chart, and the rest of the Crypto-currency market.
If more Crypto-currencies go down while your observed currency goes up, the CAMA will sit lower and a blue pool will become visible showing that that the chart is performing better than the Crypto-Weighted Index listed above. If more Crypto-currencies go up while your observed currency goes down, the CAMA will sit higher and a red cloud will form, showing that the chart is performing worse than the Crypto-weighted Index.
The indicator uses two variables that can be changed:
"MA_Length" = This is the length of the moving average and is set to 50 by default.
"CryptoFactor" = This is the weighting given to the movement of the Crypto-Index. Essentially, this is the factor as to how much the movement of the Crypto-Index effects the weight of the moving average. If you set this at 0 , the line will be a simple moving average of the set length without any affect of the Crypto-Index.
By default, the CryptoFactor is set to 0.8 .
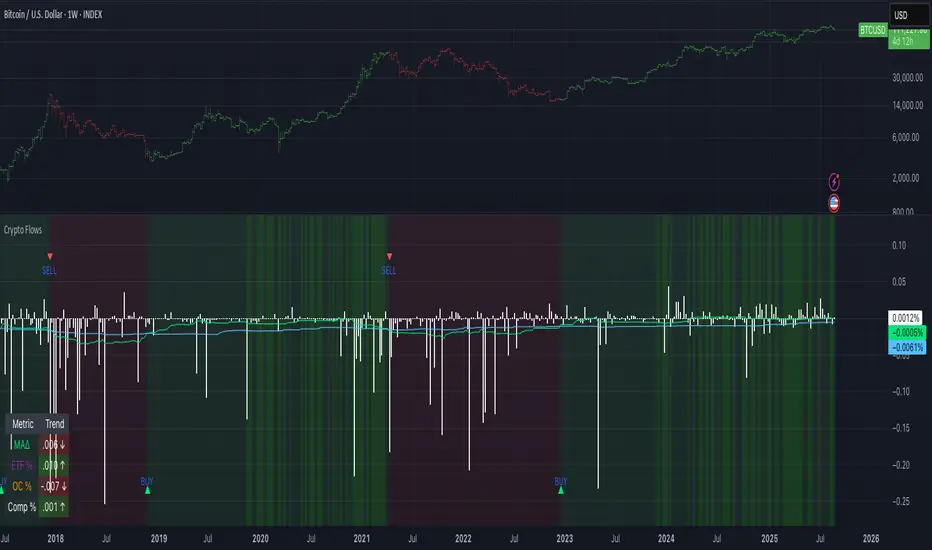
Crypto Flows [ETF|On-chain]The surge in Bitcoin and Ethereum spot ETFs has transformed how crypto is held and traded. By mid‑2025, U.S. spot Bitcoin ETFs already controlled roughly 1.28 million BTC, or about 6.5 percent of the circulating supply (Fosque, 2025). This accumulation has coincided with sharp price rallies and signals that regulated vehicles are absorbing a meaningful share of supply (Fosque, 2025; Wright, 2025). At the same time, on‑chain analytics show that exchange flows still influence markets: large inflows to exchanges often precede sell‑offs, whereas withdrawals to private wallets signal accumulation and reduced sell pressure (Singh, 2024; CryptoQuant, 2024). IntoTheBlock’s large‑holder inflow indicator even notes that spikes in whale buying frequently mark major bottoms (IntoTheBlock, 2022). I wanted to weave these pieces together, so I created this indicator.
Essence and logic
The script draws from two data streams: net flows into ETFs and net on‑chain flows from large holders, both scaled by the asset’s circulating market cap. ETF flows are aggregated across the ten largest INDEX:BTCUSD Bitcoin ETFs, the ten largest Ethereum INDEX:ETHUSD ETFs and the first CRYPTOCAP:SOL Solana ETF; each fund has its own checkbox and colour selection. On‑chain data uses IntoTheBlock’s large‑holder inflows and outflows, with dozens of coins available( CRYPTO:XRPUSD CRYPTOCAP:AVAX CRYPTOCAP:ADA CRYPTOCAP:LINK CRYPTO:DOGEUSD CRYPTOCAP:OTHERS ; if your coin isn’t shown in the dropdown you can manually enter its symbol. For each component, daily flows are converted into either a Z‑score or, by default, a percent‑of‑market‑cap series; users choose the weighting between ETF and on‑chain signals. These weighted series are summed into a composite, smoothed, and then two moving averages (a fast and a slow one) are applied to define bullish or bearish regimes. Because ETFs are a recent phenomenon, the early part of the composite is dominated by on‑chain flows; as ETF history lengthens, the fund‑flow component will become more influential. Trade signals are generated via moving‑average crossovers and optional dip triggers, and a trend table summarises current values and directions.
Why these components?
ETF flows reflect institutional adoption and supply absorption. Funds such as IBIT already hold about 744 000 BTC (roughly 3.3 percent of total supply), and cumulative ETF holdings have been growing faster than new coins are mined (Wright, 2025). Net inflows into these vehicles have tended to accompany rising prices and signal long‑horizon capital (Fosque, 2025). On‑chain flows, meanwhile, capture exchange liquidity dynamics. High inflows to exchanges often indicate that investors are preparing to sell, increasing tradable supply (Singh, 2024; CryptoQuant, 2024). Outflows into self‑custody suggest accumulation and reduced sell pressure, providing a bullish signal (Singh, 2024; CryptoQuant, 2024). IntoTheBlock points out that spikes in large‑holder inflows—whales moving coins into cold storage—have historically preceded price bottoms (IntoTheBlock, 2022). By weighting and standardising these flows relative to market cap, the composite aims to offer a more objective lens on risk‑on versus risk‑off regimes than price alone.
Limitations and outlook
ETFs a pretty new, so the data history is short. The list of tracked funds is currently limited to U.S. and European products; adding Asian or Canadian vehicles could provide a fuller picture. On‑chain flows can be noisy and occasionally give conflicting signals, and large‑holder data is not available for every crypto asset. The ETF and on‑chain components are also correlated through market cap, so equal weighting may amplify common trends. As macro conditions evolve and ETF redemption mechanisms change, the usefulness of fund flows could vary. I see this indicator as one tool among many, and I’m considering adding stablecoin flows, derivatives funding rates, or halving‑cycle adjustments. Suggestions are welcome.
Personal note
I’m a student who enjoys exploring the intersection of macro flows, on‑chain analytics and market psychology. This script is free to use. You can enable or disable each component, adjust weights, change the display mode and lookback, and select individual ETF tickers. If it brings you value, feel free to follow my work or reach out with feedback. I appreciate your support. Please remember that this indicator is for educational purposes and not investment advice. I built this indicator in addition to my Liquidity indicator, where I use Global M2, the yield curve, and the high-yield spread to define risk-on/risk-off regimes. If you are interested, you can find it here:
References
CryptoQuant Team. (2024). Exchange in/outflow and netflow user guide.
Fosque, J. (2025). Bitcoin ETFs pull $17.8 billion in 90 days as price surges past $118 K. The Digital Chamber.
IntoTheBlock. (2022). Large holders inflow indicator description.
Singh, O. (2024). Crypto exchange inflows and outflows explained: What they reveal about market trends. CCN.
Wright, L. (2025). Bitcoin ETFs to lock up 1.5 million BTC by New Year as supply squeeze tightens grip. CryptoSlate.
Crypto McClellan Oscillator (SLN Fix)This is an adaption of the Mcclellan Oscillator for crypto. Instead of tracking the S&P500 it tracks a selection of cryptos to make sure the indicator follows this sector instead.
Full credit goes to the creator of this indicator: Fadior. It has since been fixed by SLN.
The following description explains the standard McClellan Oscillator. Full credit to Investopedia , my fav source of financial explanations.
The same principles applies to its use in the crypto sector, but please be cautious of the last point, the limitations. Since crypto is more volatile, that could amplify choppy behavior.
This is not financial advice, please be extremely cautious. This indicator is only suitable as a confirmation signal and needs support of other signals to be profitable.
This indicator usually produces the best signals on slightly above daily time frame. I personally like 2 or 3 day, but you have to find the settings suitable for your trading style.
What Is the McClellan Oscillator?
The McClellan Oscillator is a market breadth indicator that is based on the difference between the number of advancing and declining issues on a stock exchange, such as the New York Stock Exchange (NYSE) or NASDAQ.
The indicator is used to show strong shifts in sentiment in the indexes, called breadth thrusts. It also helps in analyzing the strength of an index trend via divergence or confirmation.
The McClellan Oscillator formula can be applied to any stock exchange or group of stocks.
A reading above zero helps confirm a rise in the index, while readings below zero confirm a decline in the index.
When the index is rising but the oscillator is falling, that warns that the index could start declining too. When the index is falling and the oscillator is rising, that indicates the index could start rising soon. This is called divergence.
A significant change, such as moving 100 points or more, from a negative reading to a positive reading is called a breadth thrust. It may indicate a strong reversal from downtrend to uptrend is underway on the stock exchange.
How to Calculate the McClellan Oscillator
To get the calculation started, track Advances - Declines on a stock exchange for 19 and 39 days. Calculate a simple average for these, not exponential moving average (EMA).
Use these simple values as the Prior Day EMA values in the 19- and 39-day EMA formulas.
Calculate the 19- and 39-day EMAs.
Calculate the McClellan Oscillator value.
Now that the value has been calculated, on the next calculation use this value for the Prior Day EMA. Start calculating EMAs for the formula instead of simple averages.
If using the adjusted formula, the steps are the same, except use ANA instead of using Advances - Declines.
What Does the McClellan Oscillator Tell You?
The McClellan Oscillator is an indicator based on market breadth which technical analysts can use in conjunction with other technical tools to determine the overall state of the stock market and assess the strength of its current trend.
Since the indicator is based on all the stocks in an exchange, it is compared to the price movements of indexes that reflect that exchange, or compared to major indexes such as the S&P 500.
Positive and negative values indicate whether more stocks, on average, are advancing or declining. The indicator is positive when the 19-day EMA is above the 39-day EMA, and negative when the 19-day EMA is below the 39-day EMA.
A positive and rising indicator suggests that stocks on the exchange are being accumulated. A negative and falling indicator signals that stocks are being sold. Typically such action confirms the current trend in the index.
Crossovers from positive to negative, or vice versa, may signal the trend has changed in the index or exchange being tracked. When the indicator makes a large move, typically of 100 points or more, from negative to positive territory, that is called a breadth thrust.
It means a large number of stocks moved up after a bearish move. Since the stock market tends to rise over time, this a positive signal and may indicate that a bottom in the index is in and prices are heading higher overall.
When index prices and the indicator are moving in different directions, then the current index trend may lack strength. Bullish divergence occurs when the oscillator is rising while the index is falling. This indicates the index could head higher soon since more stocks are starting to advance.
Bearish divergence is when the index is rising and the indicator is falling. This means fewer stocks are keeping the advance going and prices may start to head lower.
Limitations of Using the McClellan Oscillator
The indicator tends to produce lots of signals. Breadth thrusts, divergence, and crossovers all occur with some frequency, but not all these signals will result in the price/index moving in the expected direction.
The indicator is prone to producing false signals and therefore should be used in conjunction with price action analysis and other technical indicators.
The indicator can also be quite choppy, moving between positive and negative territory rapidly. Such action indicates a choppy market, but this isn't evident until the indicator has made this whipsaw move a few times.
Good luck and a big thanks to Fadior!

Crypto & Forex Intraday LevelsThis indicator automatically Plots the Intraday Bullish and Bearish Levels for Major Crypto and Forex Counters. Preferred time frames are 15/30/60 Minutes
Calculation
Compute the Last 5 days O H L C then calculate H-O and H-L, take average of the difference of H-O and H-L then Minimum Value then the average difference is added with the day opening to get the bullish zone and the average is subtracted from the opening price to get the bearish zone
Trade Ideas
Long Trade Example 1
Buy Above the Bullish Zone
Long Trade Example 2
Buy While taking support from Bearish Zone
Short Trade Example 1
Sell Below the Bearish Zone
Short Trade Example 2
Sell While taking rejection from Bullish Zone
Set Automatic Alerts
You can add alerts to this indicator, so that when the price breaches the Bullish zone or the Bearish Zone it will be notified automatically.

Crypto Manipulation [ProjeAdam]OVERVIEW
Indicator that detects manipulation candles on the Binance exchange according to open interest, volume, candlestick analyzes and percent changes.
IMPORTANT NOTE: This indicator works in Crypto Binance Exchange and only in Future Parities.
Example ->> BTCUSDT.P -- ETHUSDT.P -- ADAUSDT.P
> Topics in the writing of the crypto manipulation indicator <
Market makers manipulate the crypto market because most people who trade on the stock exchange act with their emotions and are forced to close the transaction at a loss. In these manipulations, many people are liquidated and the money they earn is used as fuel in the market.
We can reduce the psychological impact that the market is trying to have on us with this indicator.
IF we detect manipulation candles in the market, we can control our fragile psychology and close our transactions in profit by trading with market-making formations in these areas.
ALGORITHM
In this indicator, I use 4 different datasets to detect manipulation candles in crypto market.
1- Extremely variable volume data in Spot and Future markets
2- Wicks formed by candles
3-Percentage change of price movement
4-Distance from the average value of people who open and close transactions in Future parity
When there is excessive volatility in price movement, the algorithm in this indicator notices this price volatility and calculates a manipulation value by dividing it by the volatility value in past price movements.
In my Python backtests, I noticed that when manipulation is done in the crypto market, there is extreme volatility in certain values. This is because there are more robots in the crypto exchange than in the Bist exchange and the total transaction volume is less than in other exchanges. We observe these data that change in a short time, the amount of volume created by people being liquidated, and the open positions that are forcibly closed due to this situation, only in Cryptocurrency exchanges.
How does the indicator work?
The manipulation candle does not give us information about the direction of price movement, it is only used as an auxiliary indicator. With the help of this indicator, we can prevent large losses by better determining our risk situation during and after manipulation.
We show our manipulation values as columns. We draw a channel over the values we show and we understand that there is manipulation in the candle of our values above this channel.
The indicator shows the manipulation value in the form of columns. Our manipulation value that goes outside the channel we have determined is colored red, within the channel it is colored yellow, and below the channel it is colored green. Red columns indicate candles that are manipulations.
As we observed in the example above, we observe excessive volume increase, momentum in open interest and wick candles during manipulation times. As these values increase, our manipulation value also increases.
What are the BIST and Crypto Exchanges and What are the differences between them?
The differences between the general structure of BIST Exchange and the general structure of the cryptocurrency exchange are as follows;
1- While trading takes place under goverment control in BIST Exchange, there are no regulations in the Cryptocurrency market yet.
2- Since BIST Exchange is a much larger market than the cryptocurrency exchange, manipulations can be made by very large money owners and large companies, but there is a monopolized situation in crypto.
3- We see instantaneous large changes in volume in the cryptocurrency market during manipulation times. While this situation is not seen effectively in the BIST exchange, volume changes have a great impact on the crypto exchange.
4- Since there are many open source codes in the cryptocurrency exchange and much easier and faster trading is allowed thanks to the robots produced by software, manipulations in the cryptocurrency exchange occur very quickly and in a short time.
5- We can know who opened and closed transactions in which candle in the cryptocurrency market, but we cannot access this data in Borsa Istanbul.
The majority of Borsa Istanbul users do not trade in crypto, and many users who trade in crypto do not know Borsa Istanbul because only TURKISH citizens can open transactions here.
Using two completely different algorithms and publishing two different indicators will be convenient for many users at this stage. The indicators to be used for these two exchanges, which have many different features that I have explained above, should also be different.
So What are the differences between the two algorithms?
1-Crypto manipulation indicator uses liquidation data, we cannot access this data on the Bist exchange.
2-While manipulations in the crypto exchange occur in very short periods of time, BIST generally moves slower than crypto.
3-By using the crypto manipulation indicator open interest data, we can access in detail on which candle the transaction was opened and closed, but we cannot access it on the Bist exchange.
In our example above, when manipulation candles are formed, you see the volumetric change and the change in open interest. The excessive increase in volume and the momentum of open interest data affects our crypto manipulation value.
The greater the volume increase, the greater the manipulation.
Regardless of the open interest direction, the greater the momentum change in value, the more manipulation has been done.
Our BIST manipulation indicator only focuses on the change of candles in the market structure. In other words, it cares about percentage changes and the change within the average. I tried to show in the example above that volume data is not a consistent variable in the BIST stock market when calculating manipulation.
The user types of the two different indicators vary greatly, and both indicators benefit the community by making calculations according to the metrics of their own exchanges. For the reasons I explained above, I thought it would be better to write two indicators for tradingview users that work with different algorithms on two different exchanges.
Example
In our example above, we see a manipulation candle clearing the stops formed, the market maker clearing the orders at the people's stop levels at the bottom to move the price up.
We can quickly control manipulation candles in 5 different parities at the same time by entering our parities in the settings panel.
In our example above, we observe a beautiful manipulation candle. As you can see, if there is an extreme increase in volume, a momentum movement in the open line and a candle with a wick, we should look for manipulation here.
SETTINGS PANEL
We have only two setting in this indicator.
Our multiplier value determines the width of the band value formed above our manipulation value. In the chart above, our multiplier value is 3.2. If we reduce our multiplier value, our manipulation sensitivity will decrease as there will be much more candles on the band.
If you have any ideas what to add to my work to add more sources or make calculations cooler, suggest in DM .

Crypto Daily WatchList And Screener [M]
Hi, this is a watchlist and screener indicator designed for traders in the field of cryptocurrencies who want to monitor developments in other currency pairs and indices.
The indicator consists of two tables. One of them is the table containing indices such as BTC dominance, total, total2, which allows you to track market developments and changes. In this table, you will find price information, daily change, stochastic, and trend information.
The other table includes cryptocurrencies like BTC/USDT, ETH/USDT, DOT/USDT, and more. In this table, you will see real-time prices, daily volume, daily change, stochastic, the correlation coefficient between the pair and Bitcoin, and the trend value calculated based on MACD.
The "Customize" section in the settings enables you to personalize the appearance of the tables according to your preferences.

Crypto/DXY ScoringHi!
This indicator "Crypto/DXY Scoring", a multi-purpose script, consists of various comparison statistics (including an alternative RS/RSMOM model) to show the strength of a currency against the DXY.
Features
"Contrived" RS/RSMOM alternative model
Compare the strength of the crypto currency on your chart to any asset (DXY default)
Glass's ∆
Z-comparison
Hedges' g
Cliff's Delta
Z-score for log returns
RRG graph (with adjusted dimensions) Traditional RRG graph coming soon (:
Let's go over some simplified interpretations of what's shown on the chart!
The image above provides generalized interpretations for the three of the data series plotted by the indicator.
The image above further explains the other plots for the indicator!
The image above shows the final result!
Underlying Theory
"When the dollar is strong as indicated by the DXY, it usually means that investors are seeking safety in traditional assets. Bitcoin (crypto) is often considered a "risk-on" asset, meaning investors might sell BTC in favor of holding dollars, thus driving BTC prices down."
Given the complexities associated with this relationship, including its contentious implications and a variable correlation between crypto and the DXY, this theory is one within a plethora.
That said, regardless of accuracy, this indicator adheres to the theory outlined above (:
The image above shows the purpose of the red/lime columns and the corresponding red/green lines.
Should the crypto on your chart and the DXY (or comparison symbol) exhibit negative correlation, and should the performance of DXY (or comparison symbol) hold any predictive utility for the subsequent performance of the crypto on your chart, the red columns violating the red line might indicate an upcoming "dump" for the crypto on your chart.
Lime green columns violating the green line may indicator an inverse response.
Alternative Relative Rotation Graph
In its current state, the alternated dimensions for the Relative Rotation Graph cause it to function more as a "Relative Performance Graph".
Fear not; a traditional RRG graph is coming soon!
The image above shows our alternative RRG!
Interpretation
With this model, you can quickly/intuitively assess the relative performance of the display cryptos against an index of their performance.
The image above shows generalized interpretations of the model!
That's it for this indicator! Thank you for checking it out; more to come (:

CRYPTO DIVERGENCE FINDERThis indicator allows you to easily compare any ticker you're looking at with the ones I've found to work best over many years of studying the crypto market. For these reasons, the code of the script is hidden because that is exactly what makes it unique.
You can choose any cryptocurrency, but I recommend using only perpetuals on 'BINANCE' exchange.
If the comparison mode is enabled, the current ticker you are viewing is divided by the ticker selected in the indicator.
For example, if you are watching "SOLUSDT.P" you should open the settings of the indicator and write "SOLUSDT.P" in the ticker field. Then you will get the SOLUSDT.P correlation index with other crypto and currency pairs that are correlated (like I already said this is something that is product of many years of studying this market and this is exactly what is unique about the code so the source of the script have to stay protected).
If you are a beginer, you can just apply simple trend-breakout strategy after you spot the divergence.
For advanced traders, you can use this together with ICT's and SMC concepts as a confirmation upon your entry.

Crypto Trend IndicatorThe Crypto Trend Indicator is a trend-following indicator specifically designed to identify bullish and bearish trends in the price of Bitcoin, and other cryptocurrencies. This indicator doesn't provide explicit instructions on when to buy or sell, but rather offers an understanding of whether the trend is bullish or bearish. It's important to note that this indicator is only useful for trend trading.
The band is a visual representation of the 30-day and 60-day Exponential Moving Average (EMA). When the 30-day EMA is above the 60-day EMA, the trend is bullish and the band is green. When the 30-day EMA is below the 60-day EMA, the trend is bearish and the band is red. When the 30-day EMA starts to converge with the 60-day EMA, the trend is neutral and the band is grey.
The line is a visual representation of the 20-week Simple Moving Average (SMA) in the daily timeframe. "Bull" and "Bear" signals are generated when the 20-day EMA is either above or below the 20-week SMA, in conjunction with a bullish or bearish trend. When the band is green and the 20-day EMA is above the 20-week SMA, a “Bull” signal emerges. When the band is red and the 20-day EMA is below the 20-week SMA, a “Bear” signal emerges. The 20-week SMA can potentially also function as a leading indicator, as substantial price deviations from the SMA typically indicate an overextended market.
While this indicator has traditionally identified bullish and bearish trends in various cryptocurrency assets, past performance does not guarantee future results. Therefore, it is advisable to supplement this indicator with other technical tools. For instance, range-bound indicators can greatly improve the decision-making process when planning for entries and exits points.

Cryptos Relative Strength Oscillator
This is an oscillator made of biggest 40 cryptocurrency/USDT pairs.
* It shows relative strength and change of crypto market during certain time on given interval.
* The tool has a bunch of data put together into one oscillator:
* top and bottom lines are made of 3 strongest and 3 weakest crypto pairs (out of 40)
* has visible names of that pairs for several candles back (it cannot show more due to TV's Pine limitations)
* in settings you can set up 2 methods of calculations:
1) % change from SMA of price, default is SMA 5
2) % changes from x-candles back, to see that change from the last candle please turn of 'Moving Average' and set up 'Bars Back' to 1
* you can change source to close/hl2/ohlc2/etc
Notice 1:
- to have nicer visibility of whole oscillator make it bigger part of whole screen then you normally use for other oscillators
Notice 2:
- scroll your mouse to widen the horizontal axis, so names of certain crypto pairs will be more readable
Notice 3:
- script has 40 Pine security functions (to gather all the data from all pairs) so it can load up to several seconds
- also every change in settings will possibly result in longer loading time
ps. This script is invite-only for the members of our trading group (info in signature, group is free of charge).


Crypto Auto Trading Bot by MudraMinerOverview
The Crypto Auto Trading Bot is a powerful TradingView indicator tailored for cryptocurrency day trading. It combines Heikin Ashi candles, Exponential Moving Averages (EMAs), volume analysis, and an optional Supertrend filter to generate reliable buy, sell, and exit signals. This indicator is designed to help traders identify high-probability entry and exit points in volatile crypto markets while minimizing false signals through trend and volume confirmation.
Key Features
Heikin Ashi Smoothing : Utilizes Heikin Ashi close prices on a 15-minute timeframe to smooth price action and enhance trend identification.
Dual EMA System: Employs a fast moving and slow moving EMA to confirm short-term momentum and long-term trends.
Volume Filter : Ensures signals occur during higher-than-average volume to avoid low-liquidity traps.
Supertrend Confluence : Optional toggle to require Supertrend confirmation for stronger buy/sell signals.
Position Management : Prevents multiple entries without exits, ensuring disciplined trading.
Visuals & Alerts : Clear "BUY," "SELL," and exit ("E") labels with customizable alerts for seamless TradingView integration.
How to Use
Apply the Indicator: Add the "Crypto Auto Trading Bot" to your TradingView chart (e.g., SOL/USDT or other crypto pairs).
Supertrend Filter : Toggle on/off via the "Use Supertrend Filter" input to require Supertrend confirmation.
Interpret Signals:
BUY (Green label below bar): Signals a potential long entry.
SELL (Red label above bar): Signals a potential short entry.
Exit Long/Short (Green/Red "E"): Indicates when to close existing positions.
Trading Application : Use signals for manual trading, backtesting with TradingView’s strategy tester, or set up alerts for automated trading.
Chart Compatibility : Works on any chart timeframe, with MAs and Heikin Ashi calculated on a fixed 15-minute timeframe for consistency. Suitable more for the day traders.
Trading Logic
The indicator uses a combination of trend detection, momentum, volume, and optional Supertrend confirmation to generate signals. Below is the trading logic for taking and exiting positions:
Trend Detection:
Uptrend: When the Heikin Ashi close price is above the slow moving EMA, indicating bullish market conditions.
Downtrend: When the Heikin Ashi close price is below the slow moving EMA, indicating bearish market conditions.
Position Management ;
The indicator uses a one-time gating mechanism to track whether you are in a long or short position.
Only one position (long or short) can be active at a time, preventing multiple entries without an exit.
A new buy signal closes any existing short position and opens a long position, and vice versa for sell signals.
Notes for Traders
Customization: The only user-adjustable settings are the timeframe (default: 15 minutes) and the Supertrend filter toggle. Other parameters are fixed for simplicity but can be modified in the code if needed.
Market Suitability: Optimized for cryptocurrency markets (e.g., BTC/USDT, ETH/USDT) but can be tested on other volatile assets.
Risk Management: Always use proper position sizing, stop-losses, and risk-reward ratios. Backtest the indicator thoroughly to understand its performance in different market conditions.
Performance: The indicator combines trend, momentum, and volume filters to generate high-probability signals, with the optional Supertrend adding further confirmation. However, no indicator guarantees profits—combine with your own market analysis.
Disclaimer
This indicator is provided for educational and informational purposes only. Trading cryptocurrencies carries significant risk, and past performance does not guarantee future results. Always conduct thorough testing and consult with a financial advisor before trading.

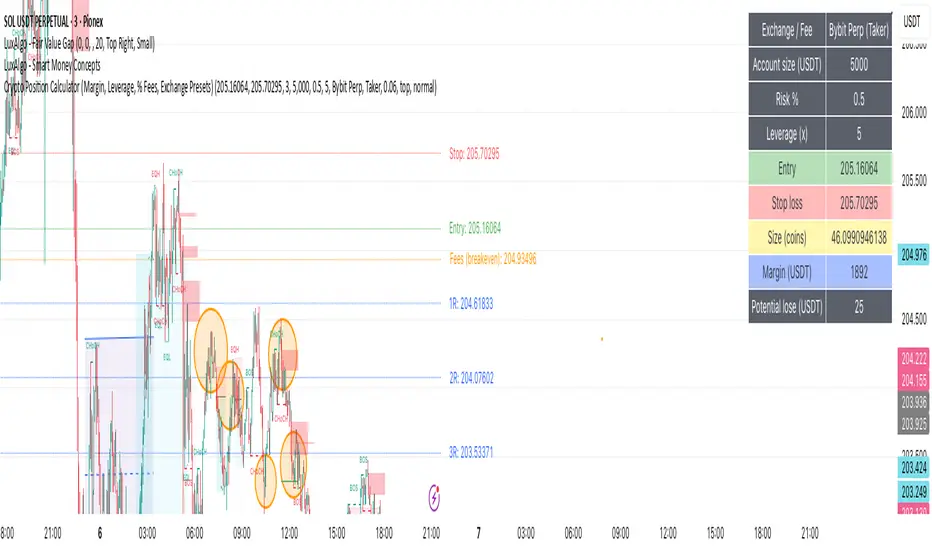
Crypto Position CalculatorAlpha2Million - Crypto Position Calculator (Margin, Leverage, % Fees, Exchange Presets)
This script is a crypto trading risk & position calculator built directly into TradingView.
It helps futures/perpetual traders size positions, calculate margin requirements, and visualize risk-to-reward levels on the chart — with exchange fee presets for real-world accuracy.
• Position Sizing by Risk %
• Enter account size and % risk per trade.
• Script calculates exact position size (coins) based on SL distance.
• Leverage & Margin
• Shows required notional and margin (USDT) for the trade.
• Exchange Fee Presets
• Supports Binance, Bybit, Pionex, MEXC, Gate.io, KuCoin, HTX.
• Maker vs Taker fee selection.
• Custom option to enter your own per-side fee %.
• Fee Breakeven Line (Orange)
• Plots the exact price level you need to reach to cover entry + exit fees.
• Lets you see how far price must move before you are at true breakeven.
• Risk vs Reward Calculation
• Risk is calculated on price movement only (SL distance).
• Profit targets include fees, so “1R / 2R / 3R (net)” lines show realistic levels.
• Smart Table Display
• Account size, leverage, entry, stop, target.
• Position size (coins), notional (USDT), required margin.
• Risk at SL, fees (round trip), fee breakeven move/price.
• Profit @ TP (after fees) and net RR.
Crypto Options Greeks & Volatility Analyzer [BackQuant]Crypto Options Greeks & Volatility Analyzer
Overview
The Crypto Options Greeks & Volatility Analyzer is a comprehensive analytical tool that calculates Black-Scholes option Greeks up to the third order for Bitcoin and Ethereum options. It integrates implied volatility data from VOLMEX indices and provides multiple visualization layers for options risk analysis.
Quick Introduction to Options Trading
Options are financial derivatives that give the holder the right, but not the obligation, to buy or sell an underlying asset at a predetermined price (strike price) within a specific time period (expiration date). Understanding options requires grasping two fundamental concepts:
Call Options : Give the right to buy the underlying asset at the strike price. Calls increase in value when the underlying price rises above the strike price.
Put Options : Give the right to sell the underlying asset at the strike price. Puts increase in value when the underlying price falls below the strike price.
The Language of Options: Greeks
Options traders use "Greeks" - mathematical measures that describe how an option's price changes in response to various factors:
Delta : How much the option price moves for each $1 change in the underlying
Gamma : How fast delta changes as the underlying moves
Theta : Daily time decay - how much value erodes each day
Vega : Sensitivity to implied volatility changes
Rho : Sensitivity to interest rate changes
These Greeks are essential for understanding risk. Just as a pilot needs instruments to fly safely, options traders need Greeks to navigate market conditions and manage positions effectively.
Why Volatility Matters
Implied volatility (IV) represents the market's expectation of future price movement. High IV means:
Options are more expensive (higher premiums)
Market expects larger price swings
Better for option sellers
Low IV means:
Options are cheaper
Market expects smaller moves
Better for option buyers
This indicator helps you visualize and quantify these critical concepts in real-time.
Back to the Indicator
Key Features & Components
1. Complete Greeks Calculations
The indicator computes all standard Greeks using the Black-Scholes-Merton model adapted for cryptocurrency markets:
First Order Greeks:
Delta (Δ) : Measures the rate of change of option price with respect to underlying price movement. Ranges from 0 to 1 for calls and -1 to 0 for puts.
Vega (ν) : Sensitivity to implied volatility changes, expressed as price change per 1% change in IV.
Theta (Θ) : Time decay measured in dollars per day, showing how much value erodes with each passing day.
Rho (ρ) : Interest rate sensitivity, measuring price change per 1% change in risk-free rate.
Second Order Greeks:
Gamma (Γ) : Rate of change of delta with respect to underlying price, indicating how quickly delta will change.
Vanna : Cross-derivative measuring delta's sensitivity to volatility changes and vega's sensitivity to price changes.
Charm : Delta decay over time, showing how delta changes as expiration approaches.
Vomma (Volga) : Vega's sensitivity to volatility changes, important for volatility trading strategies.
Third Order Greeks:
Speed : Rate of change of gamma with respect to underlying price (∂Γ/∂S).
Zomma : Gamma's sensitivity to volatility changes (∂Γ/∂σ).
Color : Gamma decay over time (∂Γ/∂T).
Ultima : Third-order volatility sensitivity (∂²ν/∂σ²).
2. Implied Volatility Analysis
The indicator includes a sophisticated IV ranking system that analyzes current implied volatility relative to its recent history:
IV Rank : Percentile ranking of current IV within its 30-day range (0-100%)
IV Percentile : Percentage of days in the lookback period where IV was lower than current
IV Regime Classification : Very Low, Low, High, or Very High
Color-Coded Headers : Visual indication of volatility regime in the Greeks table
Trading regime suggestions based on IV rank:
IV Rank > 75%: "Favor selling options" (high premium environment)
IV Rank 50-75%: "Neutral / Sell spreads"
IV Rank 25-50%: "Neutral / Buy spreads"
IV Rank < 25%: "Favor buying options" (low premium environment)
3. Gamma Zones Visualization
Gamma zones display horizontal price levels where gamma exposure is highest:
Purple horizontal lines indicate gamma concentration areas
Opacity scaling : Darker shading represents higher gamma values
Percentage labels : Shows gamma intensity relative to ATM gamma
Customizable zones : 3-10 price levels can be analyzed
These zones are critical for understanding:
Pin risk around expiration
Potential for explosive price movements
Optimal strike selection for gamma trading
Market maker hedging flows
4. Probability Cones (Expected Move)
The probability cones project expected price ranges based on current implied volatility:
1 Standard Deviation (68% probability) : Shown with dashed green/red lines
2 Standard Deviations (95% probability) : Shown with dotted green/red lines
Time-scaled projection : Cones widen as expiration approaches
Lognormal distribution : Accounts for positive skew in asset prices
Applications:
Strike selection for credit spreads
Identifying high-probability profit zones
Setting realistic price targets
Risk management for undefined risk strategies
5. Breakeven Analysis
The indicator plots key price levels for options positions:
White line : Strike price
Green line : Call breakeven (Strike + Premium)
Red line : Put breakeven (Strike - Premium)
These levels update dynamically as option premiums change with market conditions.
6. Payoff Structure Visualization
Optional P&L labels display profit/loss at expiration for various price levels:
Shows P&L at -2 sigma, -1 sigma, ATM, +1 sigma, and +2 sigma price levels
Separate calculations for calls and puts
Helps visualize option payoff diagrams directly on the chart
Updates based on current option premiums
Configuration Options
Calculation Parameters
Asset Selection : BTC or ETH (limited by VOLMEX IV data availability)
Expiry Options : 1D, 7D, 14D, 30D, 60D, 90D, 180D
Strike Mode : ATM (uses current spot) or Custom (manual strike input)
Risk-Free Rate : Adjustable annual rate for discounting calculations
Display Settings
Greeks Display : Toggle first, second, and third-order Greeks independently
Visual Elements : Enable/disable probability cones, gamma zones, P&L labels
Table Customization : Position (6 options) and text size (4 sizes)
Price Levels : Show/hide strike and breakeven lines
Technical Implementation
Data Sources
Spot Prices : INDEX:BTCUSD and INDEX:ETHUSD for underlying prices
Implied Volatility : VOLMEX:BVIV (Bitcoin) and VOLMEX:EVIV (Ethereum) indices
Real-Time Updates : All calculations update with each price tick
Mathematical Framework
The indicator implements the full Black-Scholes-Merton model:
Standard normal distribution approximations using Abramowitz and Stegun method
Proper annualization factors (365-day year)
Continuous compounding for interest rate calculations
Lognormal price distribution assumptions
Alert Conditions
Four categories of automated alerts:
Price-Based : Underlying crossing strike price
Gamma-Based : 50% surge detection for explosive moves
Moneyness : Deep ITM alerts when |delta| > 0.9
Time/Volatility : Near expiration and vega spike warnings
Practical Applications
For Options Traders
Monitor all Greeks in real-time for active positions
Identify optimal entry/exit points using IV rank
Visualize risk through probability cones and gamma zones
Track time decay and plan rolls
For Volatility Traders
Compare IV across different expiries
Identify mean reversion opportunities
Monitor vega exposure across strikes
Track higher-order volatility sensitivities
Conclusion
The Crypto Options Greeks & Volatility Analyzer transforms complex mathematical models into actionable visual insights. By combining institutional-grade Greeks calculations with intuitive overlays like probability cones and gamma zones, it bridges the gap between theoretical options knowledge and practical trading application.
Whether you're:
A directional trader using options for leverage
A volatility trader capturing IV mean reversion
A hedger managing portfolio risk
Or simply learning about options mechanics
This tool provides the quantitative foundation needed for informed decision-making in cryptocurrency options markets.
Remember that options trading involves substantial risk and complexity. The Greeks and visualizations provided by this indicator are tools for analysis - they should be combined with proper risk management, position sizing, and a thorough understanding of options strategies.
As crypto options markets continue to mature and grow, having professional-grade analytics becomes increasingly important. This indicator ensures you're equipped with the same analytical capabilities used by institutional traders, adapted specifically for the unique characteristics of 24/7 cryptocurrency markets.

Crypto Realized Profits/Losses Extremes [AlgoAlpha]🌟🚀 Introducing the Crypto Realized Profits/Losses Extremes Indicator by AlgoAlpha 🚀🌟
Unlock the potential of cryptocurrency markets with our cutting-edge On-Chain Pine Script™ indicator, designed to highlight extreme realized profit and loss zones! 🎯📈
Key Features:
✨ Realized Profits/Losses Calculation: Uses real-time data from the blockchain to monitor profit and loss realization events.
📊 Multi-Crypto Compatibility: The Indicator is compatible on other Crypto tickers besides Bitcoin.
⚙️ Customizable Sensitivity: Adjust the look-back period, normalization period, and deviation thresholds to tailor the indicator to your trading style.
🎨 Visual Enhancements: Choose from a variety of colors for up and down trends, and toggle extreme profit/loss overlay for easy viewing.
🔔 Integrated Alerts: Set up alerts for high and extreme profit or loss conditions, helping you stay ahead of significant market movements.
🔍 How to Use:
🛠 Add the Indicator: Add the indicator to favorites. Customize settings like period lengths and deviation thresholds according to your needs.
📊 Market Analysis: Monitor the main oscillator and the bands to understand current profit and loss extremes in the market. When the oscillator is at the upper band, this means that the market is doing really well and traders/investors will be likely to take profit and cause a reversal. The opposite is true when the oscillator reaches the lower band. The main oscillator can also be used for trend analysis.
🔔 Set Alerts: Configure alerts to notify you when the market enters a zone of high profit or loss, or during trend changes, enabling timely decisions without constant monitoring.
How It Works:
The indicator calculates a normalized area under the RSI curve applied on on-chain data regarding the number of wallets in profit. It employs a custom "src" variable that aggregates data from the blockchain about profit and loss addresses, adapting to intraday or longer timeframes as needed. The main oscillator plots this normalized area, while the upper and lower bands are plotted based on a deviation metric to identify extreme conditions. Colored fills between these bands visually denote these zones. For interaction, the indicator plots bubbles for extreme profits or losses and provides optional bar coloring to reflect the current market trend.
🚀💹 Enjoy a comprehensive, customizable, and visually engaging tool that helps you stay ahead in the fast-paced crypto market!
