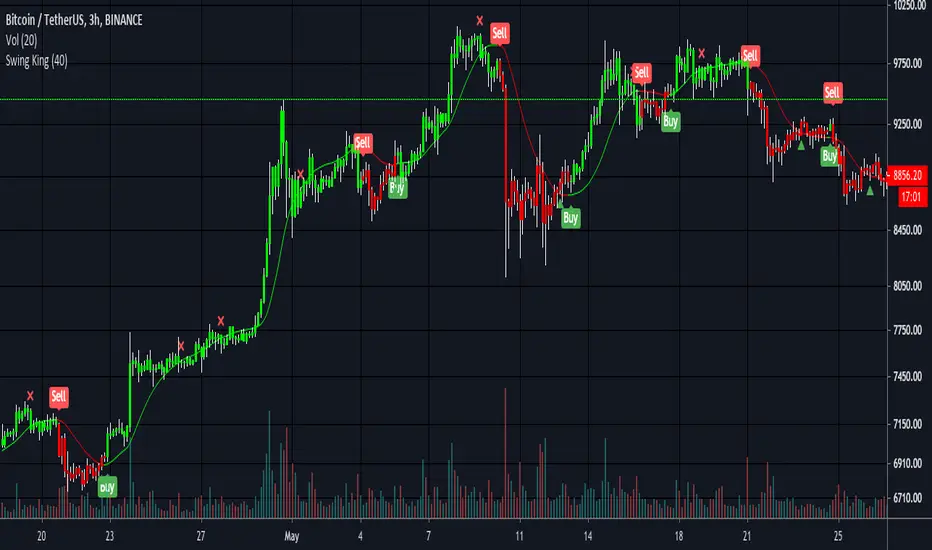
Swing King v1Utilising short and medium term trends, Swing King is perfect for riding the crypto waves. Built with the aim of smashing Bitcoin’s buy and hold return. After 5 months (Jan 2020 to May 2020) of testing and tweaking, Swing King is ready for release.
Setup with default Bitcoin settings, Swing King returned 289% in the 5 months of testing compared to buy and hold return of 29%. That’s by longing and shorting 100% of equity at 1x leverage.
Results of 5 months of testing:
1 bitcoin → 3.02 bitcoin
$7,340usd → $28,589usd
Backtesting on Ethereum had similar results. In 6 months it turned 10 eth into 14.5 eth and doubled the bitcoin value - compared to a buy and hold value of 31%.
These results were achieved with:
- Using 0.2% fees and slippage for worst case scenario
- Not using Heiken Ashi candles to fake backtest results
- No stop loss and 30% long take profit
Expect to be in trades for days and keep your losses small while letting the winners run.
Also includes trend weakening signals for manual take profit zones (cross is bullish trend weakening and triangle is bearish trend weakening) and colour coded barcolours to keep trading simple.
Green = all signals met to long
Red = all signals met to short
DM for access and pricing. Places will be limited.
Cari skrip untuk "crypto"
Cracking Cryptocurrency - Quadrigo Position SizingCracking Cryptocurrency - Quadrigo Position Sizing
This indicator is designed to work in conjunction with our position sizing calculations pursuant to the Quadrigo Indicator.
This indicator will allow a trader to input their Account Balance and desired Risk % that they have decided, through their statistical analysis, provides them the greatest Return on Equity balanced against minimal draw down.
Once inputted, the Data Window will display the recommended USD Position Size. It will also pull the current price of Bitcoin, so that a recommended BTC Position Size will be calculated as well, making orders very easy to enter on exchanges that deal in BTC values for order value.
This indicator is optimized for the aesthetics of traders using TradingView's mobile app. With a simple glance you can determine your proper position size for any trade. This is helpful because the larger Quadrigo indicator can take up a lot of screen real estate when on mobile version.

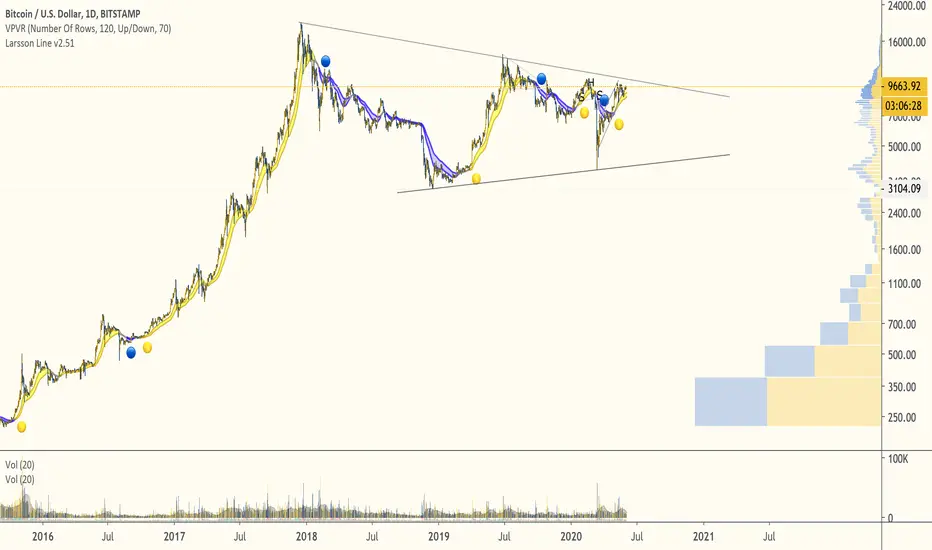
Larsson LineThe Larsson line supports trend trading of tech assets over long timeframes:
- Trend trading (unsuitable for range trading)
- 4h candles to monthly candles (less suitable for hourly candles, unsuitable for high-frequency trading)
- Tech stocks and cryptocurrencies (not designed for commodities)
The indicator can aid traders following a rule based trading system by providing measure of trend consistency that is always in exactly 1 of 3 states - up, down or inconclusive, while masking inner states.
This edition handles more edge cases than the previous indicator and is intended to replace it after a period of live use.
Musashi-Hidden-Wave Trading SystemThis Indicator is a full trading system that offers setups with Entries and Targets and Trade Management. This indicator is very accurate because it uses advanced setup detection and filtering logic.
The setup is triggered if the price passes the blue dash. Do not enter the trade unless price passes the blue dash. Each setup has 3 possible targets, which are dashes colored green for longs and red for shorts.
You can use the baseline (which is a trend-line that is either green for bullish or red for bearish ) to manage the trade. You should only enter long trades if the trend-line is green, and only enter short trades if the trend-line is red. One strategy would be if you enter a trade long, and reach the first target, you can take some profits, but still let the some of the position run, where a bar closing beyond the baseline or breaks a prior opposite pivot, would stop out your remaining position.
To summarize:
Blue Dash = Entry Trigger
Green Dashes = Long Targets (3 of them, for different price targets: target 1, 2 and 3)
Red Dashes = Short Targets (3 of them, for different price targets: target 1, 2 and 3)
The great thing about this indicator is that its universal, there are no settings necessary -- just put it on the chart and it finds high probability setups and paints it on the chart as they occur. There is NO Repainting with this indicator.
Of course, you can add other indicators if you wish, and even add this indicator to your existing trading system.
Again, this indicator does NOT repaint.
Once a setup is found, the indicator draws the entry trigger price and the targets at the setup bar close.
Setup Alerts are fully supported, via email, sms , and desktop notification.
*If you wish to license this indicator, please contact me via private message for details regarding access. Thank you.
LEGAL STUFF:
Risk Disclosure
Futures , forex, stock, crypto and derivative trading contains substantial risk and is not for every investor. An investor could potentially lose all or more than the initial investment. Risk capital is money that can be lost without jeopardizing ones’ financial security or life style. Only risk capital should be used for trading and only those with sufficient risk capital should consider trading. Past performance is not necessarily indicative of future results
Hypothetical Performance Disclosure
Hypothetical performance results have many inherent limitations, some of which are described below. no representation is being made that any account will or is likely to achieve profits or losses similar to those shown; in fact, there are frequently sharp differences between hypothetical performance results and the actual results subsequently achieved by any particular trading program. One of the limitations of hypothetical performance results is that they are generally prepared with the benefit of hindsight. In addition, hypothetical trading does not involve financial risk, and no hypothetical trading record can completely account for the impact of financial risk of actual trading. for example, the ability to withstand losses or to adhere to a particular trading program in spite of trading losses are material points which can also adversely affect actual trading results. There are numerous other factors related to the markets in general or to the implementation of any specific trading program which cannot be fully accounted for in the preparation of hypothetical performance results and all which can adversely affect trading results

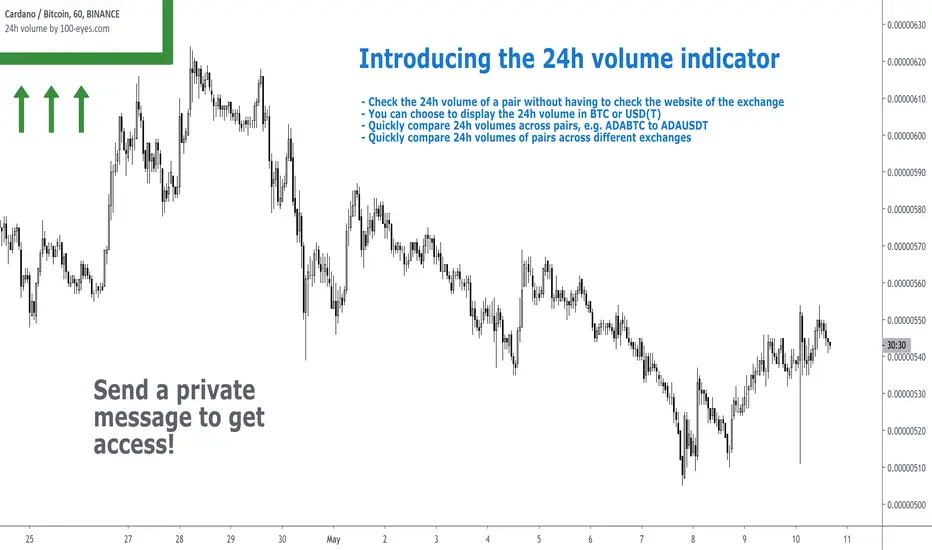
24h volume by 100eyesIntroducing the 24h volume indicator on Tradingview!
DM me (Trading-Guru) here on Tradingview to get access to this indicator.
100eyes asked me to create a new Tradingview indicator that estimates the 24h volume of a pair. Works for all BTC/USDT/USD/ETH crypto pairs. You can choose to display the 24h volume in BTC or USD(T).
This indicator allows you to:
Check the 24h volume of a pair without having to check the website of the exchange
Quickly compare 24h volumes across pairs, e.g. ADABTC to ADAUSDT
Quickly compare 24h volumes of pairs across different exchanges
Volume is an important factor in crypto trading to estimate liquidity. Use this indicator to adjust your position size according to the volume of a pair.
Even on the website of an exchange, it's difficult to compare volume since for example volumes of USDT pairs are expressed in USDT, and volumes of BTC pairs are expressed in BTC. This indicator solves that problem by expressing everything in the same currency, and also directly on Tradingview!
F.A.Q.
Q: How do I get access to the indicator?
A: DM Trading-Guru on Tradingview.
Q: Why are there different values for different timeframes?
A: That is due to Tradingview limitations. The smaller the timeframe, the more accurate the displayed value. The timeframe you're looking at equals the maximum amount of lag.
Q: I'm on the Tradingview mobile app, why is the value is not displayed next to the indicator's name?
A: Click somewhere inside the chart. Then the indicator value will appear.
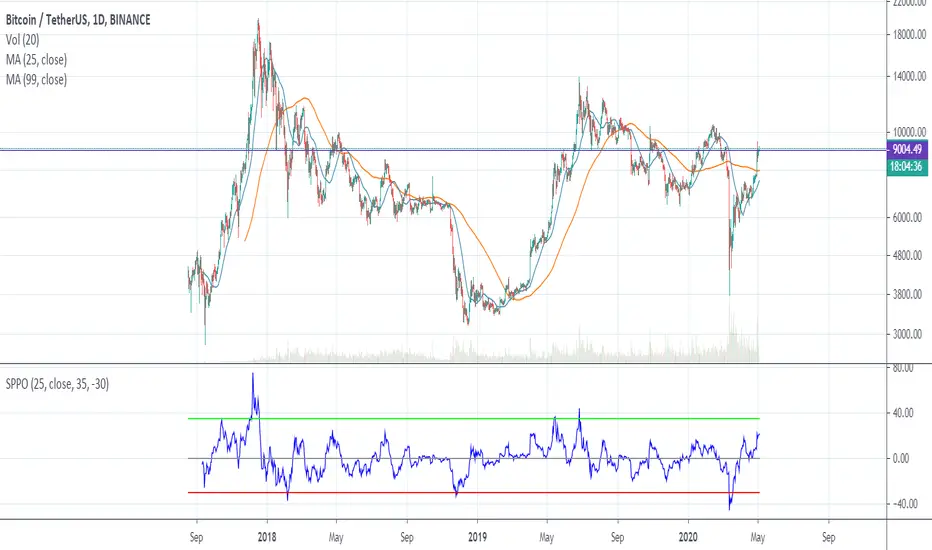
SPPO — Simple Percentage Price Oscillator SPPO is Simple Percentage Price Oscillator .
SPPO is calculated as the ratio of the current price to the moving average.
This indicator is used in the trading strategy to determine overbought and oversold markets. Chart period D1.
I use this oscillator on the BTCUSD and ETHUSD pairs. It can also be used on other top crypto symbols.
If SPPO on the BTCUSDT chart > 35%, this means that in the Bitcoin market pamp . So it’s time to close long positions.
If SPPO on the bitcoin chart is <-30%, then bitcoin is oversold and you need to think about starting to buy it.
Recommended timeframe: 1d
Input parameters:
MA Length — number of bars for moving average. Default = 25.
Source — type of price used to calculate the MA. Default = close.
High Level — upper horizontal constant on the SPPO chart. Default = 35.
Low Level — lower horizontal constant on the SPPO chart. Default = -35.
Simple MA(Oscillator) — type of MA indicator used. If false = Exponential Moving Average , if true = Simple Moving Average . Default = true.
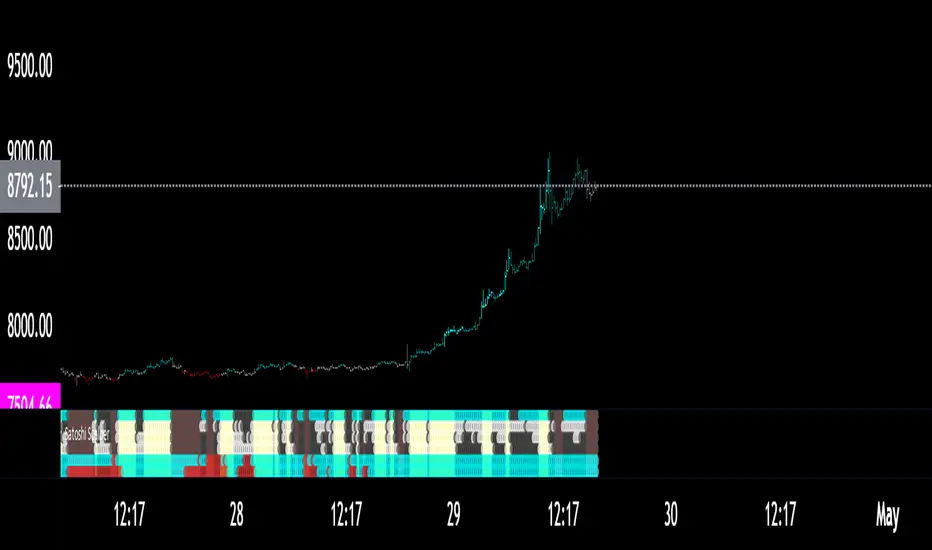
Satoshi Scalper ToolA little trigger key for an algorithm/system I have developed over the years to confirm wave patterns after a trade idea is made or entered
Can be used as a stand alone so i created this key that will fill in accordance to the signal.
The first 4 rows are the most important and those will be your entry criteria
Once all 4 trigger the space will become shaded
LONG = YELLOW BG
SHORT = RED BG
Cyan/White is BULLISH
Red/Gray is BEARISH
the bottom two rows are your main trend BULL or BEAR in regards to two variables i have chosen
NOW you dont need to listen to these to enter a trade HOWEVER you should treat a counter-trade to main trends as a short day trade or scalp
Added the famous SRSI candles to the script for a visual :)
I also made the settings FIXED
This was developed in Crypto but it works well in all other markets.
To attain access DM me here or on twitter if you follow me there!
CHEERS
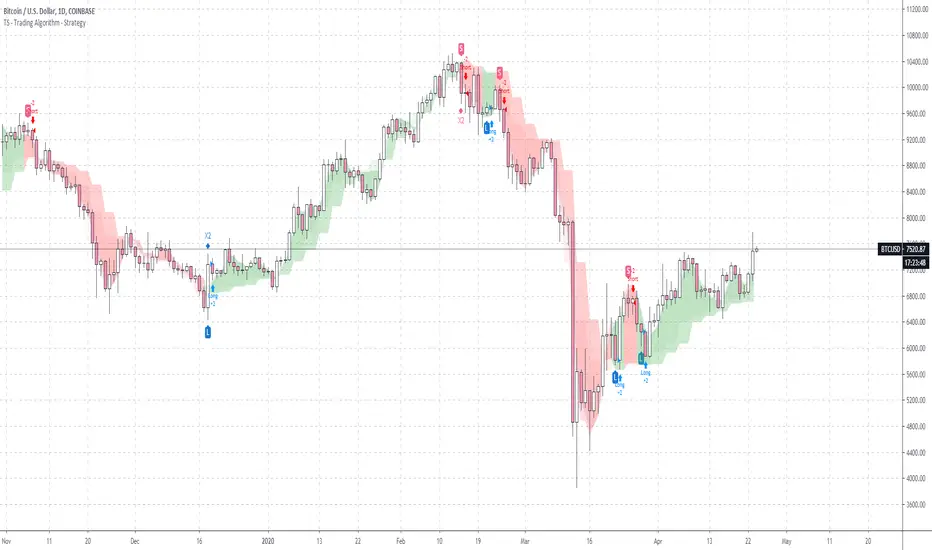
TS - Long Term Trading Algorithm - StrategyStrategy to the bespoke TS - Trading Algorithm. Highly profitable cryptocurrency trading model.
This script is long only profitable strategy- there is a script coming in the next few days for shorter timeframe long & short trading.
- Backtesting is from 2017.
- 0.05% commission
- 100% capital allocation per trade.
Access to both the backtesting strategy & indicator is paid - PM me for details.

TS - Trading Algorithm - StrategyStrategy to the bespoke TS - Trading Algorithm . Highly profitable cryptocurrency trading model.
Access to both the backtesting strategy & indicator is paid - PM me for details.
Indicator does not repaint and has no discretionary approach - you can follow blindly and take advantage of the performance.
Super AlgorithmIf you make a loss, I am not responsible for it. Please use this with caution that includes proper risk and money management.
When I see a sell signal, I may short &/or close my long.
When I see a buy signal, I may long &/or close my short.
The signal is most relevant for the exact time it comes on the chart. When the bar closes, it does not repaint.
The signal can show up and disappear on a running bar. It DOES NOT repaint once the bar is closed.
Do realize that on bar close, the price may have moved significantly, and the signal may not be relevant anymore. So, it needs to be used with caution whether one uses this as soon as a signal appears or on bar close. This is not suitable for the highly large timeframe (ake over 1day). I use it on 1 day and monthly on the lower timeframe.
My primary motivation for building this was three -
1) To ensure I am not addicted and not looking at the chart 24/7
2) To ensure I do not spend a lot of time & resources on multiple indicators
3) I have a consistent profit that can help me in my poor living expenses.
4) Recently, during the huge drawdown, I noticed that my other indicator () was unable to act as quickly as needed as the volatility happened in the lower timeframe. It made me realize that I need to do something to protect my capital in the future. Hence, the idea for this indicator.
5) I use this indicator alongside my other indicators that are showing the chart as well.
In the chart above, I am using
*
*
*
*
* And this indicator
You do not need to use all of these indicators. I have them always on my chart as I showed above.
The buy and sell shown with a blue background is the one coming from this indicator. The only thing that one can customize is colour.
This indicator differs significantly from my other indicators. This indicator prints less signal as careful work went in to reduce noise as much as possible and is to be used for 1 day or less tf.
I use it alongside other indicators for confirmation bias. The other indicators I use are the ones that come from me as well as shown on the chart.
This can possibly be used for other instruments. As I only use it for trading BTCUSD, I have crudely tested for BTCUSD after the dump and has been doing ok so far.
The code is written in Version 4 of pine script. If there are bugs, please let me know.
For info on gaining access see the ⬇ link below ⬇ in our signature field & direct message me. I have a busy schedule at my own workplace. Trading is my hobby. Hence, please be kind to me if I am late in replying

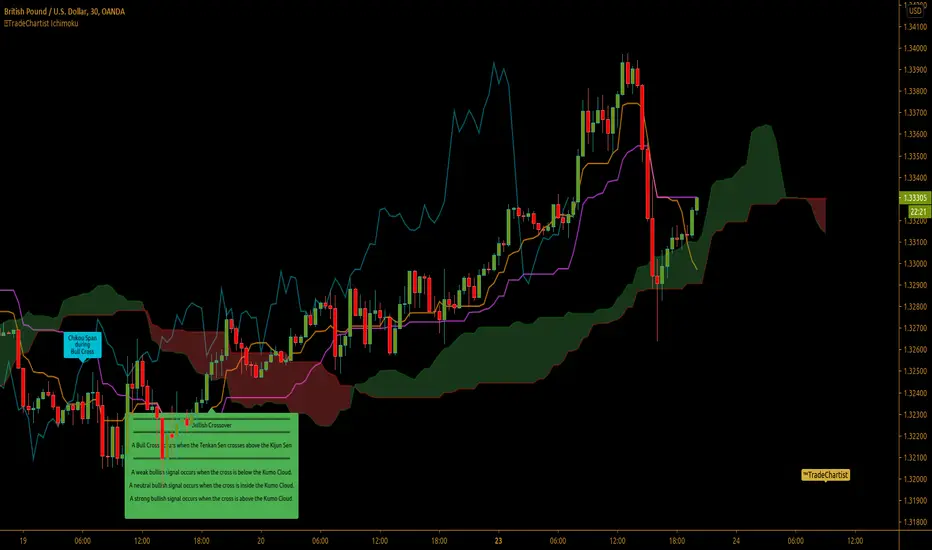
™TradeChartist - Show and Tell - Ichimoku Cloud™TradeChartist Show and Tell - Ichimoku Cloud is a free and easy to use script that helps anyone learn and understand the Ichimoku cloud by using the 'Show and Tell' option from the indicator settings and by choosing the Ichimoku component/Signal from the dropdown box. For individuals new to Ichimoku Cloud , Show and Tell option will help explain the components and signals of Ichimoku Cloud on the chart without having to navigate away from price action, thus making it easier to learn and understand Ichimoku cloud with respect to chart price action on the corresponding time frame.
The indicator automatically detects cryptocurrencies as it uses different settings specific to cryptocurrencies market - (20,60,120,30) respectively as opposed to classic - (9,26,52,26).
When 'Show and Tell' is unchecked from indicator settings, the script detects signals and important Ichimoku events like Bull/Bear crosses, Bullish/Bearish Kumo Twists, Bullish/Bearish Kumo Breakouts etc and plots labels on chart. To turn off this feature, just uncheck 'Labels' from the styles tab under the indicator settings.
This is a free to use indicator. Give a thumbs up or leave a comment if you like the script.
MACD & Mayer multpile Crypto-EmbassyThis is a combination of two indicators MACD & The Mayer Multiple.
MACD = Short for moving average convergence/divergence. It is designed to reveal changes in the strength, direction, momentum, and duration of a trend in a stock's price.
You will find the normal histogram and also a generated trend line (green = bullish , red = bearish )
The Mayer Multiple = The Mayer Multiple was created by Trace Mayer as a way to analyse the price of Bitcoin in a historical context. The Mayer Multiple is the multiple of the current price over the 200-days moving average.
"It does NOT tell whether to buy, sell or hold" but it gives you a pretty good idea of where we are at.
Basically
🔵Blue = Please buy🙏
🟢Light green = Looking for good entries 👀
🟢Green = Buy if you wish
🟡Yellow = This is starting to take off
🟠Orange = Looking for good exit 👀
🔴Red = You should get out of this
🔴Dark Red = You have balls, now please sell🙏

Best Volatility Calculator (Multi Instruments)Hello traders
A bit of context
Definition: Volatility is defined as the close of current candle - close of the previous N candle
This is an alternative version of my Best Volatility Calculator
The other version is displayed on a panel below. This one overlays on the chart using the "overlay=true" setting
This indicator shows the average volatility, of last N Periods, for the selected time frames and for 2 selected instruments.
You can select up to 2 timeframes with this version
Presented as Currency, Pip, percentage labels in a panel below.
Will calculate in real-time only for the current instrument on the chart.
The indicator is coded to not be repainting
Example
In the indicator screenshot, I used a lookback period of 1.
That compares the current candle close versus the previous one for the daily and weekly timeframe
Showing how the results look like using FOREX instruments (where using the PIPS labels make more sense than with cryptocurrency assets)
Best regards
Dave

Trade System Crypto InvestidorTrade System created to facilitate the visualization of crossing and extensions of the movements with Bollinger bands.
Composed by:
Moving Averages of 21, 50, 100 and 200.
Exponential Moving Averages: 17,34,72,144, 200 and 610.
Bollinger bands with standard deviation 2 and 3.
How it works?
The indicators work together, however there are some important cross-averages that need to be identified.
- Crossing the MA21 with 50, 100 and 200 up or down will dictate an up or down trend.
- MA200 and EMA200 are excellent indicators of resistance and support zone, if the price is above these averages it will be a great support, if the price is below these averages it will indicate strong resistance.
- Another important crossover refers to exponential moving averages of 17 to 72 indicates a possible start of a trend
- The crossing of the exponential moving average of 34 with 144 will confirm the crossing mentioned above.
- In addition, the exponential moving average of 610 used by Bo Williams is an excellent reference for dictating an upward or downward trend, if the price is above it it will possibly confirm an upward trend and the downside.
- To conclude we have bollinger bands with standard deviation 2 and 3, they help to identify the maximum movements.

HatiKO EnvelopesPublished source code is subject to the terms of the GNU Affero General Public License v3.0
This script describes and provides backtesting functionality to internal strategy of algorithmic crypto trading software "HatiKO bot".
Suitable for backtesting any Cryptocurrency Pair on any Exchange/Platform, any Timeframe.
Core Mechanics of this strategy are based on theory of price always returning to Moving Average + Envelopes indicator (Moving_average_envelope from Wiki)
Developement of this script and trading software is inspired by:
"Essential Technical Analysis: Tools and Techniques to Spot Market Trends" by Leigh Stevens (published on 12th of April 2002)
"Moving Average Envelopes" by ChartSchool, StockCharts platform (published on 13th of April 2015 or earlier)
"Коля Колеснік" from Crypto Times channel ("Метод сетка", published on 19th of August 2018)
"3 ways to use Moving Average Envelopes" by Rich Fitton, published on Trader's Nest (published on 28st of November 2018 or earlier)
noro's "Robot WhiteBox ShiftMA" strategy v1 script, published on TradingView platform (published on 29th of August 2018)
"Moving Average Envelopes: A Popular Trading Tool" Investopedia article (published 25th of June 2019)
and KROOL1980's blogpost on Argolabs ("Гридерство или Сетка как источник прибыли на форекс", published on 27th of February 2015)
Core Features:
1) Up to 4 Envelopes in each direction (Long/Short)
2) Use any of 6 different basis MAs, optionally use different MAs for Opening and Closure
3) Use different Timeframes for MA calculation, without any repainting and lookahead bias.
4) Fixed order size, not Martingale strategy
5) Close open position earlier by using Deviation parameter
6) PineScript v4 code
Options description:
Lot - % from your initial balance to use for order size calculation
Timeframe Short - Timeframe to use for Short Opening MA calculation, can be chosen from dropdown list, default is Current Graph Timeframe
MA Type Short - Type of MA to use for Short Opening MA calculation, can be chosen from dropdown list, default is SMA
Data Short - Source of Price for Short Opening MA calculation, can be chosen from dropdown list, default is OHLC4
MA Length Short - Period used for Short Opening MA calculation, should be >=1, default is 3
MA offset Short - Offset for MA value used for Short Envelopes calculation, should be >= 0, default is 0
Timeframe Long - Timeframe to use for Long Opening MA calculation, can be chosen from dropdown list, default is Current Graph Timeframe
MA Type Long - Type of MA to use for Long Opening MA calculation, can be chosen from dropdown list, default is SMA
Data Long - Source of Price for Long Opening MA calculation, can be chosen from dropdown list, default is OHLC4
MA Length Long - Period used for Long Opening MA calculation, should be >=1, default is 3
MA offset Long - Offset for MA value used for Long Envelopes calculation, should be >= 0, default is 0
Mode close MA Short - Enable different MA for Short position Closure, default is "false". If false, Closure MA = Opening MA
Timeframe Short Close - Timeframe to use for Short Position Closure MA calculation, can be chosen from dropdown list, default is Current Graph Timeframe
MA Type Close Short - Type of MA to use for Short Position Closure MA calculation, can be chosen from dropdown list, default is SMA
Data Short Close - Source of Price for Short Closure MA calculation, can be chosen from dropdown list, default is OHLC4
MA Length Short Close - Period used for Short Opening MA calculation, should be >=1, default is 3
Short Deviation - % to move from MA value, used to close position above or beyond MA, can be negative, default is 0
MA offset Short Close - Offset for MA value used for Short Position Closure calculation, should be >= 0, default is 0
Mode close MA Long - Enable different MA for Long position Closure, default is "false". If false, Closure MA = Opening MA
Timeframe Long Close - Timeframe to use for Long Position Closure MA calculation, can be chosen from dropdown list, default is Current Graph Timeframe
MA Type Close Long - Type of MA to use for Long Position Closure MA calculation, can be chosen from dropdown list, default is SMA
Data Long Close - Source of Price for Long Closure MA calculation, can be chosen from dropdown list, default is OHLC4
MA Length Long Close - Period used for Long Opening MA calculation, should be >=1, default is 3
Long Deviation - % to move from MA value, used to close position above or beyond MA, can be negative, default is 0
MA offset Long Close - Offset for MA value used for Long Position Closure calculation, should be >= 0, default is 0
Short Shift 1..4 - % from MA value to put Envelopes at, for Shorts numbers should be positive, the higher is number, the higher should be Shift position, example: "Shift 1 = 1, shift 2 = 2, etc."
Long Shift 1..4 - % from MA value to put Envelopes at, for Longs numbers should be negative, the lower is number, the lower should be Shift position, example: "Shift 1 = -1, shift 2 = -2, etc."
From Year 20XX - Backtesting Starting Year number, only 20xx supported as script is cryptocurrency-oriented.
To Year 20XX - Backtesting Final Year number, only 20xx supported as script is cryptocurrency-oriented.
From Month - Years starting Month, optional tweaking, changing not recommended
To Month - Years ending Month, optional tweaking, changing not recommended
From day - Months starting day, optional tweaking, changing not recommended
To day - Months ending day, optional tweaking, changing not recommended
Graph notes:
Green lines - Long Envelopes.
Red lines - Short Envelopes.
Orange line - MA for closing of Short positions.
Lime line - MA for closing of Long positions.
**************************************************************************************************************************************************************************************************************
Опубликованный исходный код регулируется Условиями Стандартной Общественной Лицензии GNU Affero v3.0
Этот скрипт описывает и предоставляет функции бектеста для внутренней стратегии алгоритмического программного обеспечения "HatiKO bot".
Подходит для тестирования любой криптовалютной пары на любой бирже/платформе, на любом таймфрейме.
Кор-механика этой стратегии основана на теории всегда возвращающейся к значению МА цены с использованием индикатора Envelopes (Moving_average_envelope from Wiki)
Разработка этого скрипта и программного обеспечения для торговли вдохновлена следующими источниками:
Книга "Essential Technical Analysis: Tools and Techniques to Spot Market Trends" Ли Стивенса (опубликовано 12 апреля 2002 года)
«Moving Average Envelopes» от ChartSchool, платформа StockCharts (опубликовано 13 апреля 2015 года или раньше)
«Коля Колеснік» с канала Crypto Times («Метод сетка», опубликовано 19 августа 2018 года)
«3 ways to use Moving Average Envelopes» Рича Фиттона, опубликованные в «Trader's Nest» (опубликовано 28 ноября 2018 года или раньше)
Скрипт стратегии noro "Robot WhiteBox ShiftMA" v1, опубликованный на платформе TradingView(опубликовано 29 августа 2018 года)
«Moving Average Envelopes: A Popular Trading Tool», статья Investopedia (опубликовано 25 июня 2019 года)
Блог KROOL1980 из Argolabs («Гридерство или Сетка как источник прибыли на форекс», опубликовано 27 февраля 2015 года)
Основные особенности:
1) До 4-х Ордеров в каждом из направлении (Лонг / Шорт)
2) Выбор из 6-ти разных базовых МА, опционально используйте разные МА для открытия и закрытия.
3) Используйте разные таймфреймы для расчета MA, без перерисовки и "эффекта стеклянного шара".
4) Фиксированный размер ордера, а не стратегия Мартингейла
5) Возможность закрытия открытой позиции заблаговременно, используя параметр Deviation
6) Код реализован на PineScript v4
Описание параметров:
Lot - % от вашего первоначального баланса, используется при расчете размера Ордера
Timeframe Short - таймфрейм, используемый для расчета МА Открытия Шорт позиций, может быть выбран из списка, по умолчанию - таймфрейм текущего графика
MA Type Short - тип MA, используемый для расчета МА Открытия Шорт позиций, может быть выбран из списка, по умолчанию SMA
Data Short - источник цены для расчета МА Открытия Шорт позиций, может быть выбран из списка, по умолчанию OHLC4
MA Length Short - период, используемый для расчета МА Открытия Шорт позиций, должен быть >= 1, по умолчанию 3
MA Offset Short - смещение значения MA, используемого для расчета Шорт Ордеров, должно быть >= 0, по умолчанию 0
Timeframe Long - таймфрейм, используемый для расчета МА Открытия Лонг позиций, может быть выбран из списка, по умолчанию - таймфрейм текущего графика
MA Type Long - тип MA, используемый для расчета МА Открытия Лонг позиций, может быть выбран из списка, по умолчанию SMA
Data Long - источник цены для расчета МА Открытия Лонг позиций, может быть выбран из списка, по умолчанию OHLC4
MA Length Long - период, используемый для расчета МА Открытия Лонг позиций, должен быть >= 1, по умолчанию 3
MA Offset Long - смещение значения MA, используемого для расчета Лонг Ордеров, должно быть >= 0, по умолчанию 0
Mode close MA Short - Включает отдельное MA для закрытия Шорт позиции, по умолчанию «false». Если false, MA Закрытия = MA Открытия
Timeframe Short Close - таймфрейм, используемый для расчета МА Закрытия Шорт позиций, может быть выбран из списка, по умолчанию - таймфрейм текущего графика
MA Type Close Short - тип MA, используемый при расчете МА Закрытия Шорт позиции. Mожно выбрать из списка, по умолчанию SMA
Data Short Close - источник цены для расчета МА Закрытия Шорт позиций, может быть выбран из списка, по умолчанию OHLC4
MA Length Short Close - период, используемый для расчета МА Закрытия Шорт позиции, должен быть >= 1, по умолчанию 3
Short Deviation - % отклонения от значения MA, используется для закрытия позиции выше или ниже рассчитанного значения MA, может быть отрицательным, по умолчанию 0
MA Offset Short Close - смещение значения MA, используемого для расчета закрытия Шорт позиции, должно быть >= 0, по умолчанию 0
Mode close MA Long - Включает разные MA для закрытия Лонг позиции, по умолчанию «false». Если false, MA Закрытия = MA Открытия
Timeframe Long Close - таймфрейм, используемый для расчета МА Закрытия Лонг позиций, может быть выбран из списка, по умолчанию - таймфрейм текущего графика
MA Type Close Long - тип MA, используемый при расчете МА Закрытия Лонг позиции. Mожно выбрать из списка, по умолчанию SMA
Data Long Close - источник цены для расчета МА Закрытия Лонг позиций, может быть выбран из списка, по умолчанию OHLC4
MA Length Long Close - период, используемый для расчета МА Закрытия Лонг позиции, должен быть >= 1, по умолчанию 3
Long Deviation -% для перехода от значения MA, используется для закрытия позиции выше или ниже рассчитанного значения MA, может быть отрицательным, по умолчанию 0
MA Offset Long Close - смещение значения MA, используемого для расчета закрытия Лонг позиции, должно быть >= 0, по умолчанию 0
Short Shift 1..4 - % от значения MA для размещения Ордеров, для Шорт Ордеров должен быть положительным, чем выше номер, тем выше должна располагаться позиция Shift, например: «Shift 1 = 1, Shift 2 = 2 и т.д. "
Long Shift 1..4 - % от значения MA для размещения Ордеров, для Лонг Ордеров должно быть отрицательным, чем ниже число, тем ниже должна располагаться позиция Shift, например: «Shift 1 = -1, Shift 2 = -2, и т.д."
From Year 20XX - Год начала тестирования, из-за ориентированности на криптовалюты поддерживаются только значения формата 20хх.
To Year 20XX - Год окончания тестирования, из-за ориентированности на криптовалюты поддерживаются только значения формата 20хх.
From Month - Начальный месяц, опционально, менять не рекомендуется
To Month - Конечный месяц, опционально, менять не рекомендуется
From day - Начальный день месяца, опционально, менять не рекомендуется
To day - Конечный день месяца, опционально, менять не рекомендуется
Пояснения к графику:
Зеленые линии - Лонг Ордера.
Красные линии - Шорт Ордера.
Оранжевая линия - MA Закрытия Шорт позиций.
Лаймовая линия - MA Закрытия Лонг позиций.

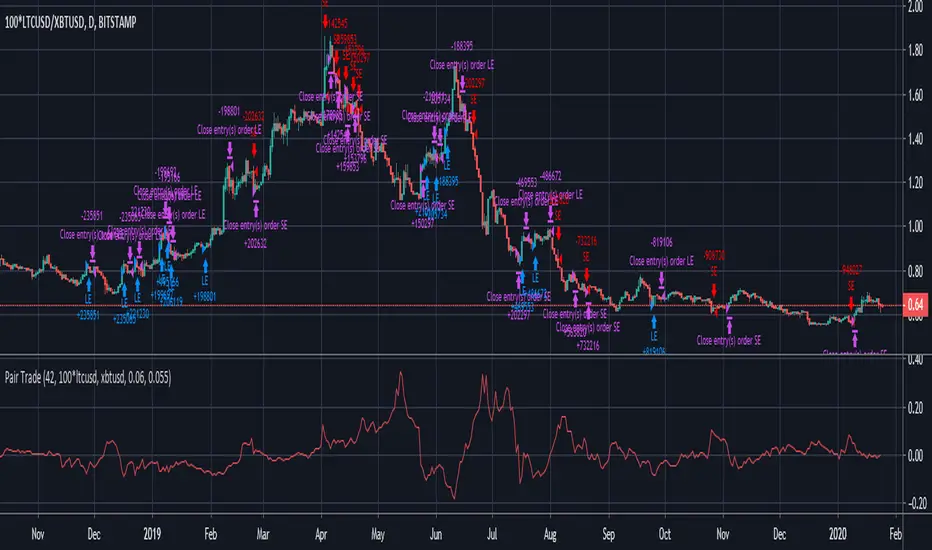
Pair Trade cryptoPair trade for crypto with inputs:
* length of correlation and moving average
* trade pair
* spread threshold to enter long / short
* spread threshold to exit long / short
ALTS-Trend
ALTS-Trend
Altcoins-Trend is a technique that shows how much Altcoins is dominating the Marketcap and it's effect over the whole Crypto Market ,and that will show you alts season in each time frame because trend is relative .
*** Features
* Color grading to show you the Increase of domination effect (Green).
* Color grading to show you the Decrease of domination effect (Red) .
* Better understanding to the market ,and that will help you with a very good timed trades at the best trading times for altcoins .
/////////////////////////////////////////////
*Note
Special thanks for Lazybear for his momentum algorithm .
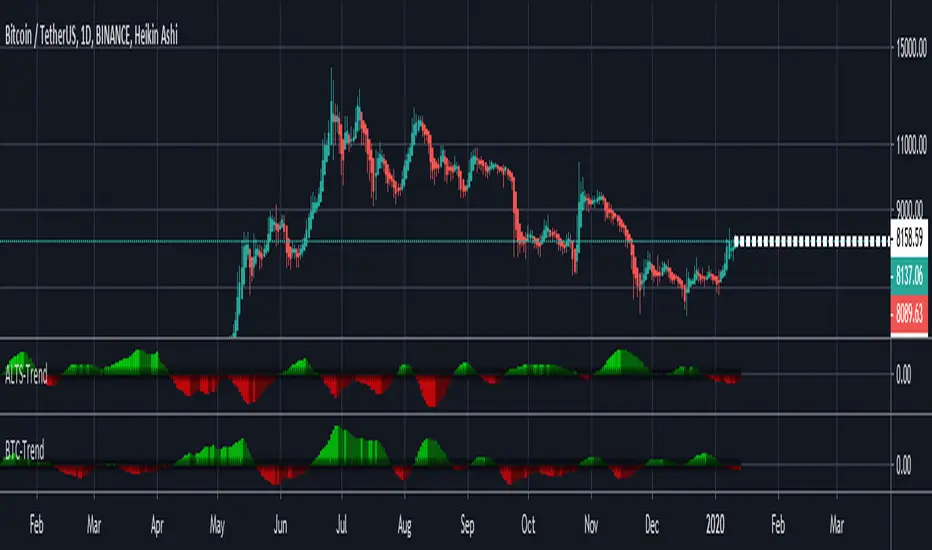
BTC-Trend
BTC-Trend
BTC-Trend is a technique that shows how much BTC is dominating the market and it's effect over the whole Crypto Market.
*** Features
* Color grading to show you the Increase of domination effect (Green).
* Color grading to show you the Decrease of domination effect (Red) .
* Better understanding to the market ,and that will help you with a very good timed trades at the best trading times .
/////////////////////////////////////////////
*Note
Special thanks for Lazybear for his momentum algorithm .

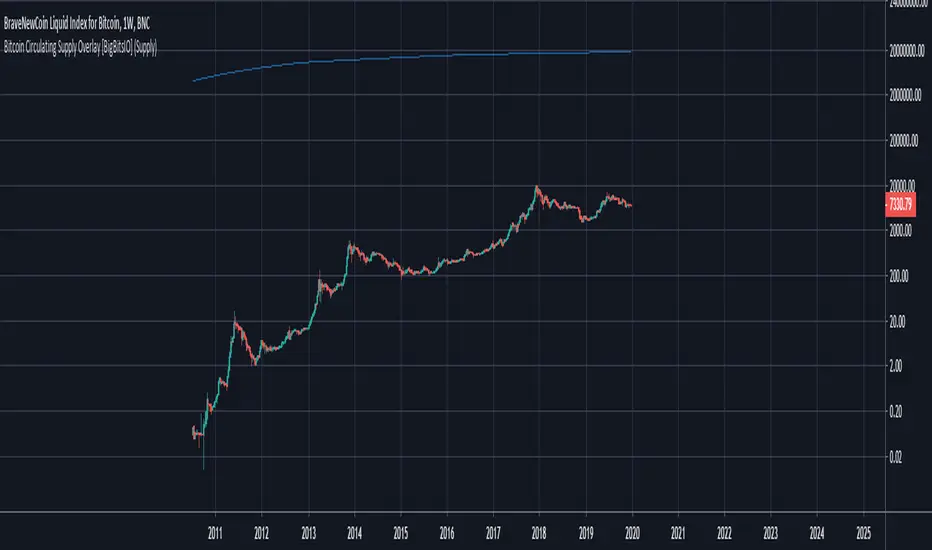
Bitcoin Circulating Supply Overlay [BigBitsIO]This script shows the estimated circulating supply of Bitcoin on any given day.
Features:
- Estimated Bitcoin circulating supply calculated daily
- Uses the Bitcoin reward schedule, past halving dates, and the next upcoming halving estimated date to calculate the current estimated supply.
- Optionally includes an option to use "Log Reduction" on the chart
*** DISCLAIMER: For educational and entertainment purposes only. Nothing in this content should be interpreted as financial advice or a recommendation to buy or sell any sort of security or investment including all types of crypto. DYOR, TYOB. ***
BEST Mayer MultipleHello traders
I'm not a HODLer by any means. I know when to sell (or I think I know....) when an asset starts going against me too much.
Even if it's a "long-term" investment.
My mentor used to telling me this: "If a short-term trade becomes a long-term investment, then you're in for a hell of a ride".
I have no clue if Bitcoin/BTC will go back up or not - I don't even care because I'm an intraday trader.
What if BTC was actually a way to accumulate more fiat? Satoshi fooled us
I coded this Mayer Multiple according to the specifications below. By the way, I'm a big fan of Willy Woo. I've been monitoring all his work since I learned about crypto (10 minutes ago.... it's a joke come on)
charts.woobull.com
Scaling
To respect the Mayer's multiple model, I recommend to select the Logarithmic scaling as shown below
imgur.com
What Mayer's model says
Using the reference below, the model says we're in the oversold zone. But, we can be in that zone for months/years...
When a model says an asset could bounce in a 1000-7000 USD range... well... I don't know how I would be able to perform optimally with that insight. This is very subjective and not a recommendation.
Mayer's Multiple model reference
All the BEST
Dave

(12) Pass Band Muti VS-97PBM transforms volatile and conflicting candles into obvious and easy trading decisions. It’s this simple; stocks trending in an upward direction will be above the zero line (1) in the chart below. Stock trending downward will be below the zero line (2). Zero line crossovers are indicating turning points and trading opportunities (3). This gives you advanced warning of when your trades are approaching the next turning point, as the indicator will migrate back toward the zero line. Momentum, Volatility and Rate-of-Change are each unique and distinctive attributes of stocks in strong trends. The Pass Band Multi indicator provides the trader with a collective or merged indication of these attributes, all reflected by this indicator as the height or distance the Pass Band, sin-wave, signal line is from the zero line (4).
When a stock’s PBM indicator advances rapidly, moving far above or far below the zero line you are seeing stocks in a strong trend with strong momentum. This strength and correspondingly the momentum will diminish over time in the absence of new market motivating factors such as rumors, news or earnings. As this occurs, the signal line will again drift down and approach the zero line even if the price has not moved against this most recent trend(5). This is a function of most oscillators and is referred to as detrending.
The closer your trade comes to the zero line the more likely you are to see a reversal in the stock's price in the near future. The PBM signal moving inside the center band (gold lines/blue fill)(6) indicates to you that this upward momentum has neutralized and an exit may be required as the stock’s price approaches the zero line. If you have a strong convection of this stock’s long term potential, then you can hold the stock as long as the Pass Band signal does not move below the zero line.
Stocks approaching the zero line, moving inside of the blue center band with gold boarders or tracking very near to the zero line indicate to traders that some action may be required by them to preserve capital in the near future. Short signals are exactly the opposite of the above description.
Over extended prices are signaled by green or red background flags and periods of consolidation are flagged with gold a background color.
Pass Band Multi is an excellent indicator for any class of equity, but as you can see from the example chart, it is also an excellent crypto trading indicator.
Access this Genie indicator for your Tradingview account, through our web site. (Links Below) This will provide you with additional educational information and reference articles, videos, input and setting options and trading strategies this indicator excels in.

Ultimate Gemstone‘’Ultimate Gemstone = best indicator to accurately predict price movement based on momentum’’
This indicator is combination of multiple indicators (RSI, Stoch, GM, Moving averages & CCI) works on all the trading assets and time frames. Accurately predicts top and bottoms ( tested on all major crypto's, stocks and forex).
Comes with 6 different presets with different calculations giving additional flexibility to the user.
"Instructions How To Use"
This indicator is based on four different moving lines depicting momentum; first line (Aqua) is a fast trend line, which reacts rapidly to existing price action, second line (Purple) is slower and takes more price action into account, while third line (Yellow) is the slowest and depicts overall trend. Additionally, CCI/EMA moving line with changing color's (red/green) acts as a another trend confirmation tool.
The three moving lines acts as support and resistance depending on there location to each other. Non-moving parts include fibonacci support and resistance (68.2 & 38.2) areas of the oscillator. Different caution (Red, Green dots & background flashes) settings based on GM indicator to help identify perfect buying and selling opportunities. Additionally, the oscillator has oversold, overbought, bullish and bearish control zones similar to RSI/Stoch oscillators. Similar to RSI/Stoch divergences and trendlines do also work on this oscillator. Other ways to use is Aqua line crossovers with the Purple line, giving hard buy/sell signals and Aqua(fast) line turning (angle change) indicating momentum is reversing.
Example 1: When faster moving line gets pulled into the medium and slower line (especially in the overbought territory of the oscillator) gives you indication to be prepared as most likely the price will go down. Perfectly called Bitcoin top in 2017.
Example 2: BTC bottom in dec2018 and start of new trend in feb2019
Example 3 BTC Top in june2019
Example 4 works across all time frames, Recent BTC price action from 6500 to 7700.
Example 5 LINKBTC daily

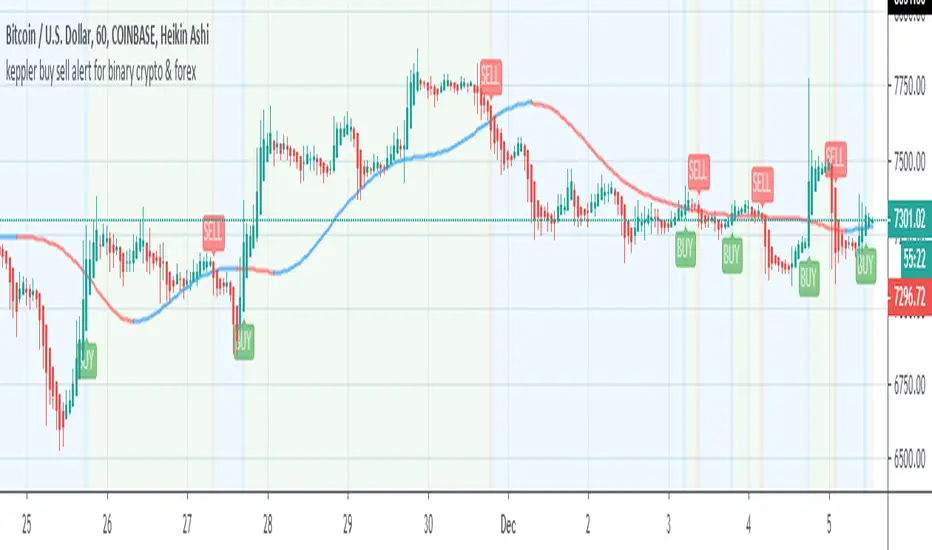
keppler buy sell alert for binary crypto & forexthis script is 100% working on binary 1 min trading
crypto and forex use on hourly charts for best results.