Cari skrip untuk "crypto"

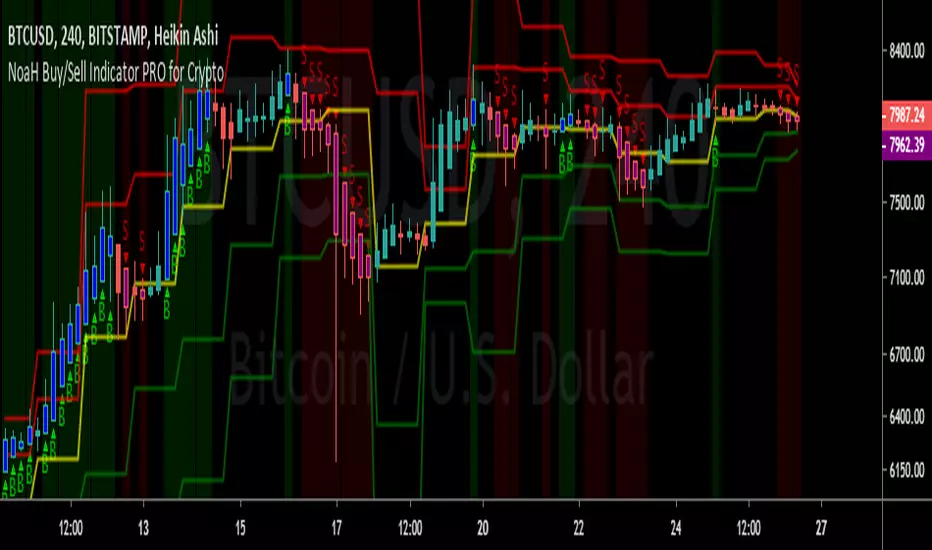
NoaH Buy/Sell Indicator PRO for Crypto Noah Crypto introduces an improved specified version Buy/Sell indicator for cyptocurrency market.
- This indicator can work for all pairs on all exchanges but for CRYPTO MARKET ONLY. Don't use it for margin trading or other markets.
- This indicator was optimized for Heikin Ashi chart, so please use it on Heikin Ashi charts only. Wrong chart may lead to wrong signals.
- This indicator shows best performance at M30, H4 and D1. So it is very suitable for day traders or scalp traders.
BENEFITS OF THIS VERSION:
- Show Buy/Sell zones: Good buy zone are 3 first candles marked with 'B' letter, close/exit buy on first 'S' candle confirmed.
- Targets and stop-loss are shown directly on chart. Buy/Sell areas have Green/Red background.
- No 'B' or 'S' marked on candles indicates the undecided market, wait for trend to be more clear to put orders.
- Applicable to set alarm when a coin reaches entry, sell targets or stop-loss.
PM me for 1 day trial and monthly fee, or if you have question or need support.
Crypto GapCrypto trade 24 hours a day, so there is no real gap.
But the gap is a price area actually where nobody or very few people trade.
This script marks all those areas on your chart.
You'd better use the daily chart and change the marked candle color same as your chart background color, then you'll see the magic.


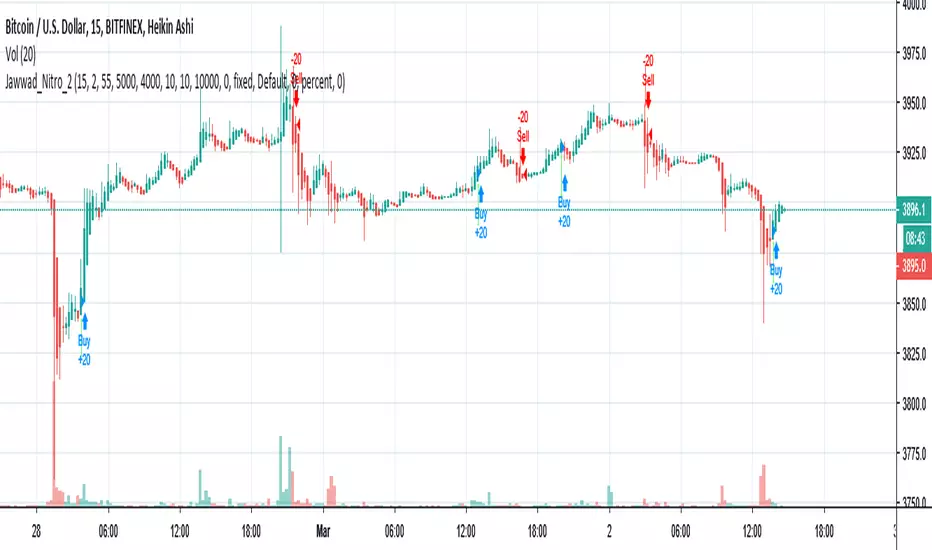
Jawwad Nitro_2 Crypto Forex Strategy - Highly ProfitableThis strategy is tested on selected crypto and forex pairs. It seems to be highly profitable and non-repainting. You can make some good money until you are following it properly and not playing with the settings.
1. Use 15 minute Heiken-ashi chart.
2. Apply the strategy.
3. Enjoy!!!
If this strategy works for you, please don't forget to buy me a cup of coffee... If you find anything wrong, please let me know. I shall be happy to fix it for you.
Cheers,
Jawwad
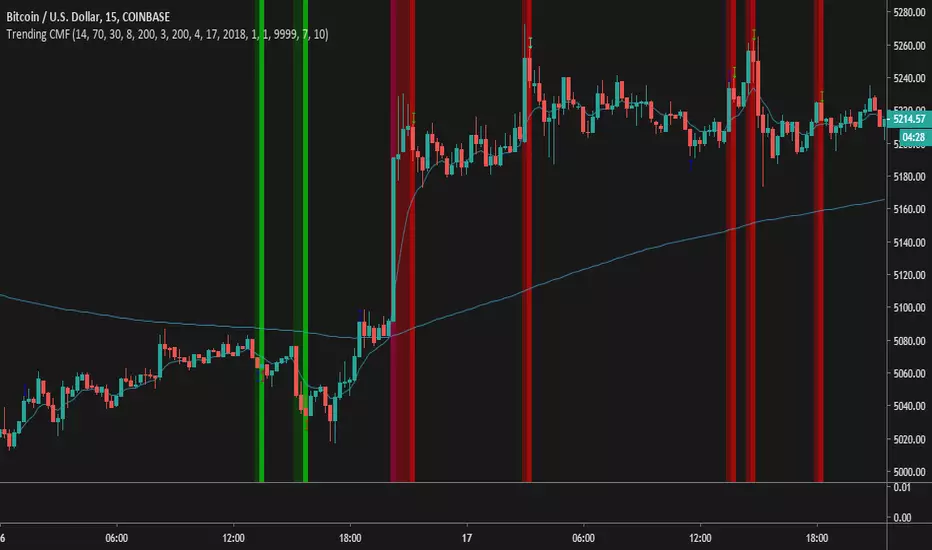
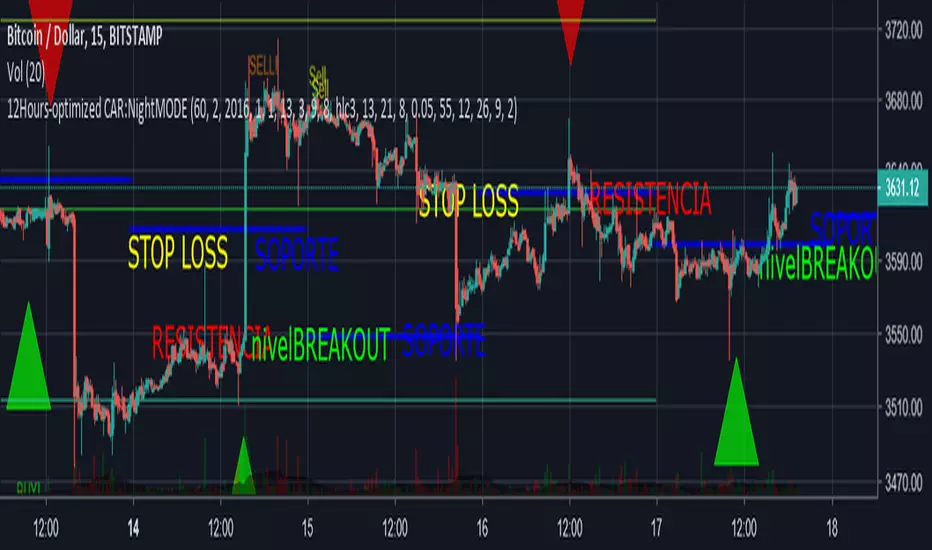
12Hours-optimized Crypto Alert ReloadedSame as 4H, but this time 12H.
In my opinion this one is way more accurate, let me know yours.
UPDATES:
I added Short Sell signals, both Red and Blue means "Short Sell", but they use different formulas. The blue one seems pretty solid, meanwhile the red one get more oportunities but might give an earlier entrance aswell.
Remember no software is 100% accurate, but this one seems at least >90% accurate so I guess that with a decent risk management and order placing you will make great profit.
The script gave1 bad short signal in whole 2018, and 4 bad buy signals, pretty decent on a market as cryptos, and at a correction phase.
Again, let me know your opinion, feedback, and critics.
Stay aware since I will update it for sure, I'm already working on it.
Soon:
*Filtering signal by candlestick patterns
*Pivot levels for resistance and support forecast beforehand.
*and more cool features ;)
Thanks again!
Cyatophilum Crypto Trader 1H [ALERTSETUP]A strategy specificaly engineered for trading altcoins.
Crypto pairs configurations already available: ADA/BTC, BNB/BTC, EOS/BTC, ETH/BTC, ICX/BTC, NEO/BTC, TRX/BTC, XLM/BTC, XMR/BTC, XRP/BTC.
This version allows to create automated alerts for buy and sell signals that can be used for manual or bot trading.
Note: You can use the backtest version for finding the best configuration for your pair if it isn't in the list. I will also be there to help you.
How it Works
The strategy is based upon two Exponential Moving Averages, it captures trend reversals, fakeouts, has a stop loss option and more (see the presentation page for input parameters description).
It should be used in 1 Hour timeframe and on any pair of cryptocurrency.
Backtest
The Net Profit (Gross profit - Gross loss) is calculated with a commission of 0.05% on each order.
Each trade is made with 100 % of equity
Get the indicator today!
Purchase on my website : blockchainfiesta.com

Cyatophilum Crypto Trader 1H [BACKTEST]A strategy specificaly engineered for trading altcoins.
Crypto pairs configurations already available: ADA/BTC, BNB/BTC, EOS/BTC, ETH/BTC, ICX/BTC, NEO/BTC, TRX/BTC, XLM/BTC, XMR/BTC, XRP/BTC.
Note: You can use this backtest version for finding the best configuration for your pair if it isn't in the list. I will also be there to help you.
How it Works
The strategy is based upon two Exponential Moving Averages, it captures trend reversals, fakeouts, has a stop loss option and more (see the presentation page for input parameters description).
It should be used in 1 Hour timeframe and on any pair of cryptocurrency.
Backtest
The Net Profit (Gross profit - Gross loss) is calculated with a commission of 0.05% on each order.
Each trade is made with 100 % of equity
Get the indicator today!
Purchase on my website : blockchainfiesta.com

Quantum all in one Crypto indicator V1Quantum all in one Crypto indicator V1
Features:
Bollinger
Ichimoku
6 EMA
6 MA + Fast & Slow
CDC Strategy
Fractals
Pivots
.. and more
V 1.5 in progress
enjoy
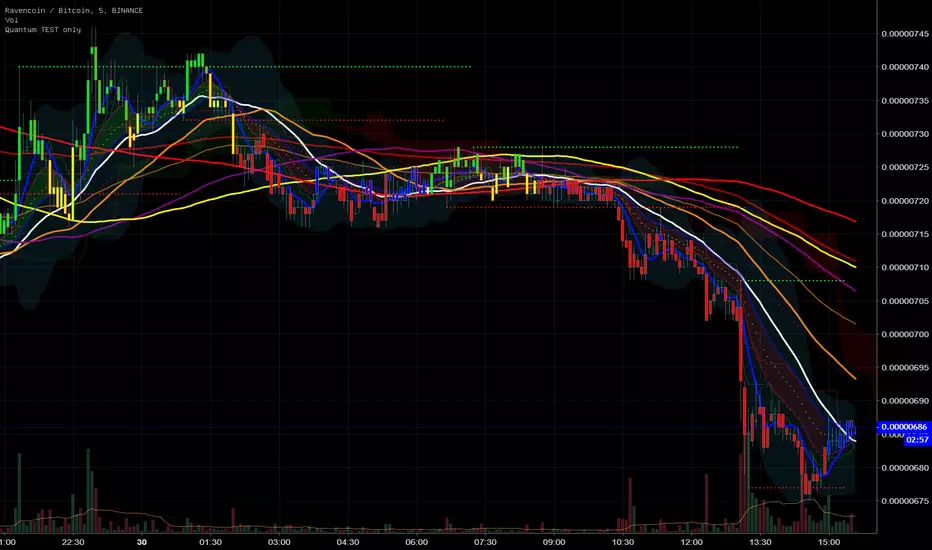
Quantum All in One Crypto Indicator V1Quantum All in One Crypto Indicator V1
Features
6 EMA
6 MA + Slow & Fast
Ichimoku
Bollinger
Fractals
CDC Strategy
Colored Bars
Pivot´s and more..
have fun
Version V1.5 in Progress
Free Log-Normal Bollinger Bands for CryptoBollinger Bands don't work on crypto currency, this is because crypto is so volatile it makes exponential growth a more obvious factor. Bollinger bands assume price will form a normal distribution around the mean which is WRONG, as prices increase in an exponential way, and the price will never fall below $0.
This is a bollinger band based around a log-normal distribution. Which is how prices actually behave.
Use this one instead. It's free.

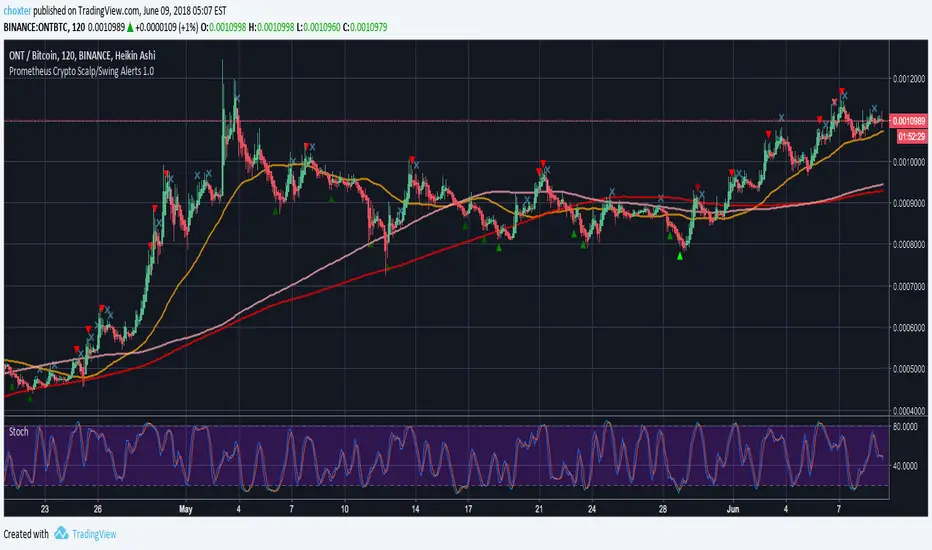
Prometheus Crypto Scalp/Swing Alerts 1.0Prometheus Crypto Scalp/Swing Alerts was built for scalp/swing crypto traders but you probably got that figured out by yourself. It offers high quality entries and exits which can be manually adjusted to suit your trading style. It performs great on any timeframe but scalp traders will love it for it’s ability to offer many entry points followed by quick exits, giving you opportunity to earn a few % within a few hours.
It has built in BUY/SELL alerts that can be connected to Autoview for automated trading.
How it works?
No drama, no complicated numbers - you only need to set the Alert strength indicator value (5-50) and according to that you will get the kind of alerts you like most. Choosing higher quality alerts will result in smaller quantity of those while picking out just the best entry and exit points and removing less interesting ones. You can always experiment and see what suits your trading style best.
Did we get your attention? If you wish to buy our script, shoot us a PM.
Ichimoku Cloud Strategy for Crypto V2.0Version 2.0
This updated strategy uses additional entry/exit rules based on trend.
This version will only enter short positions if the trend is bearish. While still agressive on bullish signals, it will close long positions earlier if it detects a false bull signal or keep them open should the trend continue to be bullish.
If you prefer a more aggressive strategy check out version 1.0
Do not run this strategy on a timeframe < 1h, best timeframe will be 4h.
Happy Trading!!
If you find this strategy useful, please consider a donation to:
BTC: 1PGuWcQwb4WZyFYX4ehyqcJWcbX42jW7Y6
ETH: 0x912aD30Ff9A49c69D51ECeE5A65A7E7d5321ED0C

PA Patterns Multi CRYPTOThis is the version for cryptocurrencies of my scanner for forex majors
The scope of this script is to work as a scanner of pin bars and engulfing candles of the crypto market.
Best to use with time frames Daily and 4h, lower timeframes gives too many results and may be noisy without trend filter.
Next improvement will be:
- To display in a better way the results, but actually you have to zoom in and out if some results are overlapping.
As the other one, this has alerts and trend filter.
If you like it, please leave a comment and follow me.
Thank you.

Protege Crypto IndicatorThis is my only indicator created for crypto for those who wanted it.
Created from PUI but with volatility/volume adaptative code.
Have fun!


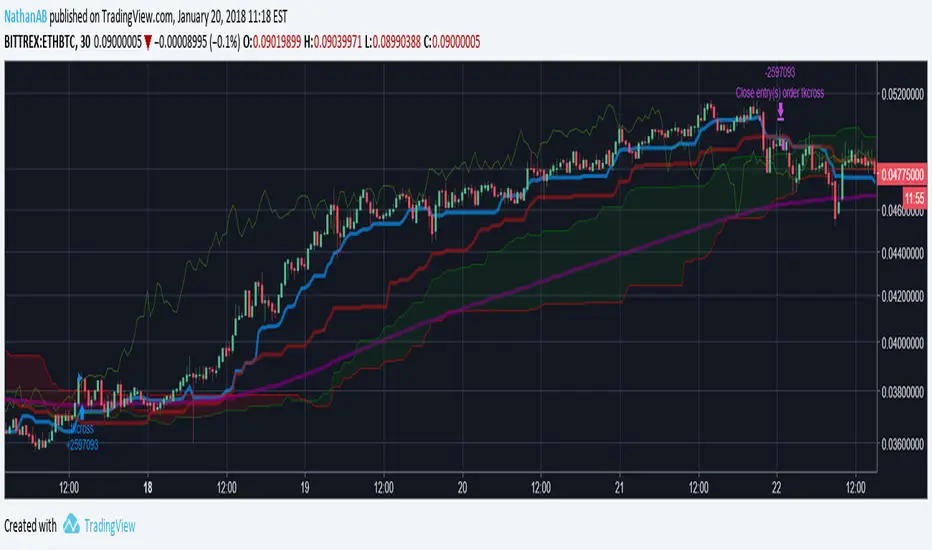
Ichimoku TK Cross > EMA200 Crypto StrategyIchimoku strategy for cryptocurrency trading.
Enters trades on bullish tenkan-kijun crosses when price is above 200 EMA which suggests a long-running bullish trend.
Khaos-Crypto-TraderThis indicator has been developed to trade crypto-currencies, but can also be used to trade forex, stocks, and futures.
This Indicator is a full trading system that offers setups with Entries, Targets and Stops. This indicator is very accurate because it uses advanced setup detection and filtering logic.
The setup is triggered if the price passes the blue dot. Do not enter the trade unless price passes the blue dot. Each setup has 3 possible targets, which are dots colored green for longs and red for shorts.
The initial stop is the green square for longs, or the red square for shorts.
You can use the base-line (which is the dark blue line with dots) to manage the trade. One strategy would be if you enter a trade long, and reach the first target, you can take some profits, but still let the some of the position run, where a bar closing below the blue line, would stop out your remaining position.
To summarize:
Blue Dot = Entry Trigger
Green Dots = Long Targets (3 of them, for different price targets: target 1, 2 and 3)
Green Square = Long Stop Price
Red Dots = Short Targets (3 of them, for different price targets: target 1, 2 and 3)
Red Square = Short Stop Price
The great thing about this indicator is that its universal, there are no settings necessary -- just put it on the chart and it finds high probability setups and paints it on the chart as they occur. There is NO Repainting with this indicator.
Of course, you can add other indicators if you wish, and even add this indicator to your existing trading system.
Again, this indicator does NOT repaint.
Once a setup is found, the indicator draws the targets and stop at the setup bar close.
Setup Alerts are fully supported, via email, sms, and desktop notification.
LEGAL STUFF:
Risk Disclosure
Futures , forex, stock, crypto and derivative trading contains substantial risk and is not for every investor. An investor could potentially lose all or more than the initial investment. Risk capital is money that can be lost without jeopardizing ones’ financial security or life style. Only risk capital should be used for trading and only those with sufficient risk capital should consider trading. Past performance is not necessarily indicative of future results
Hypothetical Performance Disclosure
Hypothetical performance results have many inherent limitations, some of which are described below. no representation is being made that any account will or is likely to achieve profits or losses similar to those shown; in fact, there are frequently sharp differences between hypothetical performance results and the actual results subsequently achieved by any particular trading program. One of the limitations of hypothetical performance results is that they are generally prepared with the benefit of hindsight. In addition, hypothetical trading does not involve financial risk, and no hypothetical trading record can completely account for the impact of financial risk of actual trading. for example, the ability to withstand losses or to adhere to a particular trading program in spite of trading losses are material points which can also adversely affect actual trading results. There are numerous other factors related to the markets in general or to the implementation of any specific trading program which cannot be fully accounted for in the preparation of hypothetical performance results and all which can adversely affect trading results

NG [Crypto Hype Meter]Highly configurable crypto market hype meter. Very simple to use.
Time to time update market circulation values from coinamrketcap.com
Essentially if you see green hype is high if you see red market is chaotic.
Additionally 2 ema for confidence.
Thanks @CryptoPredictions for idea

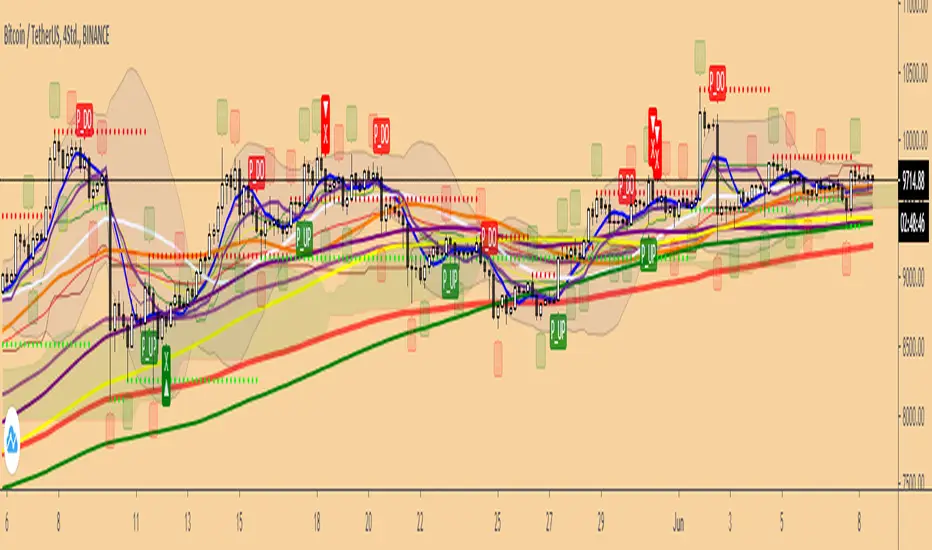
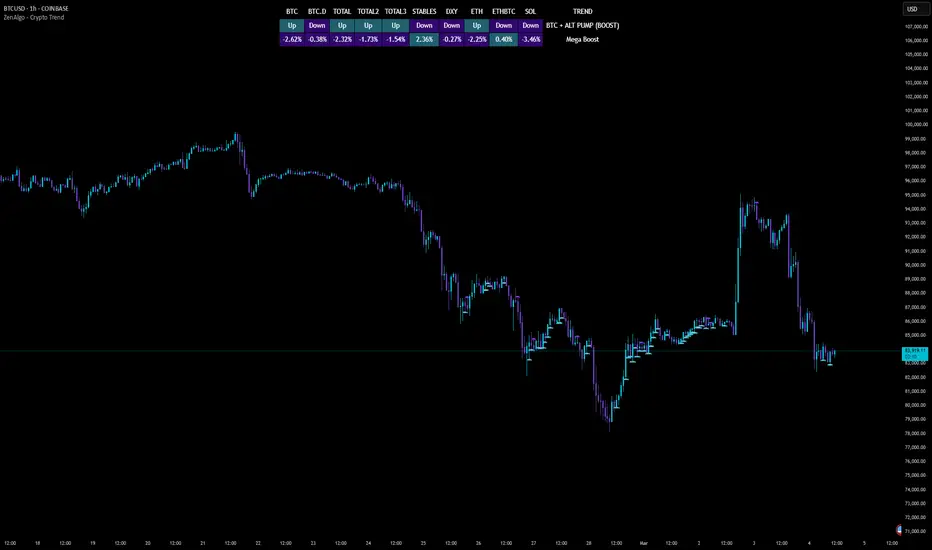
ZenAlgo - Crypto TrendThe ZenAlgo - Crypto Trend indicator is a unique tool for analyzing cryptocurrency market trends, combining data from multiple sources such as BTC , ETH , market caps, dominance metrics, and the DXY index . Unlike standalone indicators, it integrates these data points to deliver actionable insights on macro and micro market movements, helping traders better navigate complex market conditions.
Features
Multi-Asset Trend Analysis: Monitors trends across BTC , ETH , USDT dominance , DXY , SOL , ETHBTC and total market caps ( TOTAL , TOTAL2 , TOTAL3 ), providing a holistic market view.
Dynamic Labels: Real-time market conditions are summarized with labels such as "FIRE SELL," "BTC UP," or "ALT PUMP" for instant clarity.
Customizable Display: Options for dark mode, text size, and table position allow traders to personalize their experience.
Market Sentiment Table: Summarizes trends and percentage changes for multiple assets in a structured, easy-to-read table.
Composite Signals: Identifies unique states like "Mega Boost" or "Outflow" by analyzing the interplay of market trends.
Enhanced Heikin Ashi Analysis: Applies Heikin Ashi trends in a broader context, combining them with other metrics to overcome standalone limitations.
ZenAlgo Theme: A visually distinct and professional theme for enhanced usability.
Added Value: Why Is This Indicator Original/Why Shall You Pay for This Indicator?
The ZenAlgo - Crypto Trend indicator transcends the limitations of free tools in several ways:
Integrated Insights: While Heikin Ashi is freely available, this indicator applies it in tandem with market dominance, total market caps, and macroeconomic indicators like the DXY . This integration creates composite signals (e.g., "Mega Boost," "Defi Mega Boost") that standalone Heikin Ashi cannot provide.
Advanced Contextualization: Free Heikin Ashi indicators lack contextual data about dominance shifts, altcoin performance, and macroeconomic trends. Our indicator integrates these elements to give a broader market perspective.
Time-Saving: Instead of switching between multiple indicators, ZenAlgo - Crypto Trend combines them in one cohesive tool, offering a comprehensive market overview in a single glance.
Custom Features: Unlike generic Heikin Ashi indicators, this tool includes dynamic labels and a market sentiment table that summarize trends and provide immediate insights.
How It Works
1. Heikin Ashi Trend Detection
Calculates smoothed Heikin Ashi trends for BTC , ETH , USDT dominance , DXY , and total market caps ( TOTAL , TOTAL2 , TOTAL3 ).
Functionality: Heikin Ashi values are derived from the weighted average of open, high, low, and close prices. The "open" averages the previous bar's open and close, while the "close" averages the current bar's open, high, low, and close. A trend is assigned as Up (+1) or Down (-1) based on whether the close exceeds the open.
2. Market Metrics Analysis
Tracks daily percentage changes and trends for key metrics like BTC dominance and total market caps.
Outputs: Displays trends (Up/Down) and percentage changes for each asset, helping assess market strength and sentiment.
3. Composite Signal Generation
Combines individual asset trends to define broader market states such as "Mega Boost" or "Outflow."
Logic: Signals are triggered by predefined conditions, e.g., "Mega Boost" occurs when DXY trends down, market caps ( TOTAL , TOTAL2 , TOTAL3 ) trend up, and BTC dominance trends down.
4. Dynamic Labels and Sentiment Table
Displays real-time labels (e.g., "FIRE SELL," "BTC + ALT PUMP") directly on the chart for actionable insights.
A market sentiment table summarizes trends and percentage changes, with customizable display options (position, text size, theme).
Usage Examples
Spotting Bullish Momentum: Use "BTC + ALT PUMP" signals to identify synchronized bullish trends in BTC and altcoins.
Avoiding Bearish Trends: React to "CRYPTO DOWN" or "FIRE SELL" signals to minimize exposure during downturns.
Evaluating Altcoin Opportunities: Identify "ALT PUMP" or "ALTS DUMP" signals to time entries and exits in altcoin markets.
Tracking Dominance Shifts: Monitor "BTC.D UP" or "BTC.D DOWN" trends to assess shifts in market dominance between BTC and altcoins.
Macro Market Awareness: Use "Mega Boost" or "Mega Outflow" states to align with macroeconomic trends, such as dollar strength or weakness.
Seasonal Trends: Observe "ETH PUMP" or "BTC DOWN + ALT PUMP" states to understand specific altcoin or BTC-led market cycles.
Settings
ZenAlgo Theme: Enable a custom ZenAlgo visual style for improved clarity.
Table Text Size: Adjust text size (options: tiny, small, normal, large, huge) for better visibility.
Dark Mode: Toggle dark mode for improved viewing in low-light environments.
Table Position: Choose table placement (e.g., Top Left, Bottom Center) based on your preferences.
Important Notes
Synthetic and Lagging Nature of Heikin Ashi: Heikin Ashi values are synthetic and inherently lagging. They provide smoothed trends but do not represent precise entry or exit points. This indicator does not produce buy or sell signals.
Limitations in Low-Volume Markets: The indicator may underperform in low-liquidity markets or during periods of high volatility, where data discrepancies can distort trends.
Trend Reversals in Choppy Markets: In sideways or choppy markets, the composite signals may lag behind sudden reversals, potentially resulting in delayed recognition of trend changes.
False Positives During Macro News Events: Abrupt macroeconomic news or policy changes can cause the indicator to emit signals (e.g., "Mega Boost") that may not align with sustained market movements.
Dominance Metrics Sensitivity: Heavy reliance on BTC.D or TOTAL3 can sometimes result in misleading insights when these metrics are influenced by atypical events, such as large-scale liquidations or isolated token movements.
Use in Conjunction with Other Tools: While powerful, this indicator should be combined with other technical and fundamental analysis tools for a comprehensive trading strategy.
No Guaranteed Results: Trading involves risk. This tool is designed to support decision-making, not to guarantee trading success.
Crypto Breakout Alert DEMOThe indicator plots breakout events of user-defined assets list, providing alert setting for breakout events.
Any big trend begins with a couple of price breakouts. By watching breakout events, we overlook the panorama of the whole market.
Version: DEMO
---------- Features --------------
User-Defined Crypto / or any Asset List, Up To 30 Assets, Demo has some limit
User-Defined Breakout Threshold
Accessible for wide timeframes: 5s - 1 Month, Demo has some limit
Plot the Breakouts History of whole market
Progressive color according to the strength of the breakthrough
--------- Indicator Settings -----------
"Show Bull or Bear?": To show Bull Breakout, Bear Breakout or Both
"User-Defined Breakout Threshold": User can defined the threshold of breakout, default value 999 means using default set up, as following - "Default Breakout Threshold"
"A rate to decrease Bitcoin Threshold": Bitcoin has much lower volatility than other coins, so this rate is usded to lower the threshold for Bitcoin , defval = 0.5
"Use Green for Bull? ": Toggle color for Bull, defval: true, if your region use red for bull, toggle it.
"Exchange": Your exchange name, which is used to defined tickerid, defval="BINANCE", optional - can be empty
"Asset PostFix": postfix of your asset symbol, which is used to define tickerid, defval="USDTP", change it if necessary, this can not be empty.
"Toggle Notice Label": close or open the notice label
--------- Default Breakout Threshold For Popular Timeframes-------------
5s 0.5%
15s 0.75%
30s 0.9%
1m 1.2%
2m 1.4%
3m 1.6%
5m 1.8%
8m 2%
15m 3%
20m 3.5%
30m 4%
60m 5%
120m 6.5%
240m 8%
480m 10%
1D 12%
1W 20%
---------- Versions Description ----------
The features may change later without advance notice.
DEMO version has basic features.
---------- Access to Indicators ----------
Contact the author by Private Chat for access to Invite-Only versions and a trial.
---------- Install Invite Only Version----------
Open the chart -> Add Indicators (On the Top or press /) -> Invite-Only Scripts (last button of the left bar)
Like/Favorite the indicator
Click to install on the chart
---------- About Loading Time ----------
It may take up to 1-3 minutes for your browser to load a new setting, depending on the your computer and network speed. For convenience, you can keep related pages open continuously.
---------- FAQ -----------
1. Why can't I see older breakout labels?
Due to system limit, 500 is the maximum of labels.
In order to see older breakout events, please Select Bull or Bear, instead of Both; Or Increase to filter weak breakouts.
2. How to watch more than 30 coins?
Due to system limit, 30 assets is the maximum.
In order to watch more assets, user can open the indicator in another chart, add your 2nd assets list, save 2nd layout, set alerts for different lists respectively.
---------- Disclaimer ----------
By using or requesting access to the indicator, you acknowledge that you have read and accepted that the indicator and any related content, including but not limited to: user manual, tutorials, ideas, videos, chats, emails, blog, are for the purpose of trading strategies studying and paper trading.
If a customer or user uses the indicator or related content mentioned above for live trading or investment, she/he should take all risks and responsibility of her/his own trading and investment activities.
---------- Updates ----------
The latest updates override the previous description.
To activate a update: Close the browser, Reopen the chart and apply the indicator.
【加密货币突破预警】指标绘制一系列资产的突破事件,提供突破预警
任何大趋势都开始于一系列的价格突破。通过监控突破事件,可以俯瞰市場的運動
版本 DEMO
---------- 产品特征------------
用户自定义的加密货币品种列表,或者其他资产列表,多达30个品种, DEMO 有限品种
用户自定义的突破门槛
适用于宽泛的时间维度:5秒--1月, DEMO 有限制
绘制整个市场的突破历史
漸進顏色 根據突破的力度
------------- 指标设置说明 -------------------
"展示牛熊突破?": 展示牛突破,熊突破或者两者
“用户自定义突破门槛”: 自己定义突破门槛,999代表默认的设置,详见下方“默认的突破门槛”
"比特币突破门槛修正": 比特币的波动性远远低于其他加密货币,这个比率用来调低比特币的门槛
"切换通知标签": 用来开关通知标签
"綠色為牛?": 切換標籤顏色,默認綠色為牛
“交易所”:用来定义资产名称,可以为空
“资产后缀”: 用来定义资产名称,不可以为空
---------默認的突破門檻-------------
5s 0.5%
15s 0.75%
30s 0.9%
1m 1.2%
2m 1.4%
3m 1.6%
5m 1.8%
8m 2%
15m 3%
20m 3.5%
30m 4%
60m 5%
120m 6.5%
240m 8%
480m 10%
1D 12%
1W 20%
---------- 版本描述 ----------------
產品特徵後續可能變化,恕不事先通知
DEMO版本供試用
----------- 獲取指標使用權 ------------
通過私信聯繫作者,要求訂閱或試用
----------- 安裝指標 -----------------
加指標 -》 Invite-Only (左邊欄目)
點贊或者收藏指標
點擊安裝指標
----------- 關於載入時間 ---------------
可能需要1--3分鐘來完成載入,取決於用戶的電腦和網絡速度,方便起見可以保持相關頁面持續開啟
------- FAQ ----------
1. 如何查看更早的突破歷史
由於系統限制,500 個標籤是上限
為了查看更早的突破,請選擇牛或者熊,而不是兩者;或者提高"用戶自定義突破門檻" 來過濾掉弱突破
2. 如何監控更多資產?
由於系統限制,30個資產是上限
為了監控更多資產,可以在第二個圖表加載指標,保存圖表,分別在不同的圖表設置突破預警
---------- 免責聲明 ----------
在要求獲得本指標使用權之前以及在使用本指標之前,用戶認可已經完全了解和接受:本指標僅供學習交流目的, 它不構成任何交易建議或者投資建議。用戶如果將指標用於其他用途,應自行承擔所有風險和責任。
本指標的開發者並非專業投資顧問,因此不對用戶的任何行为負責。
最近的更新會覆蓋之前的說明。請參閱更新來查看指標的新特徵和功能。
