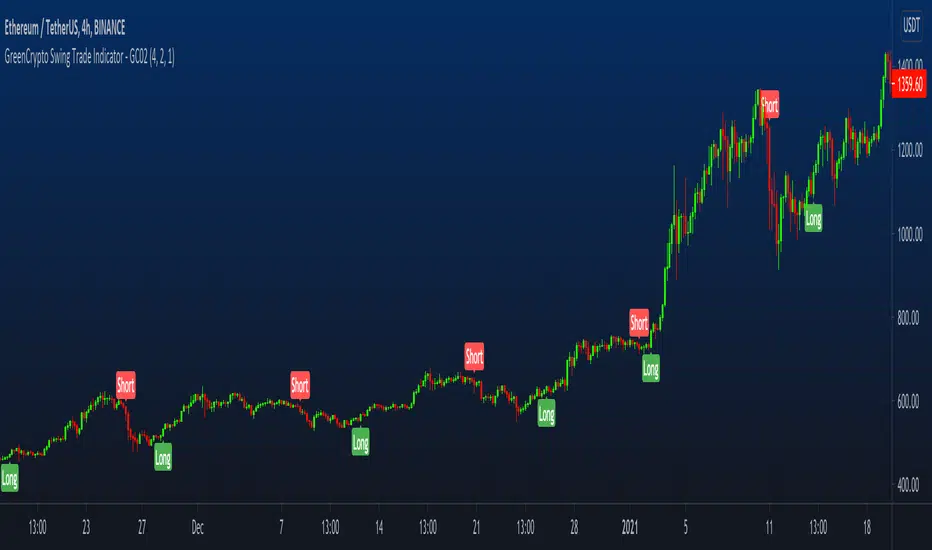
GreenCrypto Swing Trade Indicator - GC02Overview: This is a swing trading Indictor works using support & resistance and market trend, it is designed for all type of markets (crypto, forex, stock etc.) and works on all commonly used timeframes (preferably on 1H, 4H Candles).
How it works:
Core logic behind this indicator is to finding the Support and Resistance, we find the Lower High (LH) and Higher Low (HL) to find the from where the price reversed(bounced back) and also we use a custom logic for figuring out the peak price in the last few candles (based on the input "Strength" ). Based on the multiple previous Support and Resistance (HH, HL, LL LH) we calculate a price level, this price level is used a major a factor for entering the trade. Once we have the price level we check if the current price crosses that price level, if it crossed then we consider that as a long/short entry (based on whether it crosses resistance or support line that we calculated). Once we have pre long/short signals we further filter it based on the market trend to prevent too early/late signals, this trend is calculated based on the value from the input field "Factor". Along with this if we don't see a clear trend we do the filtering by checking how many support or resistance level the price has bounced off.
Stop Loss and Take Profit : We have also added printing SL and TP levels on the chart to make the it easier for everyone to find the SL/TP values. Script calculates the SL value by checking the previous support level for LONG trade and previous resistance level for SHORT trades. Take profit are calculated in 1:1 ratio as of now.
Available Inputs:
Strength : Define the strength of the support resistance that we calculate. The lower value means less number of candles used for calculating the support & resistance and vice versa
Factor : Specify what level of trend to use. Using higher value will result script looking using the larger trend (zoomed out trend) and using lesser value will result in using the short trends
Note: For most of the charts you don’t need to change the default values. However, feel free to try it out.
How to use:
Add the script to the chart and once the indicator is load it will display the "long" and "short" entry points along with the stopLoss and takeProfit points.
How to get access:
Send a DM to us for getting access to the script.
Cari skrip untuk "crypto"
Momentum Strategy for cryptos (V7.B.4)Here's a strategy for low time frames (30min suggested) for BTC, based on momentum Analysis using Stochastic RSI
By default the strategy will use the 50% of the specified capital for each trade; if "Gamble Sizing" is enabled, it will add the specified amount of capital (25% by default, until reaching the 100% limit or lower) for the next trade after having detected a loss in the previous trade; if the next trade is successful, the size for the next trade comes back to 50%
• Trend Filter LONG: If the fast exponential moving average is UNDER the slow exponential moving average, it won't open LONG positions
• Trend Filter SHORT: If the fast exponential moving average is ABOVE the slow exponential moving average, it won't open SHORT positions
• Bars delay: the strategy will wait the specified amount of bars before closing the current position; the counter is triggered as soon as the closing trade condition is verified
BY MAKING USE OF THIS STRATEGY, YOU ACKNOWLEDGE AND AGREE THAT: (1) YOU ARE AWARE OF THE RISKS ASSOCIATED WITH TRANSACTIONS OF DIGITAL CURRENCIES AND THEIR DERIVATIVES; (2) YOU SHALL ASSUME ALL RISKS RELATED TO THE USE OF THIS STRATEGY AND TRANSACTIONS OF DIGITAL CURRENCIES AND THEIR DERIVATIVES; AND (3) I SHALL NOT BE LIABLE FOR ANY SUCH RISKS OR ADVERSE OUTCOMES.

Profits Unlimited Pro Strategy** This is the backtesting (strategy) version of ~ Profits Unlimited Pro ~ proprietary script in TradingView. **
~ Profits Unlimited Pro Strategy ~
֎ Trading system script on tradingview that brings an easy approach to trading with a high profitability rate
֎ Our proprietary formula was developed over the course of the past two years through a combination of trial and error and algorithmic backtesting.
-- HOW IT WORKS --
֎ The algorithm starts with a proprietary script combining custom inputs with a formula that works with custom bollinger bands settings and specific RSI levels to results in deadly accurate signals for long and short entry points.
but that's not all...
֎ When we first developed our formula, we noticed that it produced a lot of accurate signals but also didn't fully understand the dynamics of market momentum and trending directions...
...so there were a lot of needless calls being made that were reducing profitability.
You see, most markets spend roughly 80% of the time trading sideways with no significant trend either up or down...
...And trading these sideways markets commonly result in what's called a "whipsaw"...
A whipsaw is when price is moving in one direction but then quickly pivots to move in the opposite direction resulting in a loss. And nobody wants to be stuck trading in a sideways market getting killed by whipsaws all day...
So what did we do to fix this?...
-- THE WINNING FORMULA --
֎ We added the Average Directional Index into our custom formula with a goal of teaching the algorithm to only trade during periods of strong momentum and trends whether up or down.
֎ We also added trend exhaustion levels to give clear indication for exit signals and help determine best times of getting out of a trade.
֎ Trend Exhaustion Levels work in conjunction with trailing stop loss % and both are customizable for ideal exits and profitability.
֎ The results are mind blowing!
-- WHO IT'S FOR --
֎ Optimized for crypto markets, to catch trend movements as soon as possible and maximize profitability
֎ It's A Swing Traders Dream.
-- What You Get --
֎ Sell & Buy alerts, Stop Loss alerts and always adding new features!
֎ Customizable settings.
֎ Chrome Extension in development for fine-tuning settings automatically(COMING SOON)
-You will be able to select an asset. push a button. and the extension will find the best settings for you!
֎ Users Facebook community for learning, sharing and direct support
If you’d like to test the trading script in TradingView, I can give you access to a 10 days trial.
Please send me PM in tradingview and I’ll activate it right away.
Thank you!
Ichimoku Cloud ForecastUsing doubled crypto settings, forecast Tenkan and Kijun lines, assuming price remains neutral (constant).
Tenkan - 14 periods
Kijun - 20 periods

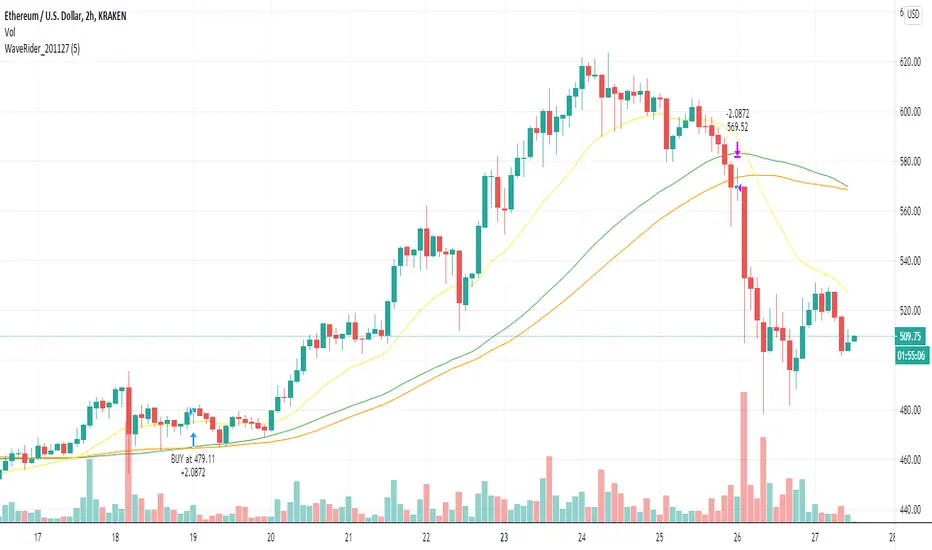
The WaveRider - Help me to exit position!Hello,
I always like to refer to my previous articles to allow people to understand where am I in terms of knowledge at the time when I write this article.
BTC and ETH Long strategy version 1
BTC and ETH Long strategy version 2
Although some part of my crypto trading is automated via HaasOnline software, I like to take discretionary trades to feel the excitement of manual trading, especially during bull market :).
I write this new article and script because I did struggle to decide when to exit a recent LONG position on Ethereum.
Most of the novice traders struggles to know when to exit the position when gains are made.
The is exactly what happens to many people trading cryptos in the beginning of this bull market.
We always want more, we want to ride the wave as much as possible.
We see the gains growing every day and don't want to exist the position because tomorrow will bring more gains.
Yes, but sometimes there is a small retracement, the price is bleeding slowly but we want to hold because the price will move UP again in one of two days.
So the big question is went to exit (or not).
This subject is a difficult one because we are humans and highly influenced by our psychology.
Depending on the mood we are in, we can take different decisions.
If we are not feeling good and we are not in good mood, we will probably close a winning position as soon as a retracement comes in to keep our gains because we see this retracement as something bad.
On the other side, if we feel good and are in a good mood that day, we might take to opposition decision and keep the trade running as we believe that this retracement is something healthy for the price to allow it to continue to move up.
For novice traders, these emotions can impact the way how we trade and create frustrations if we exit a position too soon or too late.
So, why not to let a script giving us advices on this decision? If we are not sure if we should exit or not, this script might help us to take a better decision.
I have named this script the "WaveRider" because it is supposed to be used during bull market only when the asset is moving up.
Best time frame to use with crypto such as Bitcoin and Ethereum are 2H, 4H and 6H candles.
Even if it can also give you entry points to open a trade, the goal of this script is more to give you exit points.
So, if you have opened a trade manually and you are wondering if this is the right time to close it, this script is made for you.
Technically, entry points are based on 2 Moving averages (slow and fast). We can enter in position when crossing over.
The Position can be closed if the same Moving averages are crossing down. In addition, it will exit if the price suddenly drops below the Moving average.
I know it sounds simple and stupid, but sometimes we don't ask ourselves the right questions when taking the decision to exit a position. So, this script will remind you the basic stuff to consider before closing your position.
I hope that such idea will help you to take good exit decisions in the future.
Let me know if you need more details or want to access it.

BTC and ETH Long strategy - version 2I wrote my first article in May 2020. See below
BTC and ETH Long strategy - version1
After 6 months, it is now time to check the result of my script for the last 6 months.
XBTUSD (4H): 14/05/2020 --> 22/11/2020 = +78% in 4 trades
ETHXBT (4H): 14/05/2020 --> 22/11/2020 = +21% in 9 trades
ETHUSD (4H): 14/05/2020 --> 22/11/2020 = +90% in 6 trades
Using the signals from this strategy to trade manually has shown that this was a bit frustrating because of the low rate of winning trades.
If you have to enter 100 trades and see 75% of them failing and 25% winning, this is frustrating. For sure the strategy makes good money but it is difficult to hold this mentality.
So, I have reviewed and modified it to get a higher winning rate.
After few days of work, tests and validation, I managed to get a wining rate close to 60%.
The key element was also to decrease the number of trades by using a higher time frame. (4H candles instead of 2H candles).
- Entry in position is based on
MACD, EMA (20), SMA (100), SMA (200) moving up
AND EMA (20) > SMA (100)
AND SMA (100) > SMA (200)
- Exit the position if: Stoploss is reached OR EMA (20) crossUnder SMA (100)
The goal of this new script is to be able to follow the signals manually and only make few trades per years.
I have also validated it against some other altcoins where some are giving very good results.
Here are some results for 2020 (from 01/01/2020 until now (22/11/2020). Those results are the one I get when using 4H candles.
ETH/USD: +144% in 8 trades.
BTC/USD: +120% in 7 trades.
ETH/BTC: +33% in 9 trades.
ICX/USD: +123% in 10 trades.
LINK/USD: +155% in 11 trades.
MLN/USD: +388% in 8 trades.
ADA/USD: +180% in 7 trades.
LINK/BTC: +97% in 10 trades.
The best is that above results are without considering compound effect. If you re-invest all gains done in each new trade, this will give you the below results :)
ETH/USD: +189% in 8 trades.
BTC/USD: +260% in 7 trades.
ETH/BTC: +29% in 9 trades.
ICX/USD: +112% in 10 trades.
LINK/USD: +222% in 11 trades.
MLN/USD: +793% in 8 trades.
ADA/USD: +319% in 7 trades.
LINK/BTC: +103% in 10 trades.
As you can see, the results are good and the number of trades for 11 months is not big, which allows the trader to place orders manually.
But still, I'm lazy :), so, I have also coded this strategy in HaasScript language which allows you to automate this strategy using the HaasOnline software specialized in automated crypto trading.
I hope that this strategy will give you ideas or will be the starting point for your own strategy.
Let me know if you need more details.

Buy/Sell ZonesEN:
This indicator is made to display main buy/sell zones of an asset. The core parameters are: Price, Volume and Donchian Channels.
It is more trend-based and may be suitable for swing traders or those who trade higher timeframes (1D and above).
The plotted colors display the dominance of buyers, sellers or indecision on the market at the current timeframe.
If the zone is green - consider opening Long/Buy positions.
If the zone is red - consider opening Short/Sell or scale out your position.
The white zone displays indecision between Bulls and Bears - consider not to take any trades within white zone.
RU:
Этот индикатор показывает зоны покупателя/продавца выбранного актива. Основные параметры расчета: Цена, Объем и Каналы Дончиана.
Он является индикатором трендового анализа и больше подходит для свинг-трейдеров или тех, кто торгует на старших таймфреймах (от 1Д).
Отображаемые цвета показывают доминацию продавца, покупателя или неопределенность на рынке в конкретный временной период.
Зеленая зона указывает на преобладание покупателя - возможно открытие длинных позиций/покупок .
Красная зона указывает на преобладание продавца - потенциальный момент для открытия коротких позиций/продаж или сокращения своих длинных позиций/покупок .
Белая зона указывает на неопределенность на рынке - в этой зоне лучше не предпринимать никаких торговых решений .
EN: This indicator may be used for Crypto markets
RU: Этот индикатор можно использовать для криптовалютных рынков
BITSTAMP:BTCUSD
BITSTAMP:ETHUSD
COINBASE:COMPUSD
EN: Stocks, CFD and commodities
RU: Акций, CFD и рынков сырьевых товаров
FOREXCOM:SPXUSD
NASDAQ:TSLA
NYSE:BA
NASDAQ:EBAY
FOREXCOM:XAUUSD
EN: Consider using it with respect to Your trading style, money- and risk-management as well as other indicators
RU: Используйте этот индикатор в соответствии со своим стилем торговли, риск-, мани-менеджментом и другими индикаторами.

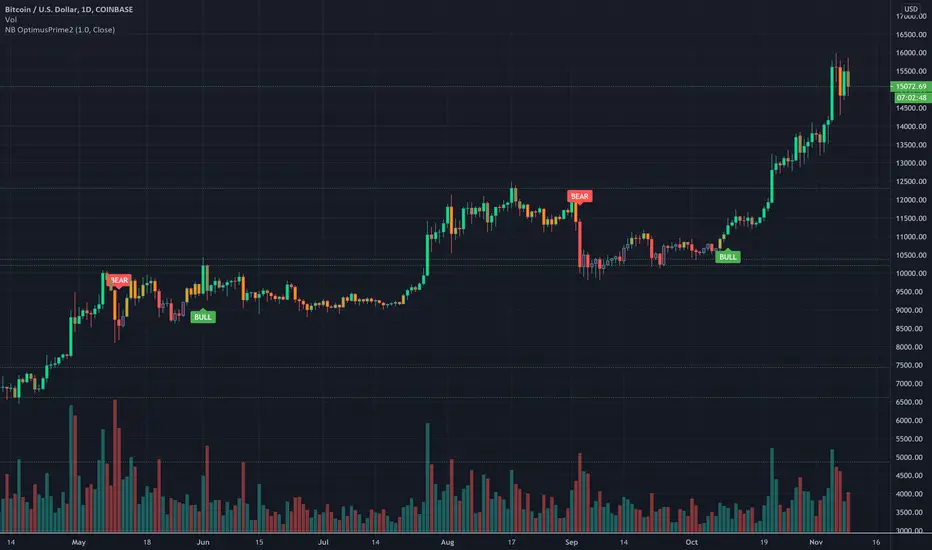
NB OptimusPrime2Hello Everyone,
Welcome to NB Optimus Prime 2.
This is an educational indicator that makes two colorful calls in your chart thus :
Red = Bear
Green = Bull
The calls are meant to indicate potential downtrends and uptrends respectively.
The signals are made based on aggregated Index prices and moving averages which are then smoothened out. Volume is used to gage momentum of the trend which is then shown by colors on the candle stick. This indicator is best used in combination with other traditional indicators i.e MACD , RSI and other tools that are available on TradingView.
Even though this indicator was designed with Cryptocurrency in mind, it can also be used for Stocks and Forex. I created this for my crypto community as a way to introduce them to trading with indicators.
It should be noted that this indicator should not be considered financial advice in any way or form. This is just an indicator. Please use it responsibly.
PM me to obtain access to this indicator and I will be happy to help you.
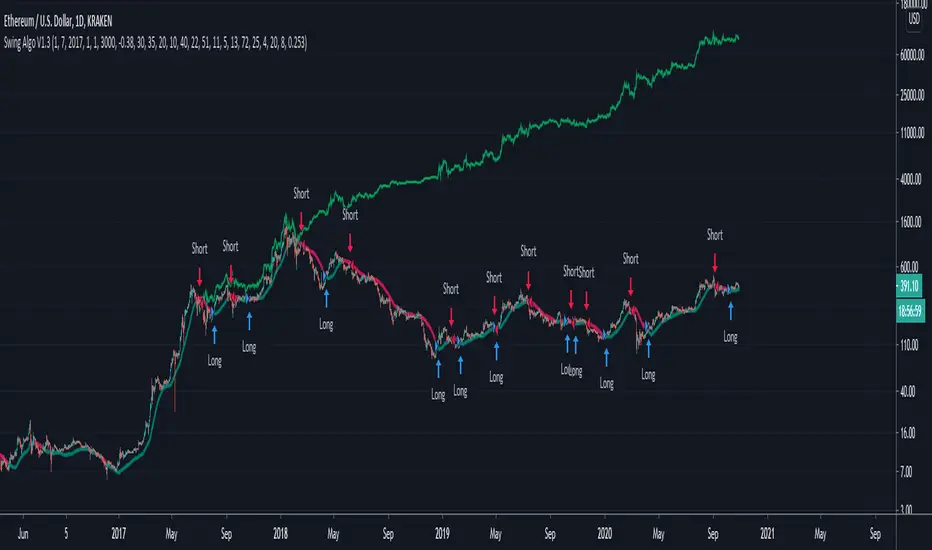
Swing Algo V1.3An upgrade of Swing Algo V1.2 to reduce chop heavily, used for trading ETH. For differences to other versions, see below.
This indicator can be used for e.g. swing algorithmic trading. It will give Buy/Long and Sell/Short signals on the chart. This algorithm uses a combination of several (custom) functions and rules to find good entry points for trend trading. After many iterations and tests I came up with this particular setup, which is highly optimized for the ETH/USD trading pair on the daily (D) timeframe. Attention was also paid to stability, as all parameters are set onto plateaus, so that smaller changes in the characteristic price action should not affect the efficiancy too much. For other assets and/or timeframes it is however possible to change algorithmic parameters within the indicator settings to tune this swing algorithm. You don't need any programming skills or similar abilities to navigate this indicator.
For the here presented backtest data, we omitted the biggest portion of the cryptocurrency bullrun in 2017 (starting only at 1st July 2017) so that the results become more realistic for long-term swing traders (investing at least 2-3 years into trading) if such large runs do not happen again. As cryptocurrencies like Ethereum are still to this date capable of doing comparatively smaller runs of about 2-3x in a few weeks/months (as witnessed in 2020), the order of magnitude of the shown results is still realistic for long-term trend trading efforts. Do not expect these results in a matter of days or weeks, and of course as with any trading strategy past performances are not indicative of future results.
Within this indicator you can choose the backtest time interval to test the perfomance of this algorithm for different time windows and different trading pairs. Here various backtesting parameters (e.g. trading fees) can be customized. Default settings for the shown backtest are a starting balance of $1000, a slippage of 2 ticks (= $0.02) and a trading fee of 0.26 % (which is the worst taker fee on the Kraken exchange) to have realistic settings. However as we do not conduct many trades with this strategy, fees should not impact our performance too much. As long-term swing traders, we devote one initial portion of our portfolio to swing trading and from then on always use 100% of this portion for the next trade to get the compounding starting. This is in difference to other trading styles which use various, often very small, percentage values for their short- or mid-term trades. Keep this in mind when evaluating the backtest data. Also note that due to the small number of trades the statistical significance is low. It is not possible to gather an abundance of long-term trend signals in the order of hundreds or thousands trades, as much more time would have to pass for this in the case of rather new assets like Ethereum.
Additionally to the TradingView Strategy Tester you can also plot your equity directly on the chart to get a sense for the performance. For this you can also scale the equity graph to e.g. match the starting point of your equity with some price point on the chart to get a direct comparison to 'Buy & Hold' strategies over time.
This indicator (and all other content I provide) is no financial advice. If you use this indicator you agree to my Terms and Conditions which can be found on my Twitter profile linked on my TradingView profile or in my signature.
Differences to other versions:
- Changed from a dual (V1, V1.1) to a single smoothing function system (V1.2, V1.3), which can react better to more sudden price movements that got prevalent during the current end-phase of the stock bullmarket due to correlations, while still handling 'normal' price action well
- Changed the oscillator part of the algorithm again with one that handles chop for the ETH/USD trading pair extremely well.
- Improved net profits by potentially +100% in comparison to V1 for ETH/USD on daily timeframe
- However for other assets (e.g. BTC and smaller coins like XTZ and ALGO) and timeframes V1 might perform better than V1.3 due to somewhat different characteristic price action. I leave you with all options to play so that you can find the best solution for a given trading pair.
- There's also a previous version called Swing Algo V1.2 considered the go-to algo at the moment, which works similar to V1.3, but operates a bit less tight, leading to more flexibility while suppressing chop not as much as V1.3.
For access please contact me via DM on TradingView or on Twitter (linked on my TradingView profile and my signature). People who purchased access to any 'Swing Algo 1.x' get access to all other 'Swing Algo V1.x' indicators automatically ('Swing Algo V1' counts as 'Swing Algo V1.0').
Swing Algo V1.2The next upgrade in the 'Swing Algo V1.x' series, and the go-to algorithm for trading ETH (until further notice). For differences to other versions, see below.
This indicator can be used for e.g. swing algorithmic trading. It will give Buy/Long and Sell/Short signals on the chart. This algorithm uses a combination of several (custom) functions and rules to find good entry points for trend trading. After many iterations and tests I came up with this particular setup, which is highly optimized for the ETH/USD trading pair on the daily (D) timeframe. Attention was also paid to stability, as all parameters are set onto plateaus, so that smaller changes in the characteristic price action should not affect the efficiancy too much. For other assets and/or timeframes it is however possible to change algorithmic parameters within the indicator settings to tune this swing algorithm. You don't need any programming skills or similar abilities to navigate this indicator.
For the here presented backtest data, we omitted the biggest portion of the cryptocurrency bullrun in 2017 (starting only at 1st July 2017) so that the results become more realistic for long-term swing traders (investing at least 2-3 years into trading) if such large runs do not happen again. As cryptocurrencies like Ethereum are still to this date capable of doing comparatively smaller runs of about 2-3x in a few weeks/months (as witnessed in 2020), the order of magnitude of the shown results is still realistic for long-term trend trading efforts. Do not expect these results in a matter of days or weeks, and of course as with any trading strategy past performances are not indicative of future results.
Within this indicator you can choose the backtest time interval to test the perfomance of this algorithm for different time windows and different trading pairs. Here various backtesting parameters (e.g. trading fees) can be customized. Default settings for the shown backtest are a starting balance of $1000, a slippage of 2 ticks (= $0.02) and a trading fee of 0.26 % (which is the worst taker fee on the Kraken exchange) to have realistic settings. However as we do not conduct many trades with this strategy, fees should not impact our performance too much. As long-term swing traders, we devote one initial portion of our portfolio to swing trading and from then on always use 100% of this portion for the next trade to get the compounding starting. This is in difference to other trading styles which use various, often very small, percentage values for their short- or mid-term trades. Keep this in mind when evaluating the backtest data. Also note that due to the small number of trades the statistical significance is low. It is not possible to gather an abundance of long-term trend signals in the order of hundreds or thousands trades, as much more time would have to pass for this in the case of rather new assets like Ethereum.
Additionally to the TradingView Strategy Tester you can also plot your equity directly on the chart to get a sense for the performance. For this you can also scale the equity graph to e.g. match the starting point of your equity with some price point on the chart to get a direct comparison to 'Buy & Hold' strategies over time.
This indicator (and all other content I provide) is no financial advice. If you use this indicator you agree to my Terms and Conditions which can be found on my Twitter profile linked on my TradingView profile or in my signature.
Differences to other versions:
- Changed from a dual (V1, V1.1) to a single smoothing function system (V1.2, V1.3), which can react better to more sudden price movements that got prevalent during the current end-phase of the stock bullmarket due to correlations, while still handling 'normal' price action well
- Changed the oscillator part of the algorithm with a better suited one (at least) for the ETH/USD trading pair, handling chop better.
- Improved net profits by potentially +100% in comparison to V1 for ETH/USD on daily timeframe
- However for other assets (e.g. BTC and smaller coins like XTZ and ALGO) and timeframes V1 might perform better than V1.2 due to somewhat different characteristic price action. I leave you with all options to play so that you can find the best solution for a given trading pair.
- There's also an upgrade called Swing Algo V1.3, which works similar to V1.2, but reduces losses due to chop even further. Because V1.2 is a bit more flexible, it is, however, considered the go-to algo for the time being.
For access please contact me via DM on TradingView or on Twitter (linked on my TradingView profile and my signature). People who purchased access to any 'Swing Algo 1.x' get access to all other 'Swing Algo V1.x' indicators automatically ('Swing Algo V1' counts as 'Swing Algo V1.0').

GreenCrypto Strategy
This strategy majorly uses MA, Tilson and S&R. MA is used for predicting the trend, Instead of normal cross-over of the MA, we are calculating the trend of the MA itself (whether MA is moving upward or downward by comparing the previous and current value of MA), along with MA we also use Tilson to calculate the MA.
Once we have MA and Tilson we take average and merge both MA and Tilson MA to get a double confirmation on the trend of the market. for entry and exit we use S&R with the merged MA, if the trend change is at the support or resistance level we go for LONG/SHORT respectively. Here we are doing continuous LONG+SHORT position, this provides more opportunity to capture unexpected market trend.
Enter a Long Trade when the script shows "Long" and exit either when you get "Short" signal or when it meets your target.
Parameters:
"Use 1:EST, 2:SST, 3:HST ?" : Select EMA , SMA or HullMA (works best on HullMA)
Length: Length of the EMA / SMA /HullmA
Factor: Used for calculation of Tilson and the Support and resistance .
Date/month/day : for selecting the right backtesting the period (currently it set to Jan 2018 to current day )
for this backtesting i have used 1000$ capital and 0.02% commission for each trade.
This strategy works best on 4H time fram but you can also use it on 1 day or higher timeframe charts
The default config present in this script is designed for ETH but it will also work with other coins)
Config for Specific Crypto coins (Please feel free to try out other configs also) :
ADA, BNB, EOS : "Use 1:EST, 2:SST, 3:HST ?" = 3
"Length" = 8
"Factor" = 0.9
ETC, XLM : "Use 1:EST, 2:SST, 3:HST ?" = 3
"Length" = 8
"Factor" = 0.85
Please DM me if you would like to tryout 7 Days free trail.

[Study] GreenCrypto Signal You can find the backtesting result of this indicator in here:
This indicator majorly uses MA, Tilson and S&R. MA is used for predicting the trend, Instead of normal cross-over of the MA, we are calculating the trend of the MA itself (whether MA is moving upward or downward by comparing the previous and current value of MA), along with MA we also use Tilson to calculate the MA.
Once we have MA and Tilson we take average and merge both MA and Tilson MA to get a double confirmation on the trend of the market. for entry and exit we use S&R with the merged MA, if the trend change is at the support or resistance level we go for LONG/SHORT respectively. Here we are doing continuous LONG+SHORT position, this provides more opportunity to capture unexpected market trend.
Enter a Long Trade when the script shows "Long" and exit either when you get "Short" signal or when it meets your target.
Parameters:
"Use 1:EST, 2:SST, 3:HST ?" : Select EMA , SMA or HullMA (works best on HullMA)
Length: Length of the EMA / SMA /HullmA
Factor: Used for calculation of Tilson and the Support and resistance .
This indicator works best on 4H time frame but you can also use it on 1 day or higher timeframe charts
The default config present in this script is designed for ETH but it will also work with other coins)
Config for Specific Crypto coins (Please feel free to try out other configs also) :
ADA, BNB, EOS : "Use 1:EST, 2:SST, 3:HST ?" = 3
"Length" = 8
"Factor" = 0.9
ETC, XLM : "Use 1:EST, 2:SST, 3:HST ?" = 3
"Length" = 8
"Factor" = 0.85
Please DM me if you would like to tryout 7 Days free trail.
Thanks

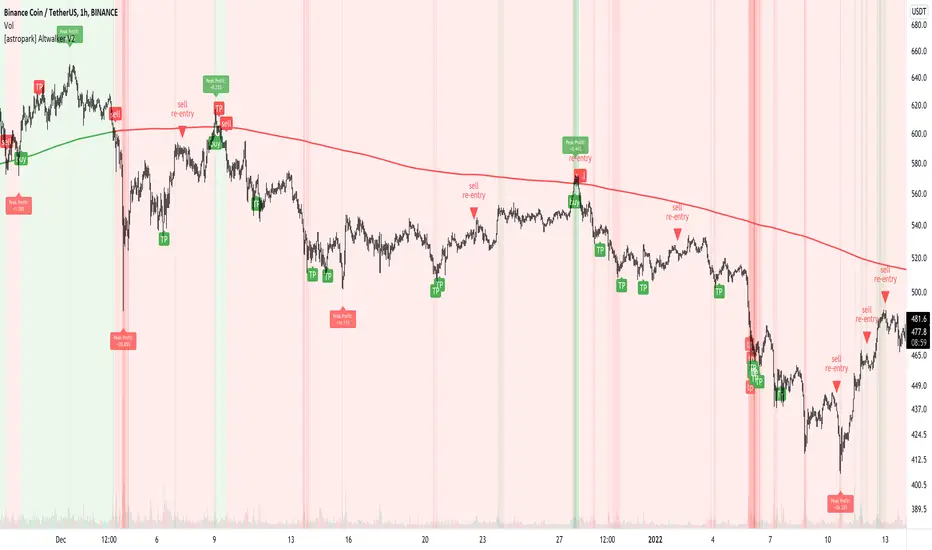
[astropark] Altwalker V2Dear Followers,
today I'm happy to share with you Altwalker V2 , an updated version of the former Altwalker for lower timeframes (from 5 minutes to 4 hours).
It is both a Swing and Scalping Strategy indicator , based on a simple trend following theory , mainly designed for Cryptocurrencies, Altcoins and of course Bitcoin.
Here you can see the Altwalker V1:
Based on Moving Average, Altwalker V2 on low timeframes dynamically identifies market resistance and support, so in which trend a cryptocurrency is during time:
green trendline and background means bullish trend , in fact it start with a "buy" signal
red trendline and background means bearish trend , in fact it start with a "sell" signal
if a series of buy and sell appears (this may happen especially in lower timeframes), this means price is in consolidation or distribution phase, so be prepared for a new trending phase coming soon, always remembering that taking profits is awesome and managing your risk by defining you position size and having a stoploss is a must in trading
To help in Taking Profits, Altwalker integrates also 2 special tools besides the trend highlighter:
Overbought and Oversold RSI Signals , which appear both as darker background (the darker the color, the more the price is in overbought/oversold) and green "ob"-"tp" / red "os"-"tp" labels (they optionally pop up only on a configurable stronger overbought/oversold condition) (you can enable/disable it optionally)
Peak Profit Tracker , which resets every time a new trade start and keeps track of price fluctuation during the trade: the message is don't be too much greedy and take profits or lock them with a stoploss in profit (you can enable/disable it optionally)
You can edit many options in order to
enable/disable showing buy/sell signals
enable/disable showing trendline
edit trendline variant (you have 2 options, by default variant 1 is selected)
enable/disable showing trend as background
enable/disable showing RSI TP signals
edit RSI length, overbought (OB) and oversold (OS) levels
enable/disable showing peak profits on each trade
The user who wants to use this strategy, especially via an automated bot, must always set a stoploss (example 150$ from entry on bitcoin ) or use a proper risk management strategy .
This is not the "Holy Grail", so use it with caution. It's highly suggested to use a proper money management .
This script will let you set all notifications you may need in order to be alerted on each triggered signals.
Here there are some examples how Altwalker V2 works on many timeframes and markets:
LINK/USDT 1h
XLM/BTC 1h
ETH/BTC 1h
ETH/USDT 1h
COMP/USDT 1h
YFI/USDT 15m
NEO/BTC 5m
VET/USDT 15m
This is a premium indicator , so send me a private message in order to get access to this script .
PT Crypto Kill ZonesVersion 1.0 of our PT Crypto Kill Zones indicator helps create a visual of specific times throughout the trading day, which we can expect volatility. The market moves within particular sessions. These sessions are broken up as such in three segments, NY, London & Asia.
Toggles -
Market Open highlights the opening of each market.
Daily Zone – highlights a period around the daily crypto candle close.
NY Open Zone – highlights a period around the NY market open.
NY Close Zone – highlights a period around the NY market close.
London Open Zone – highlights a period around the London market open.
London Open Zone – highlights a period around the London market close.
Asia Zone – highlights a period around the Asia market open.
Preferred zones are settings we came up with by running backtests to figure out which periods are close to the kill zones, which offer a better reaction.
Strategy: Use the sub 1h time-frame (30m is ideal) and scalp the London & NY zones with the PT Liquidity & PT Buy/Sell indicator.
This Oscillator was built around our buy sell & Liquidity indicator for scalping. It is included as part of the library. Just message us for access!

Dynamic Dots Dashboard (a Cloud/ZLEMA Composite)The purpose of this indicator is to provide an easy-to-read binary dashboard of where the current price is relative to key dynamic supports and resistances. The concept is simple, if a dynamic s/r is currently acting as a resistance, the indicator plots a dot above the histogram in the red box. If a dynamic s/r is acting as support, a dot is plotted in the green box below.
There are some additional features, but the dot graphs are king.
_______________________________________________________________________________________________________________
KEY:
_______________________________________________________________________________________________________________
Currently the dynamic s/r's being used in the dot plots are:
Ichimoku Cloud:
Tenkan (blue)
Kijun (pink)
Senkou A (red)
Senkou B (green)
ZLEMA (Zero Lag Exponential Moving Average)
99 ZLEMA (lavender)
200 ZLEMA (salmon)
You'll see a dashed line through the middle of the resistances section (red) and supports section (green). Cloud indicators are plotted above the dashed line, and ZLEMA's are below.
_______________________________________________________________________________________________________________
How it Works - Visual
_______________________________________________________________________________________________________________
As stated in the intro - if a dynamic s/r is currently above the current price and acting as a resistance, the indicator plots a dot above the histogram in the red box. If a dynamic s/r is acting as support, a dot is plotted in the green box below. Additionally, there is an optional histogram (default is on) that will further visualize this relationship. The histogram is a simple summation of the resistances above and the supports below.
Here's a visual to assist with what that means. This chart includes all of those dynamic s/r's in the dynamic dot dashboard (the on-chart parts are individually added, not part of this tool).
You can see that as a dynamic support is lost, the corresponding dot is moved from the supports section at the bottom (green), to the resistances section at the top (red). The opposite being true as resistances are being overtaken (broken resistances are moved to the support section (red)). You can see that the raw chart is just... a mess. Which kinda of accentuates one of the key goals of this indicator: to get all that dynamic support info without a mess of a chart like that.
_______________________________________________________________________________________________________________
How To Use It
_______________________________________________________________________________________________________________
There are a lot of ways to use this information, but the most notable of which is to detect shifts in the market cycle.
For this example, take a look at the dynamic s/r dots in the resistances category (red background). You can see clearly that there are distinctive blocks of high density dots that have clear beginnings and ends. When we transition from a high density of dots to none in resistances, that means we are flipping them as support and entering a bull cycle. On the other hand, when we go from low density of dots as resistances to high density, we're pivoting to a bear cycle. Easy as that, you can quickly detect when market cycles are beginning or ending.
Alternatively, you can add your preferred linear SR's, fibs, etc. to the chart and quickly glance at the dashboard to gauge how dynamic SR's may be contributing to the risk of your trade.
_______________________________________________________________________________________________________________
Who It's For
_______________________________________________________________________________________________________________
New traders: by looking at dot density alone, you can use Dot Dynamics to spot transitionary phases in market cycles.
Experienced traders: keep your charts clean and the information easy to digest.
Developers: I created this originally as a starting point for more complex algos I'm working on. One algo is reading this dot dashboard and taking a position size relative to the s/r's above and below. Another cloud algo is using the results as inputs to spot good setups.
Colored Bars
There is an option (off by default, shown in the headline image above) to fill the bar colors based on how many dynamic s/r's are above or below the current price. This can make things easier for some users, confusing for others. I defaulted them to off as I don't want colors to confuse the primary value proposition of the indicators, which is the dot heat map. You can turn on colored bars in the settings.
One thing to note with the colored bars: they plot the color purely by the dot densities. Random spikes in the gradient colors (i.e. red to lime or green) can be a useful thing to notice, as they commonly occur at places where the price is bouncing between dynamic s/r's and can indicate a paradigm shift in the market cycle.
_______________________________________________________________________________________________________________
Timeframes and Assets
_______________________________________________________________________________________________________________
This can be used effectively on all assets (stocks, crypto, forex, etc) and all time frames. As always with any indicator, the higher TF's are generally respected more than lower TF's.
Thanks for checking it out! I've been trading crypto for years and am just now beginning to publish my ideas, secret-sauce scripts and handy tools (like this one). If you enjoyed this indicator and would like to see more, a like and a follow is greatly appreciated 😁.

DePriExchange weighted price for cryptocurrencies
DECENTRALIZED PRICE CHART FOR DECENTRALIZED WORLD
See non-manipulated , globally price action that comes from whole liquidity!
The main idea behind this script is that...
The value of each trading pair finally determined globally and the price displayed in exchanges is its own and not global! differences between exchanges, reduced to near zero gradually by market makers and arbitrages, so..
Every min tick price changes Must be backed by liquidity to be part of the global fluctuations
more liquidity gives it more credibility
more credibility give it more weight
..Against opposing movements.
This script can collect price of crypto pairs from 12 exchanges that listed on TV and have effective volume.
In the first step, summarizes the volume of all exchanges and creates the total volume
In the next step, divide each exchange volume to total volume to obtain relative weight of each exchange.
In the final step, multiply each exchange price to weight of itself and summarizes these numbers .. now, we have Exchange weighted price!
The results on high liquidity pairs like BTCUSDT, ETHUSDT, is not much differ then simple chart but when you apply it on lower liquidity, lower time frames of altcoins, you realize its benefits and usefulness. Altcoins chart in composite and simple mode is very differ, I hope you enjoy from TRUE CHART.
With this, also you can..
Filter and smooth candlestick chart with SMA or EMA
Plot a line chart of pair at your desired frame separate from the main chart for monitor important price levels
Get realtime report of whole volume of pair on included exchanges
Get realtime report of each exchange weight and share
Note.1:
some of pairs queted on more than one like BTCUSD, BTCUSDT, BTCUSDC and etc. In this pairs we choose the one that usually has more volume on that exchange.
Note.2:
At this time, supported queted currencies are BTC, ETH, USD, USDT, BUSD, USDC, USDK.
Note.3:
This script is relatively heavy! This is not cuz of bad coding.
Each bar compution contains at least one plot and some of security calls, so 10 to 15 seconds is normal load time.
Note.4:
You can combine this with your price action base scripts and use balanced OHLCV. The necessary explanations about this are available in the code.
Note.5:
You must only include exchanges that support your ticker, Otherwise you will receive an error.
I hope it comes useful to you.

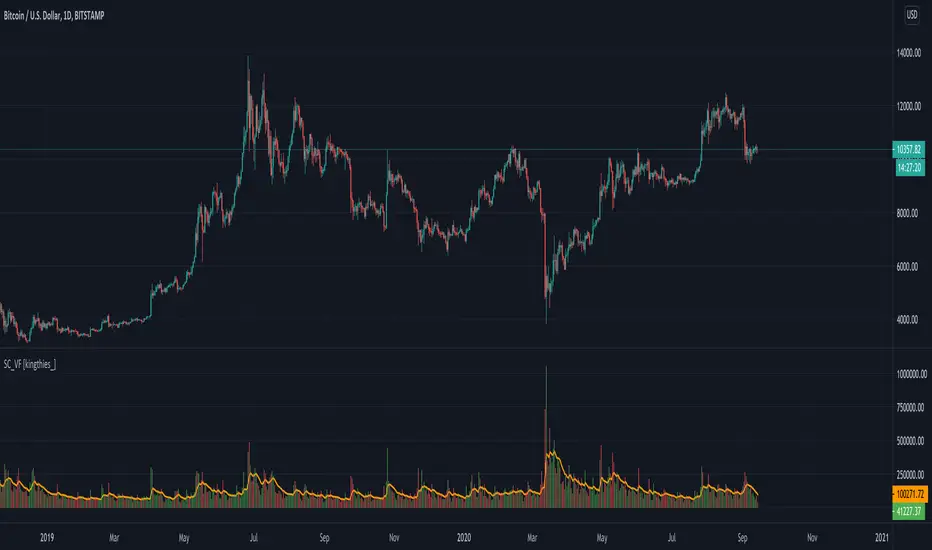
Stablecoin Volume Flow [kingthies_]Stablecoin Volume Flow into BTCUSD/BTC-Stablecoin pairings
Exchanges Used
Coinbase
Kraken
Bittrex
Binance
Huobi
Bitstamp
Gemini
Bitfinex
Our aim here is simple...to combine the overall volume flow from Fiat or stable currencies into the crypto-markets.
This is the first portion of a series I plan to share involving a holistic approach to understanding the overall crypto-ecosystem. I've included several of the highest ranking by volume exchanges and their accompanying older/well known stablecoins.
Also, the historic data for the newer stable coins made the study invalid due to limited sample size. That included coins like USDC, DAI, GUSD, BUSD and more. For this reason, the 10 sources of data here adequately provide the data needed to see a full view of the market volume going in and out of bitcoin at any given moment
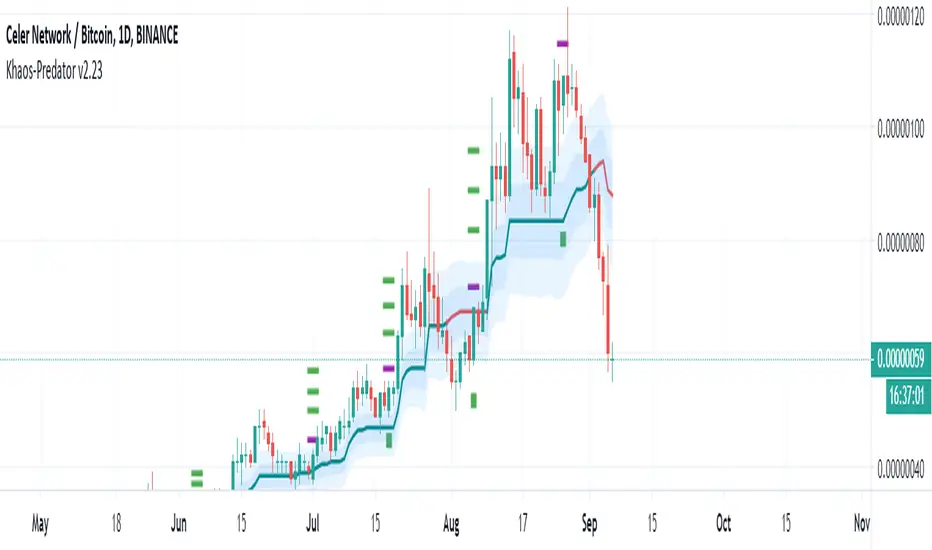
Khaos-PredatorThis Indicator is a full trading system that offers setups with Entries and Targets and Trade Management. This indicator is very accurate because it uses advanced setup detection and filtering logic.
There are 2 conditions that must occur for you to take a trade:
1) Price must move beyond the purple dot
2) The baseline must be green for long trades, or red for short trades.
The setup is triggered if the price passes the purple dot. Do not enter the trade unless price passes the purple dot. (You may wait for pullback to enter if you wish – but only after price traded beyond the purple dot firstly.) Remember, the trade is NOT active unless price moves beyond the purple dot.)
Each setup has 3 possible targets, which are dots colored green for longs and red for shorts.
You can use the baseline (which is a trend-line that is either green for bullish or red for bearish) to filter trades. You should only enter long trades if the baseline is green and only enter short trades if the baseline is red. One strategy would be if you enter a trade long, and reach the first target, you can take some profits, but still let the some of the position run and use the baseline to manage the trade.
Also, you can use the baseline for trailing stops.
To summarize:
• Purple Dot = Entry Trigger
• Green Dots = Long Targets (3 of them, for different price targets: target 1, 2 and 3)
• Green Square = Long Stop
• Red Dots = Short Targets (3 of them, for different price targets: target 1, 2 and 3)
• Red Square = Short Stop
The great thing about this indicator is that its universal, there are no settings necessary -- just put it on the chart and it finds high probability setups and paints it on the chart as they occur. There is NO Repainting with this indicator.
Of course, you can add other indicators if you wish, and even add this indicator to your existing trading system.
Again, this indicator does NOT repaint.
Once a setup is found, the indicator draws the entry trigger price and the targets at the setup bar close.
Setup Alerts are fully supported, via email, sms, and desktop notification.
*If you wish to license this indicator, please contact me via private message for details regarding access. Thank you.
LEGAL STUFF:
Risk Disclosure
Futures , forex, stock, crypto and derivative trading contains substantial risk and is not for every investor. An investor could potentially lose all or more than the initial investment. Risk capital is money that can be lost without jeopardizing ones’ financial security or life style. Only risk capital should be used for trading and only those with sufficient risk capital should consider trading. Past performance is not necessarily indicative of future results
Hypothetical Performance Disclosure
Hypothetical performance results have many inherent limitations, some of which are described below. no representation is being made that any account will or is likely to achieve profits or losses similar to those shown; in fact, there are frequently sharp differences between hypothetical performance results and the actual results subsequently achieved by any particular trading program. One of the limitations of hypothetical performance results is that they are generally prepared with the benefit of hindsight. In addition, hypothetical trading does not involve financial risk, and no hypothetical trading record can completely account for the impact of financial risk of actual trading. for example, the ability to withstand losses or to adhere to a particular trading program in spite of trading losses are material points which can also adversely affect actual trading results. There are numerous other factors related to the markets in general or to the implementation of any specific trading program which cannot be fully accounted for in the preparation of hypothetical performance results and all which can adversely affect trading results
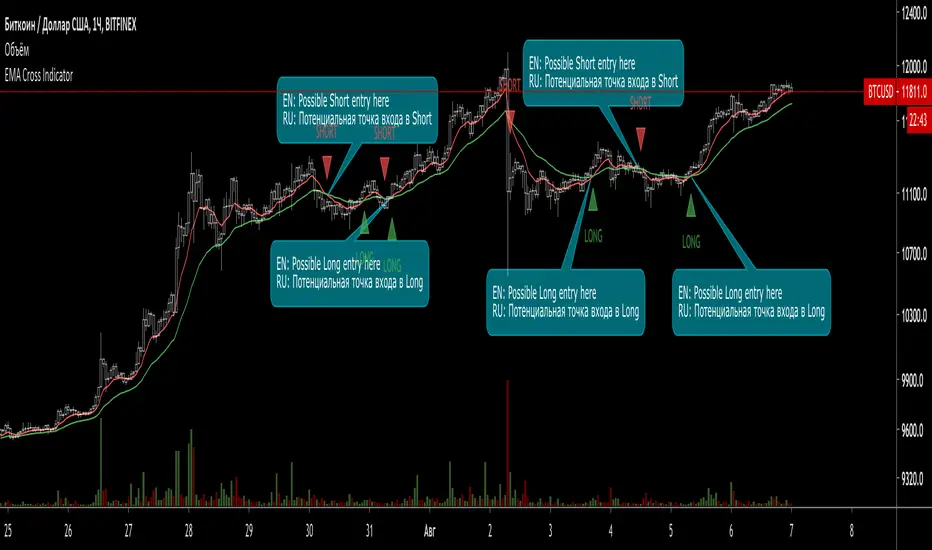
EMA Cross Indicator (with signals)This indicator shows 2 EMA (Long and Short) Cross and gives a possible entry point for a trade.
When Short EMA (red line) line crosses Long EMA (green) from bottom to top - this is a possible Long trade entry point.
When Long EMA (green line) line crosses Short EMA (red) from bottom to top - this is a possible Short trade entry point.
In both cases (basically, all the crossovers) are indicated with "Long" and "Short" labels.
Works with Crypto (from 30 min timeframe and higher)
Stocks (from 1 hour timeframe and higher)
Commodities (from 1 hour timeframe and higher)
Forex (from 1 hour timeframe and higher)
Consider using it with respect to Your trading style, money- and risk-management as well as other indicators.
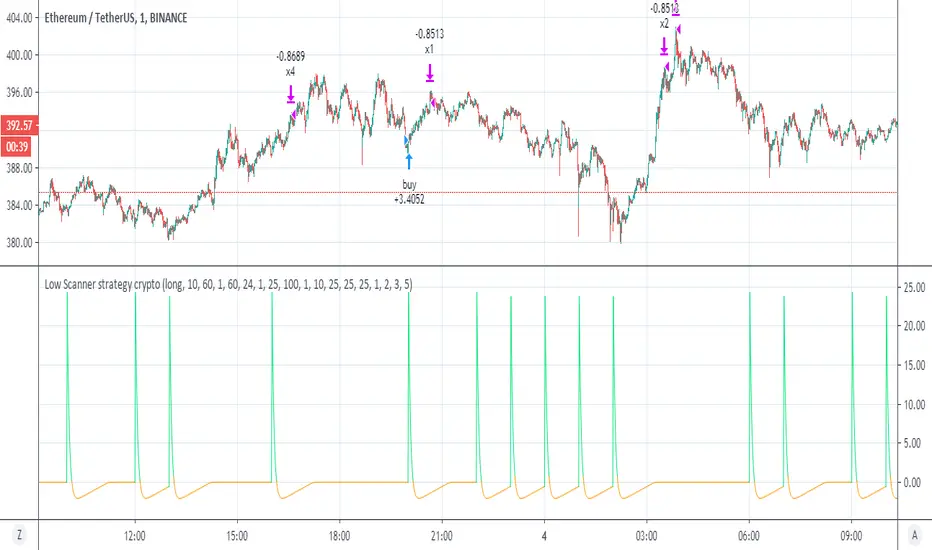
Low Scanner strategy cryptoThis is the last script of the Low scanner series
I have shown in script 1 the best strategy for stocks on 1 hour
script for forex 1 hour (if you look on comments you will find settings which are perfect for low TF (1 min system )
This strategy is the perfect weapen for crypto
no repaint as I shown the scanner do not use security
this system will buy and sell about every 1000 min in the end you will getyour profit which is progressive
set to 1,2,3, and 5 % where each time you take 25% of equaty out
as I shown before the power of the progresive take and my scanner make it best
the scnner serach for low point using my special RSI system with no repaint MTF
every time we get our profit out
the scanner will find us new low to start cycle again
so invite me for coffe if you like this system
thanks to TV that allow donation:)
so this is example of smart strategy that beat the odds
try on major crypto assets (it nice system )
without the script of adolgov
this system was not possible so I would like to thank him very much that he share with us his great script
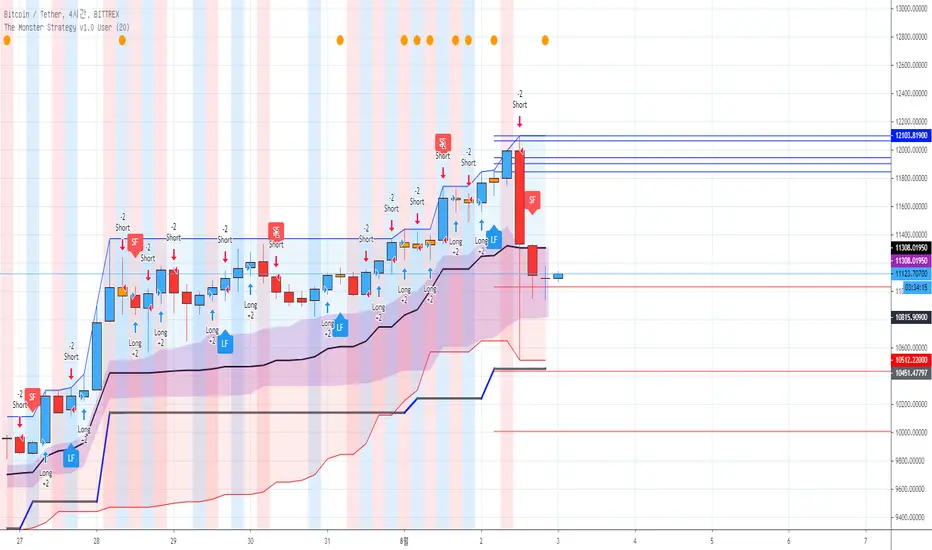
[AngelHouse] The Monster StrategyHello, I'm Angelhouse, a crypto analyst and indicator developer. :)
I would like to introduce you to the newly developed "The Monster" strategic indicators.
The indicator is an upgraded version of the existing "All Eating" strategy indicator.
- The "Monster" indicator is a strategic indicator created for crypto market transactions.
- This indicator is based on a four-hour time zone and is a strategic indicator using the intersection of the threshold.
- If a plot is crossed, a call is in progress or crossed, a sales signal is generated.
※ Explanation of the "The Monster" Strategy Indicator v1.0
1. Long & Short: You can configure your swing strategy based on the signal.
The All Eating Strategy indicator is based on a four-hour frame. Due to the logic nature, the signal does not match at a time higher than 4 hours. Therefore, we recommend that you use the indicator only in a time zone of 4 hours or less.
Also, the signal does not have 100% accuracy, so even if you configure a strategy based on the signal, it is recommended that you set the break/break line and respond.
2. Long Feel & Short Feel: The signal is also quite reliable. The strength of the signal is very reliable when a strong rise and a strong fall occur.
However, the downside is that there may be some offbeat in the transverse section. However, even if the index is offbeat, the loss is small, and if the stock price rises or falls, high expected returns can be expected.
You can use the signal alone, but if you use the Long & Short indicator, you can get better results. If the Long Feel & Short Feel signal is also generated where the Long & Short signal is generated, the probability will be higher, right?
3. Candle color: White cans are formed when cans such as dojorpoenor hammer are generated. The cans have a meaning of reversal when they occur after a strong rise or fall, and can continue the trend when they occur during an ongoing trend.
4. Single item band: The single item band consists of the strong area (blue area) and the weak area (red area) based on the reference line. Stock prices can indicate additional gains when they are in the bullish zone, and additional declines when they are in the weak zone.
Also, you can recognize the top of the strong zone as the resistance line and the bottom of the weak zone as the support line.
The cloud stand in the single band should be located in front of the band for 26 days, but it is also recognized as a role of support and resistance.
5. 1D Baseline: The line of one bar is recalled to 4 hours. blue when the reference line is positive, red when negative, and gray when horizontal, and red when the reference line is positive,
Or, in the opposite case, it's time to suspect a trend inflection.
6. Target line : When a specific period is set (default 20 days setting), the target point is provided in each of the 5 lines, from the highest point in the period to the low point of the current bar, and from the lowest point to the high point of the current bar.
※ If you want to obtain access to this indicator with a script dedicated for the first time, please contact the link shown in the signature.
Z+ Trend Finder & Breakout 3in1 for Crypto Stock & Forex TradingDear all,
If you like this indicator please hit the like button and do follow me. It takes lot of effort & calculations to bring some good strategy on charts. Keep Supporting & will update this indicator regularly.
Z+ Trend Finder Pro🚀 by Zia 💎 a combination of RSI+MACD+SMA
Z+ Trend Finder Pro is a 3in1 Indicator for Crypto, Stock Market & Forex Trading. This indicator is a combination of RSI , MACD , SMA & few other important settings with unique strategy keeping scalping & intraday trading in mind. Please read all points below for better understanding of how this indicator works. I'll make it very simple and easy to understand.
When you load the indicator on chart, you will see candles in 2 colors blue & dark brown (You can change color from settings if you want).
Blue means price is going up
Brown means price is going down
On Top you will see thick Red line - Overbought , means if price is above this line ( RSI above 80) - market is overbought and RSI is too high and chances market will reverse.
Bottom you will see thick Green line - Oversold , means if price is below this line - market is oversold & RSI very low around 20 & chances market will reverse.
In-between you will thick Green/Red line called breakout line . If price is below this line, color will red means market is in downtrend and will further go down.
If price is above this line, its color will be green & means market is in up trend and will go further up.
Breakout Line -
Whenever price break the Breakout line upside, up breakout will come means open long position, if downside, down breakout will come means open short.
Rest things are self explanatory.
Apart from this, you will see green and red bands. The wider the band indicates trend is strong, & if bands width is getting narrow means trend is fading - Get out of trade at that time.
Market overview Display Box
On the right side, you will see yellow box with particular coin details along with other market top performing coins in terms of MarketCap. From settings you will change it to either Crypto, Stock or Forex. You can control the display of this box from script setting.
Which is the best timeframe to use with this indicator?
I personally check things first at 1hr chart, to know how market is performing in broad time frame.
Next if you see more volatility in market, you can use 15min time frame too.
Also it depends from coin 2 coin and market conditions too. Sometimes you will find things are pretty good with 5 min and sometimes 15min, and sometimes you might stick with 1hr.
EURUSD Example
NIFTY Example
What is the accuracy?
Personally when i use it with 1hr TF for intraday swing calls, i see pretty good result & accuracy almost above 90%.
But do keep in mind, its not a magical stick - always DYOR fully after seeing any type of recommendation from this indicator either on buy/long or sell/short side.
Disclaimer:- This indicator is just for educational purpose and does not guarantee to make you rich overnight. It only helps you to understand market trend, so you take prefect entry. Anyone who guarantees you will make money, is pretty much guaranteeing that you will lose money. Trading and technical analysis is extremely difficult, it takes patience, discipline and most people do not make it. Applying these tools and investing in your trading education can help put the odds in your favor but will only assist the individual in their execution, decision making, thought process and executing their own individual trades, NOT make them for you.
You're always welcome to share any type of suggestion & feedback.
To access this indicator, Interested traders can pm me our use below links.
