The Gral : Alpha Scalping Demo (Atom)You want to make money. This bot will allow you to do it.
We know how it can be challenging, frustrating, struggling to make money especially in bear market. Save your energy, your emotions, your nerves! Alpha Scalping will allow you to sleep better and make money while you sleep!
We tested hundreds of indicators, strategies, mt4 ea and bots since 2010, today we will start to release a series of successful bots and automatic strategies for you, some of them will be free, some of them will be paid (monthly subscriptions)
We will also indicate how to connect the Alpha Scalping to your Binance or FTX account so you can trade automatically.
Enjoy, subscribe and stay tuned!
NB : This bot is a demo only, it will work only on ATOMUSDTPERP
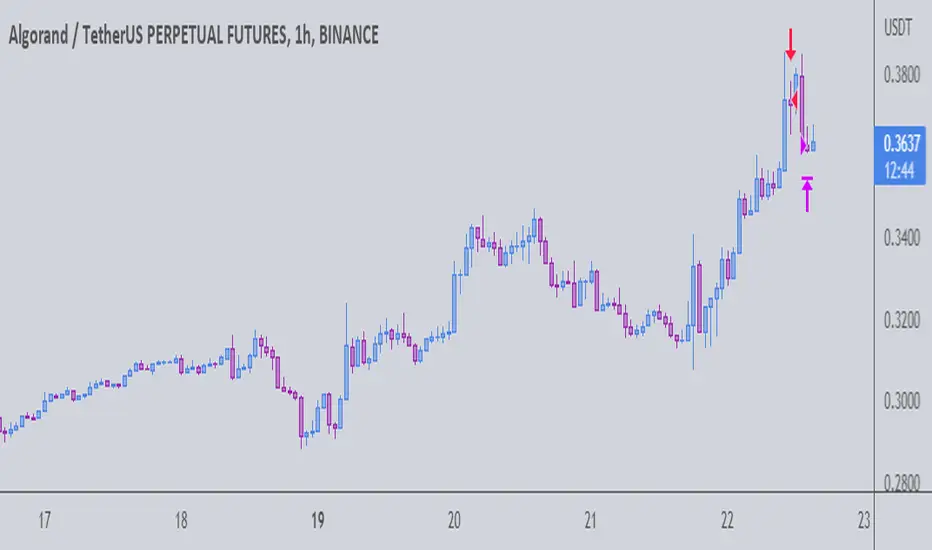
Bot for ALGOUSDTPERP :
Strategi Pine Script®