Linear Regression BotHello Fellow Traders!
-------------------------------------------
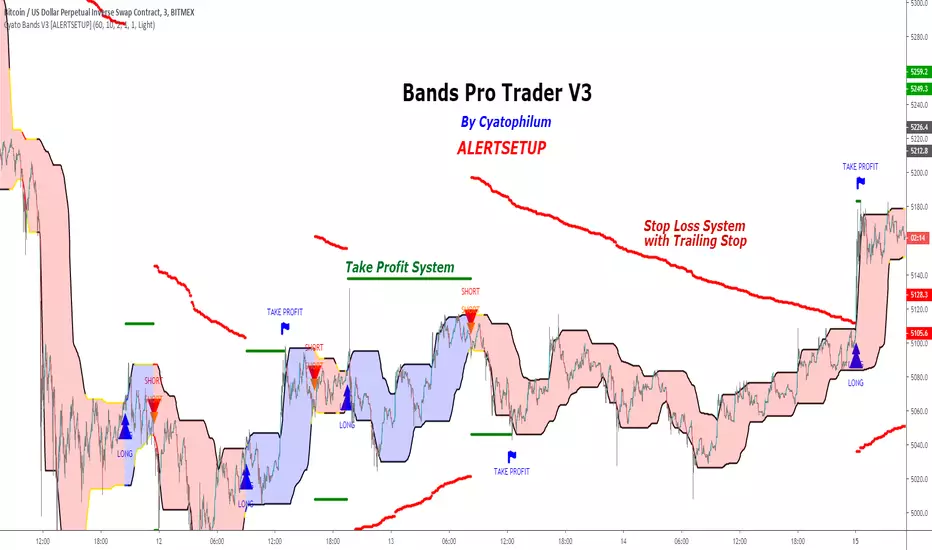
This is the newest addition to Gnome Alerts PRO!
This is a new trading method designed to take advantage of Linear Regression methods along with using price blocks to make smarter trades.
PineScript v4 allows us to get more creative from an indicator perspective and really make some neat stuff.
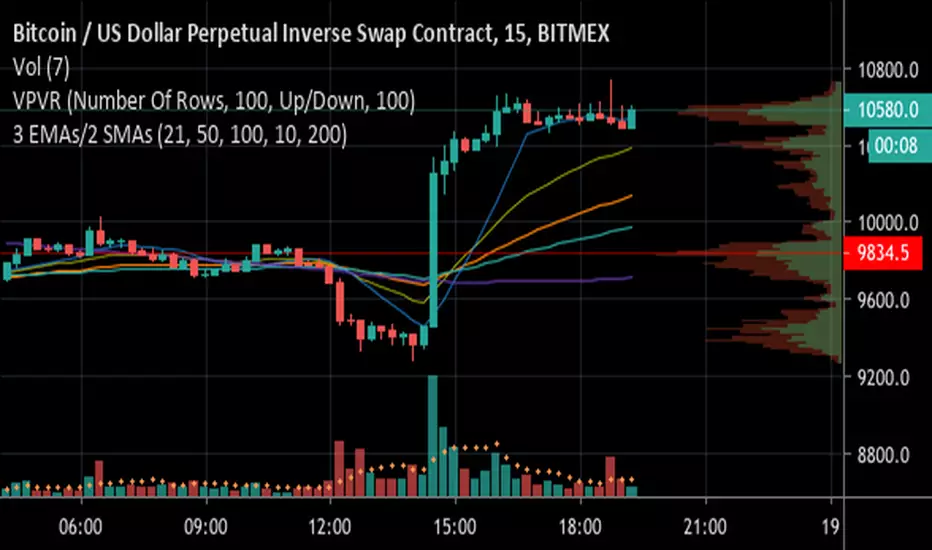
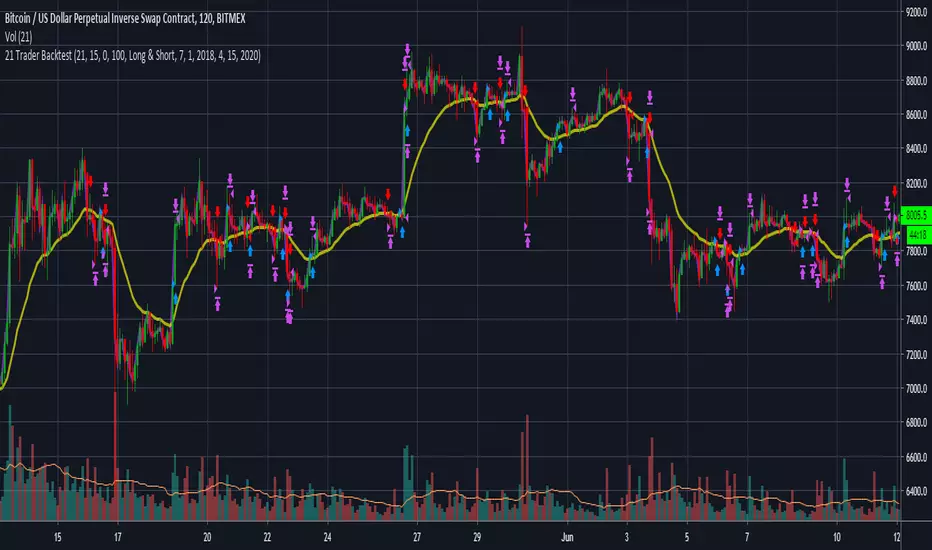
This Bot Script works on all Crypto, Leverage, Forex, & Traditional Exchanges.
FEATURES
------------------------
*Goat Alerts & Autoview Ready*
- Easy to Use
- DCA
- Avg Position Tracking
-Take Profit
- Stop Loss
You can get access to any of my scripts by visiting my Website, all links are down below....
Indikator Pine Script®