Marked Highs - Support & Resistance [LevelUp]This indicator mimics the functionality of marked highs/lows in MarketSmith, a charting tool available from Investor's Business Daily. Marked highs/lows, sometimes referred to as pivot highs/lows, can be used to locate areas of support and resistance. These same points can also be helpful when drawing trendlines and channels.
I've added several customization options that add to the flexibility and overall usefulness of this technical indicator.
Custom Ranges for Marked Highs/Lows
In MarketSmith, a marked high is the highest high going back nine bars and forward nine bars. The number of required bars with lower highs on each side of the high is referred to as the period. The default for the indicator is a nine bar period, however, you can configure the period to fit with your trading style.
View Marked Highs/Lows on Any Timeframe
MarketSmith only supports marked highs/lows on daily charts. With this indicator you can view marked highs/lows on any timeframe.
Suggestions
■ Draw horizontal rays from the most recent marked high and low to help visualize areas of support and resistance.
■ Create a channel to show the current trading range. Draw a trendline across marked highs and a separate trendline across marked lows.
■ Increase the marked high/low periods to find more significant highs and lows.
Support

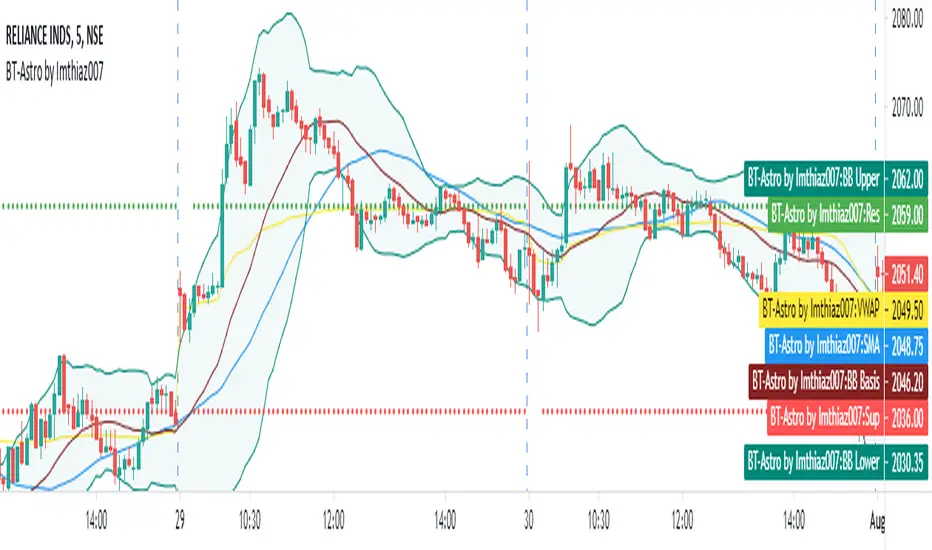
BT Astrology Indicator by Imthiaz007
BT-Astrology Indicator is fine tuned indicator to calculate and draw daly support and resistance based on Gann level for intraday trade or swing trade.
The original Idea is given by Mr. Alex from Badshai Trading; I am a Software Developer by profession so that I just coded it and add some signals for back testing.
I also add following Indicator for better view:
a) Simple Moving Average
b) VWAP
c) Bollinger Band
The Input section of the Indicator :
SMA :- Length 35 as per Mr. Alex suggestion
Minutes : Enter minutes in terms of number of minutes on which VWAP value will be taken for calculating the levels.
By default it will be 20 means VWAP value of 9:35 AM candle will be consider for drawing levels.
How it works ?
Buy : When resistance is broken with higher high formation and candle is above 35 SMA
Sell : When support is broken with lower low formation and candle is below 35 SMA
Hope you like it!!!
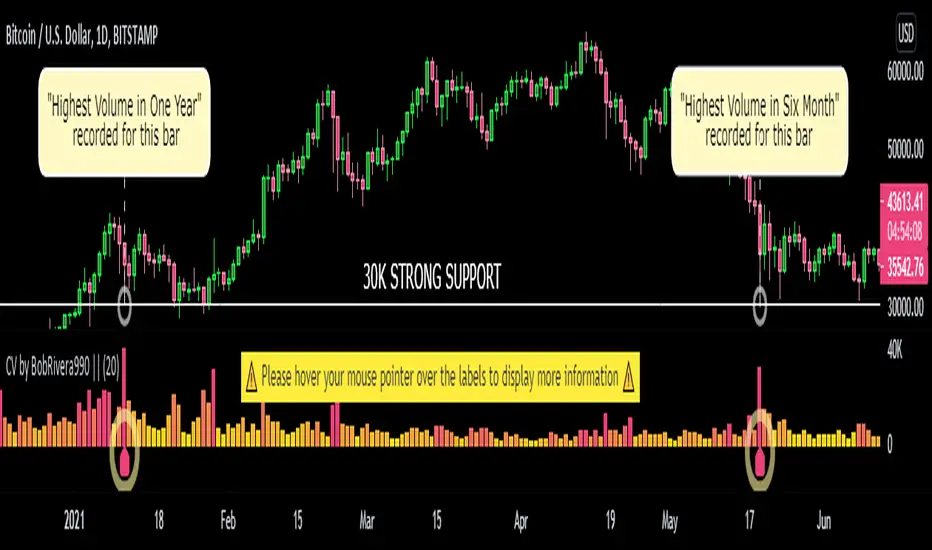
Custom Volume - Periodic Peaks & Troughs + AlertThis script is a custom volume indicator with additional features.
But why is this useful?
The minimum and maximum volumes, in different time periods, are displayed by labels below the bars. I call them "Peaks" and "Troughs".
Hover your mouse cursor over the labels to see more details.
These parameters are widely used in technical analysis.
If traders want to confirm a reversal on a level of support–or floor–they look for high buying volume. Conversely, if traders are looking to confirm a break in the level of support, they look for low volume from buyers.
If traders want to confirm a reversal on a level of resistance–or ceiling– they look for high selling volume. Conversely, if traders are looking to confirm a break in the level of resistance, they look for high volume from buyers.
For example, take a look at the chart.
Settings menu parameters
{Dialog Box} =>
Parameter to show / hide the dialog box.
{Visual Parameters} =>
Parameters to personalize the appearance of the indicator.
{ Alert Conditions Part 01: Peaks ⏰ "} =>
Parameters to customize the alert.
{ Alert Conditions Part 02: Troughs ⏰ "} =>
Parameters to customize the alert.
{Volume MA} =>
Moving average settings
How to use alerts
Note that by creating an alert, an instance of the indicator, with all your settings, will be activated on the site's server and alerts will be triggered by it.
After that, changing the indicator settings on the chart will no longer affect the alert.
Open the settings window and select the alert conditions as you wish
Click the Create Alert button (or press the A key while holding down the ALT key)
In the Condition section, select the name of the indicator.
Make the rest of the settings as you wish.
Finally, click on the Create button.
It's finished. After a few moments, your alert will be added to the Alerts menu.
Limits
The labels are displayed after the bars close.
Labels are displayed for the last 10,000 bars.
References: Investopedia
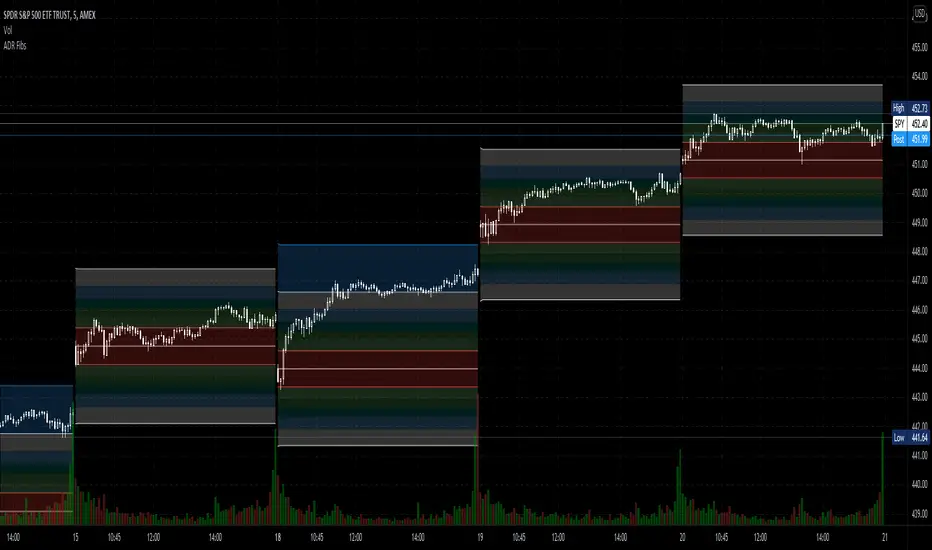
Average Daily Range Fibonacci LevelsThe Average Daily Range is a simple concept, calculated as the difference between daily highs and lows averaged over some period. This indicator uses that range in conjunction with Fibonacci ratios to create zones centered on the day's open that tends to act as areas of support and resistance.
The thicker White lines are the ADR levels; all other lines are the same value adjusted by the various Fibonacci values.
A simpler version of this concept can be seen in my other script, Average Daily Range Zones, which does not include the Fibonacci ratio zones.
Thanks to @Hank Hill for the original idea and TV for the feedback and support on the use of the security() function.
Also thanks to @GoldenCross for the Fibonacci obsession.
Average Daily Range ZonesThe Average Daily Range is a simple concept, calculated as the difference between daily highs and lows averaged over some period. This range is is overlaid and centered on the day's open, and tends to act as areas of support and resistance . This indicator provides two aggregation periods, creating a range that represents volatility in the ADR; a wider spread indicates greater recent volatility , and vice-versa.
Thanks to @Hank Hill for the original idea and ToS script this is based on, and TV for the feedback and support on the use of the security() function.
CFD Ticks LevelsSimple but very effective script that finds areas of support and resistance through ticks exchange. Only works with CFDs
(You must enter in the settings the value corresponding to the CFD, example: US500 = 500, DAX30 = 30, FRANCE40 = 40 etc ...)
As usual, if you have any suggestions or bug reports don't hesitate.
Cheers

IZCI [xaurr]Yet another trailing stop loss script, using optional percentage or atr values to follow the last price.
Green area: bullish , long
Red area: bearish, short
IZCI means trailing in Turkish.
If you find it usefull, please like it.
Good Luck :)
Eliza's S&R FrameThe frame has been put together to show greatly enhanced accuracy of support and resistance. Forget using open, high, low, close data for your S&R. This frame is built off e = 2.71828 and its multiples. The particularly important levels are yellow instead of blue and are to be given more attention when price is between a blue and yellow. Look for institutional candles which will open above and close below the level and vice versa. Look for trends which turn away just before the level on the retrace as this will get you laser accurate entries. Once a level breaks even by the tiniest bit assume it is no longer valid and price will now be caught in the range between the higher and lower levels it hasn't broken yet. Use with 1 minute chart as I do for greatest chance of success.
Volume Profile / Fixed RangeHello All,
This script calculates and shows Volume Profile for the fixed range . Recently we have box.new() feature in Pine Language and it's used in this script as an example. Thanks to Pine Team and Tradingview!..
Sell/Buy volumes are calculated approximately!.
Options:
"Number of Bars" : Number of the bars that volume profile will be calculated/shown
"Row Size" : Number of the Rows
"Value Area Volume % " : the percent for Value Area
and there are other options for coloring and POC line style
Enjoy!

Support and Resistance by CainKellyeCheck out my automatic support and resistance indicator that uses the EMA of price change * relative volume as the bases of pivot search.
It also tells the strength of the support and resistance lines calculated using a 4 times quicker EMA and using its distance from the slower one.
The strongest plotted line has the maximum opacity and the weakest has the minimum opacity inside the given range.
This calculation results in an organic detection of the support and resistance prices.
You can set the distance range in percentage you want to have lines calculated around the current price.
You can set the lines gravity distance inside which they are snapped together: the stronger line pulls the weaker to it by using strength weighted average for the new price value.
You can increase the minimum opacity value in case you only see few lines (but the maximum is 15)
You can change the used price for the lines to Close or High/Low but recommended is to use the average of those two (default)
The distances multiplier helps to get a birds eye view easily when using 4H (or higher) chart and a separate one to use on Daily / Weekly / Monthly for even broader view.
Lines and labels are drawn near the candles so you are still able to zoom in.
Labels are not drawn when their line is barely visible (transparency >= 80)
This indicator has been refined on the 15 minute and 1 hour charts of BTC and other cryptos but it works well in smaller volatility markets as well if the distances are adjusted accordingly.

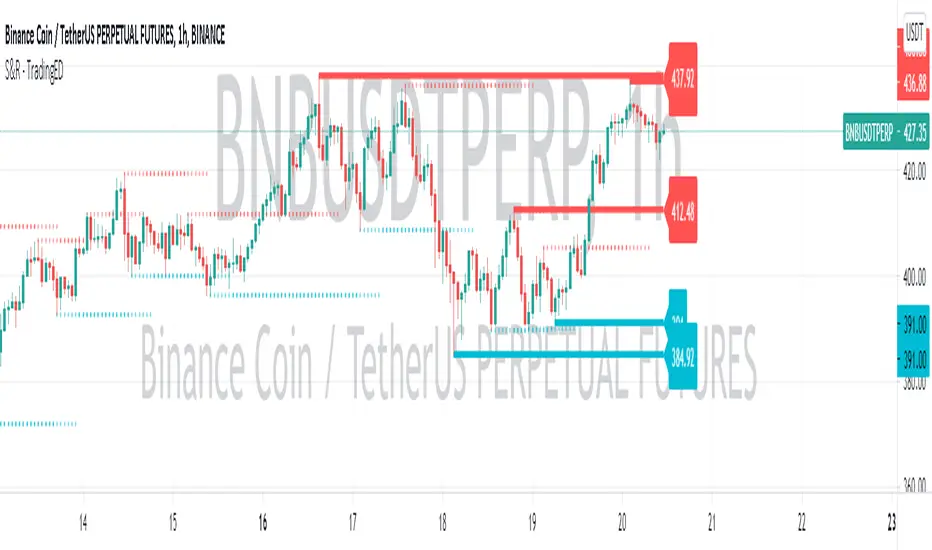
Support & Resistance - TradingEDThe use of this indicator is restricted to private use, and it can be used only by invitation. Different functionalities have been added, such as alerts and signals that seek to make trading much easier to interpret by any type of trading operator of any experience level, from beginner to intermediate and advanced.
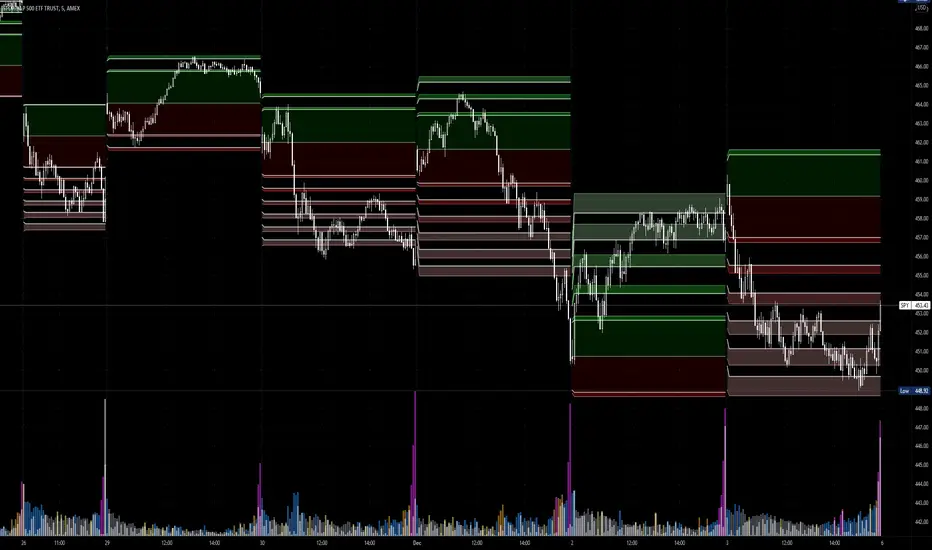
This indicator will help you identify support and resistance levels over a previously determined range, whether from a count by candles , by minutes , hours or days . These support and resistance levels are calculated thanks to the highest and lowest points that will be painted along the chart, from the levels that you have previously selected .
You will even have a way to identify the most recent levels , thanks to the fact that they will be painted in a darker tone , as well as some price labels to quickly identify each of the levels on the chart . Identifying these levels sometimes seems like a pretty difficult task, but with this indicator you will discover that it will be much easier than you think to be able to master these levels.
As part of the analysis of chart patterns, traders use these price levels on charts that tend to act as barriers, preventing the price of an asset from being pushed in a certain direction. Support and resistance levels serve to identify the points where the price can favor certain probabilities for a stagnation or reversal of a prevailing trend.
Main functions of this indicator:
1) The MEASURE can be based on a CANDLES count if you are trading OHLC Charts from 1D onwards , or if your trading is intraday, you can also select counts by MINUTES , HOURS or DAYS , depending on your trading style.
2) LENGTH , by default it will be loaded as in the STRATEGY , but considering the previous point, you can modify it according to your convenience.
3) You have the option to hide or show the EXTENDED LEVELS the way to identify the most recent levels.
4) You have the option to hide or show a LABEL at the right of the chart, with respect to the price levels.
Main functions to customize the style of this indicator:
a) You can select the COLOR for Support and for Resistance, with the colors that best suit you.
b) In the case of the LABELS that appear at the right, the text, type of label and default color is not modifiable.
Support and ResistanceThis indicator shows three types of support and resistance lines: Horizontal, Parallel (using linear regression) and Fibonacci Retracement. Lines can be adjusted or turned on and off in settings. A great tool for setting up entries, exits and locating pivot points.

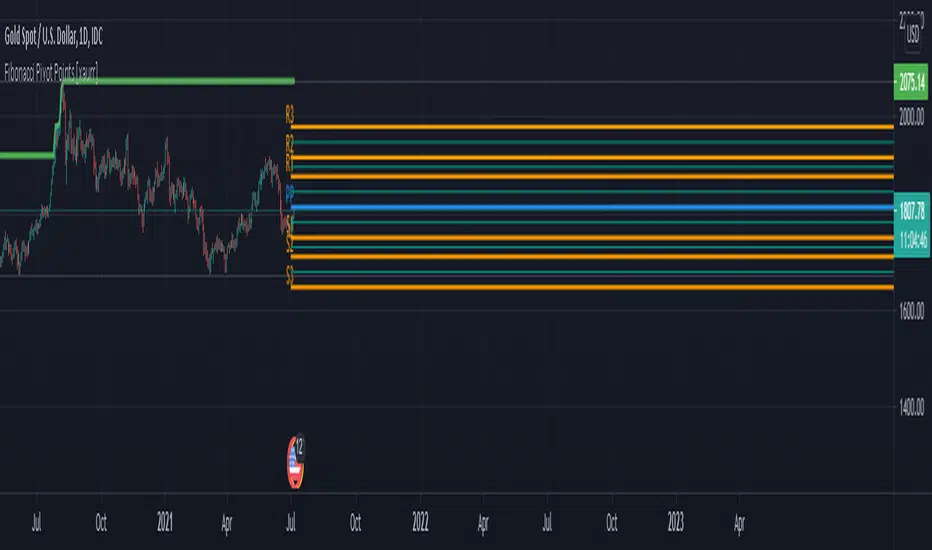
Fibonacci Pivot Points [xaurr]This script is the enhanced version of my previous script Ath Atl Fibonacci Pivot Points
It has standart fibonacci pivot points with auto time frame, you can also choose custom time frame too.
Good Luck!
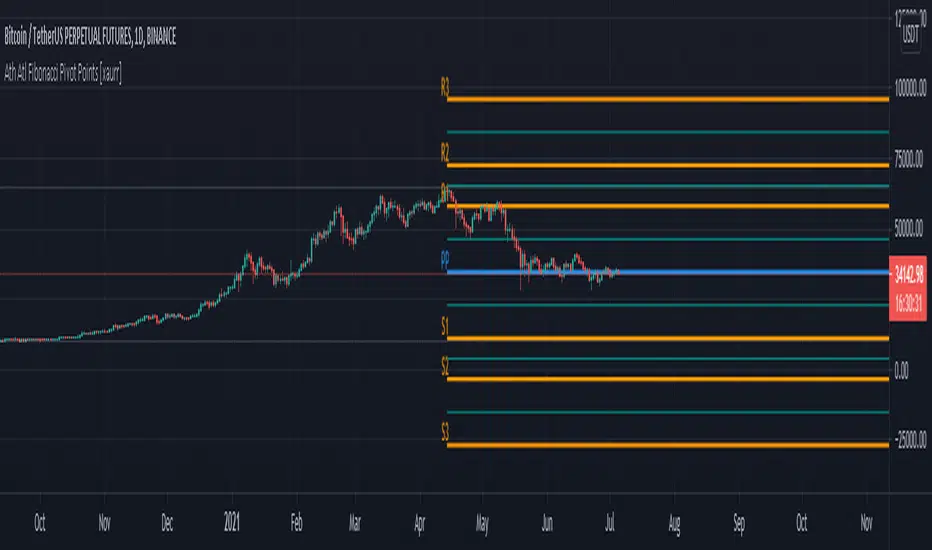
Ath Atl Fibonacci Pivot Points [xaurr]This script draws fibonacci support and ressistance lines according to all time high and low values.
BTC > bull market supportPlots the natural log of the price divided by the 20w SMA and 21w EMA, color coded by the Bitcoin price (green if above, red if below). Use this when comparing Altcoins to Bitcoin's performance. Works in daily & weekly timeframes only!

FullPac4Trader (I.Denis)The script combines the three most important indicators on the chart.
1. A set of six moving averages ( EMA and SMA ), which can be turned on and adjusted at your discretion.
2. Indication of support and resistance levels, calculated according to the Bollinger scheme.
3. Pivot Point and the nearest goals using the Floor method with the possibility of selecting a time period.
The script version is v.1 (beta)
The development of this script will continue. Feedback and suggestions are welcome.
Cup FinderHello All,
This script finds the Cups and you can use it while analysing the symbols. it creates circle and channel for the potential Cups and checks the number of bars included by the channel, if included bars is equal or greater than the value you set then it shows the cup.
The Options:
"Number for Bars to search" : Maximum length of a Cup
"Channel Width of the Cup" : Tate by the channel width of highest/lowest levels in last 300 bars, by default it's 5%
"Check for Breakout" : if there is Cup then it checks Close or High/Low is used a source for breaokuts, usuful while cheking historical bars
"Contained Bar Rate %" : after channel is created the script checks number of bars included by the channel of the Cup, you can set rate of included bars by this option
"S how Channels of Cups ": if you enable this option then you can see the channels around the Cups and set it as you wish
and there are some other options for labeling/removing old Cups and for coloring
Here you can see how channel looks like:
Cup with different colors:
P.S. This is an experimental work and sorry for no explanation in the script.
in the future if I have time I will try to write a script for Cup&Handle
This script is also an example to calculate and draw circles :)
Enjoy!

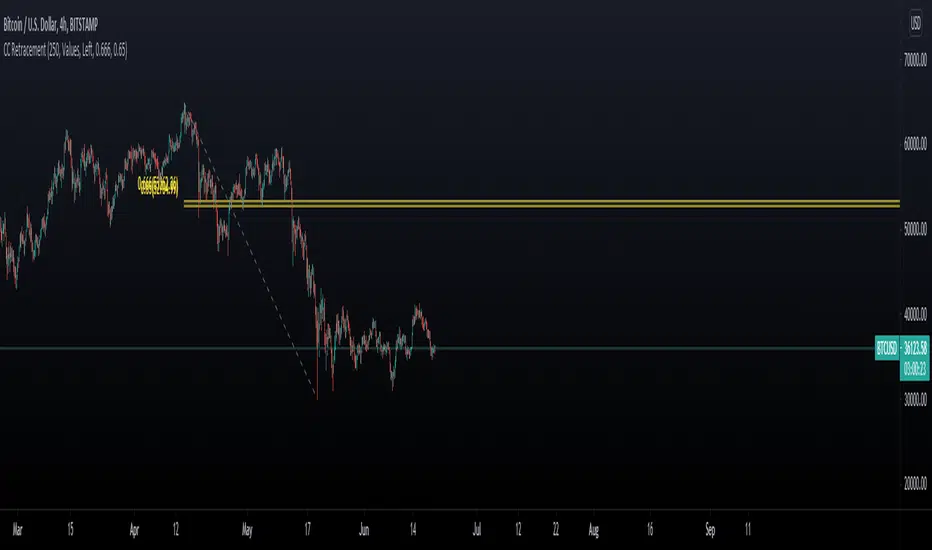
Chart Champions CC Pocket 0.65 -0.666 Fib levels or commonly know as the CC pocket
Marks Strong Support/Ressitance, Use with conflunce.
Lookback Length is adjustable
Let me know any suggestions or ideas which could help improve
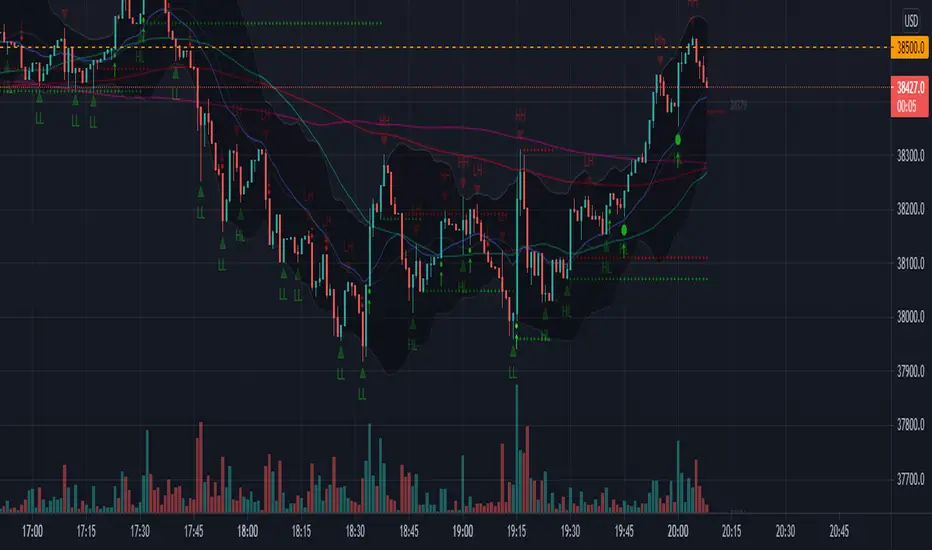
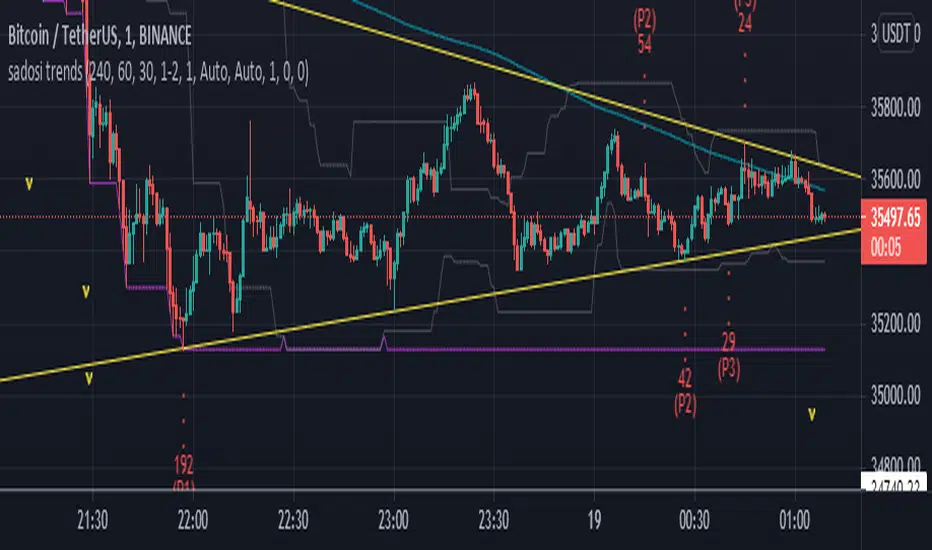
sadosi trends and barrierThis indicator should be used for give ideas.
what they can do?
draw up and down trend lines
draw support and resistance lines
to inform about the current price
signal for high and low prices
how can?
By analyzing the prices in the 3 selected periods, 3 highs and 3 lows prices are marked. With the marked points, trend and resistance lines are drawn. The current price is analyzed and useful calculations displayed in the info box. Finaly adding moving averages. After all these transactions, the trend and resistances become easily visible on the chart.
You can fine-tune the angle of the trend using high and low extensions
you can catch different trend lines by changing the high and low trend points
By changing the periods, you can set position the trend lines more accurately.
When the price is too low or too high, the information box will warn you by change color.
The trend lines to be created are for the purpose of giving an idea and convenience. It can be used on all timeframes, including horizontal trends.
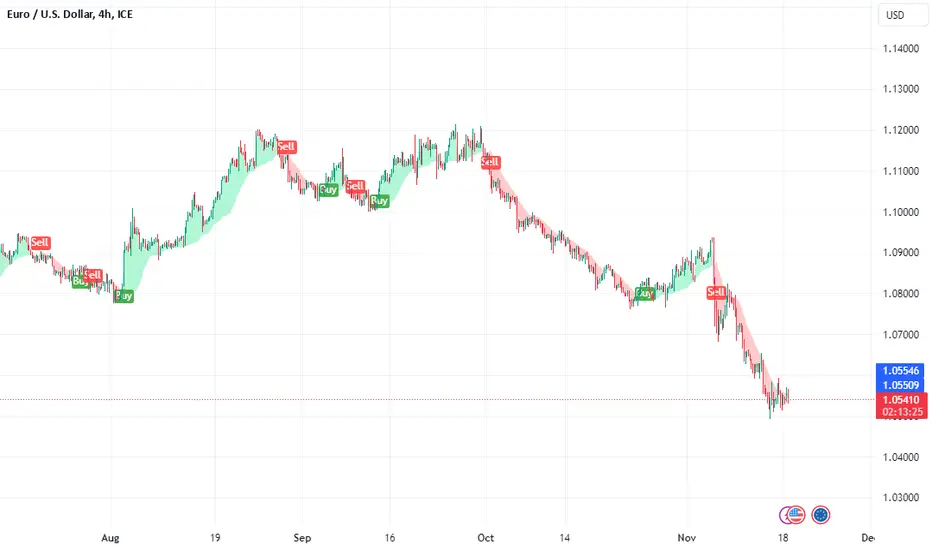
Fibonacci and Ema Trend + Pullback alerts This indicator tells you what to do with supports and resistances based on fibonacci with signs and alarms
and Ema 200 with buy or sell fast pullback alarms
When 0.5 is bear the price will seek to break the lower supports
sell from 0.5 to bear zone and obtain profits below the supports
stop loss above resistence
When 0.5 is bull the price will seek to break the highest resistances
buy from 0.5 to bull zone and profit above the resistances
stop loss below support
you can edit the indicator to have slower or faster levels if you want
The alarms that the indicator has :
Resistence down
Resistence up
Bull zone UP
Buy 0.5 Bull
Sell 0.5 Bear
Bear zone DOWN
Bear zone UP sell to 5.0 bear
Bull zone DOWN Buy to 0.5 bull
Support zone DOWN
Support zone UP
ema 200 pullback alerts
when price is going up active the buy fast pullback alarm
stop loss below ema 200 or support
when price is going Down active the sell fast pullback alarm
stop loss above ema 200 or resistence

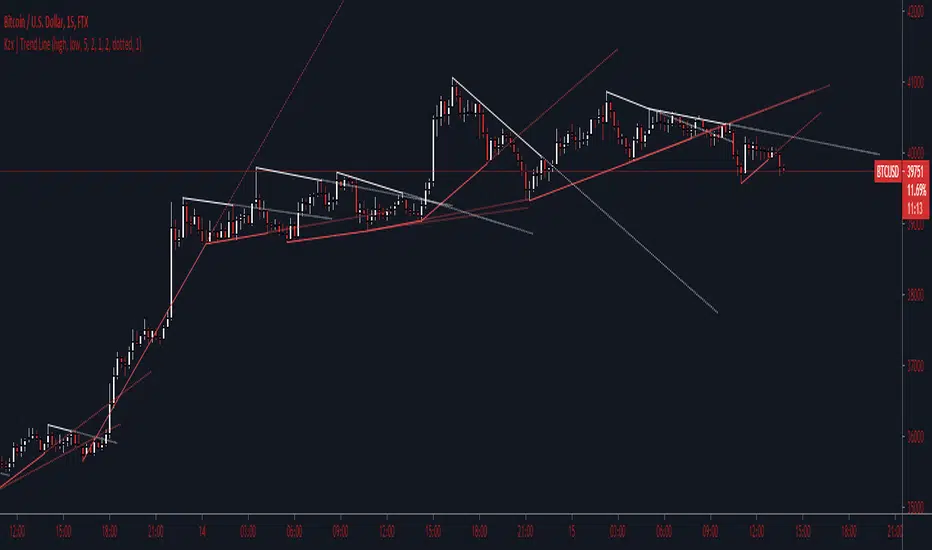
Kzx | Trend Linethe indicator traces the trend line corresponding to support / resistance.
it is also completely configurable, for various and varied results
Breakout FinderHelo All,
I got many requests for a Breakout script and here it's. This script searches the breakouts/breakdowns and draw square if there is one.
The options:
"Period" is used to find Pivot Points
"Max Breakout Length" is the maximum length to search breakouts
"Threshold Rate %" is channel width of the breakout area. calculated using highest/lowest of last 300 bars.
"Minimum Number of Tests" is the minimum number of tests that the Price tried to break the S/R level
and some options for coloring and linestyle
Lets see some examples:
in this example "Minimum Number of Tests" is 2 so the Price must have tested to break resistance area 2 times and then it breaks it as seen in the screenshot:
in following example Threshold rate is %10, so the channel width is very big:
as you can see in followinf screenshot you can choose different colors and line styles:
Alerts added ;)
Enjoy!

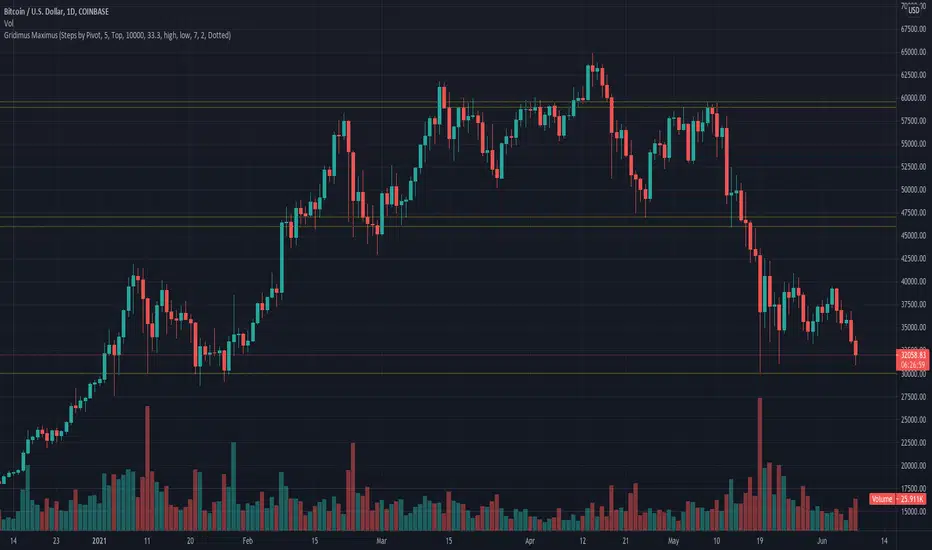
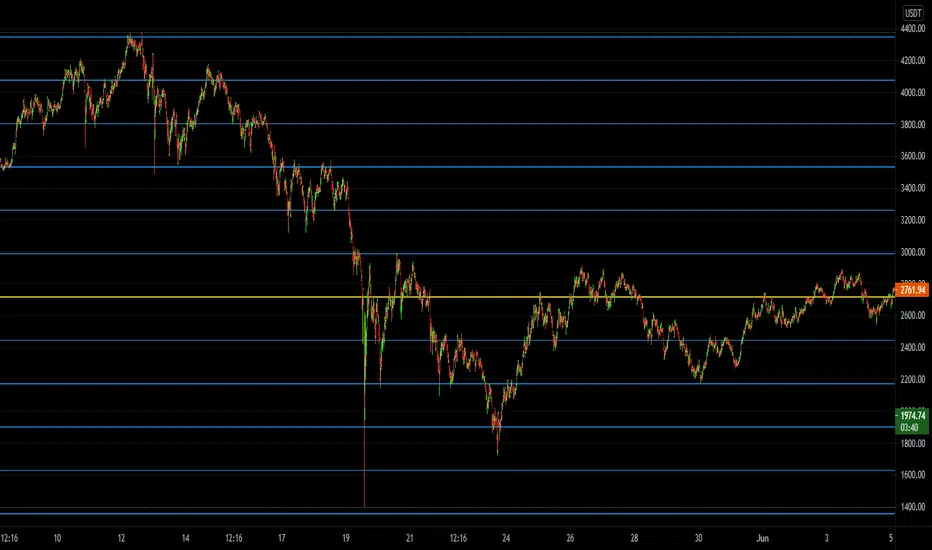
Gridimus MaximusGridimus Maximus draws N grid lines stepping by price or percent in chosen direction from set price, or draws N grid lines stepping by pivots.
The queue function method used is adapted from an example provided on the PineCoders website, much gratitude to LucF for this gem!
To prevent grid lines out of range from causing chart to rescale right click on chart's price column and enable Scale Price Chart Only.
Pictured example above is using Type Of Increment: Steps By Pivot, Number Of Steps: 5.
Pictured example below is using Type Of Increment: Steps By Price, Number Of Steps: 6, Starts From Price: $10k, Steps By Percent Or Price: $10k.
Pictured example below is using Type Of Increment: Steps By Percent, Number Of Steps: 7, Starts From Price: $10k, Steps By Percent Or Price: 33%.
NOTICE: This is an example script and not meant to be used as an actual strategy. By using this script or any portion thereof, you acknowledge that you have read and understood that this is for research purposes only and I am not responsible for any financial losses you may incur by using this script!