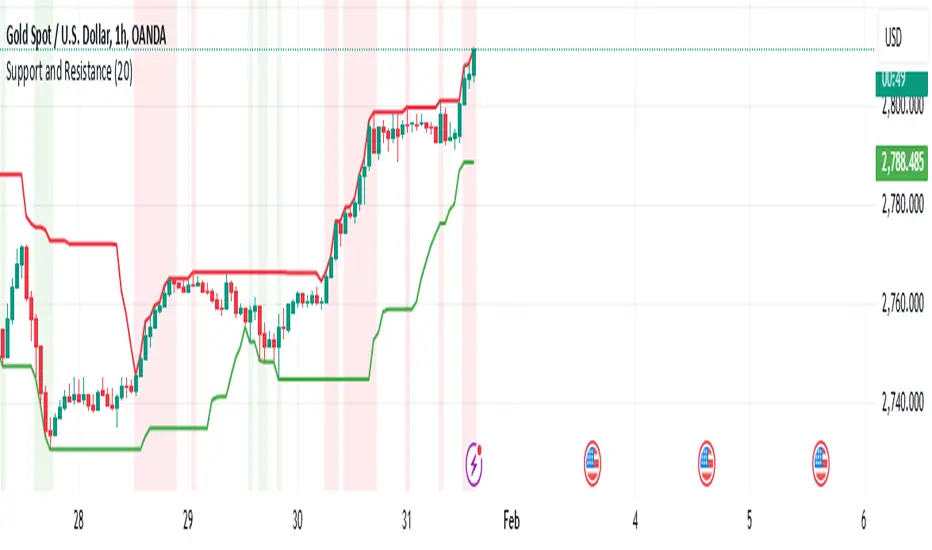
Support and Resistancelookback: This input allows you to specify the number of bars to look back to calculate the support and resistance levels.
support: This is calculated as the lowest low over the specified lookback period.
resistance: This is calculated as the highest high over the specified lookback period.
plot: The support and resistance levels are plotted on the chart with different colors.
bgcolor: This optional feature highlights the support and resistance zones with a semi-transparent background color.
Support
Swing High/Low (ZigZag) [ChartPrime]Swing High/Low (ZigZag) Indicator
The Swing High/Low (ZigZag) Indicator is a versatile tool for identifying and visualizing price swings, swing highs, and swing lows. It dynamically plots levels for significant price points while connecting them with a ZigZag line, enabling traders to analyze market structure and trends with precision.
⯁ KEY FEATURES
Swing Highs and Lows Detection
Accurately detects and marks swing highs and lows, providing a clear structure of market movements.
Real-Time ZigZag Line
Connects swing points with a dynamic ZigZag line for a visual representation of price trends.
Customizable Swing Sensitivity
Swing length input allows traders to adjust the sensitivity of swing detection to match their preferred market conditions.
Swing Levels with Shadows
Option to display swing levels with extended shadows for better visibility and market analysis.
Broken Levels Marking
Tracks and visually updates levels as dashed lines when broken, providing insights into shifts in market structure.
Swing Direction Display
At the top-right corner, the indicator displays the current swing direction (up or down) with a directional arrow for quick reference.
Interactive Labels
Marks swing levels with labels, showing the price of swing highs and lows for added clarity.
Dynamic Market Structure Analysis
Automatically adjusts ZigZag lines and levels as the market evolves, ensuring real-time updates for accurate trading decisions.
⯁ HOW TO USE
Analyze Market Trends
Use the ZigZag line and swing levels to identify the overall direction and structure of the market.
Spot Significant Price Points
Swing highs and lows act as potential support and resistance levels for trading opportunities.
Adjust Swing Sensitivity
Modify the swing length setting to match your trading strategy, whether scalping, day trading, or swing trading.
Monitor Broken Levels
Use the dashed lines of broken levels to identify changes in market dynamics and potential breakout or breakdown zones.
Plan Entries and Exits
Leverage swing levels and direction to determine optimal entry, stop-loss, and take-profit points.
⯁ CONCLUSION
The Swing High/Low (ZigZag) Indicator is a powerful tool for traders seeking to visualize price swings and market structure. Its real-time updates, customizable settings, and dynamic swing direction make it an invaluable resource for technical analysis and decision-making.

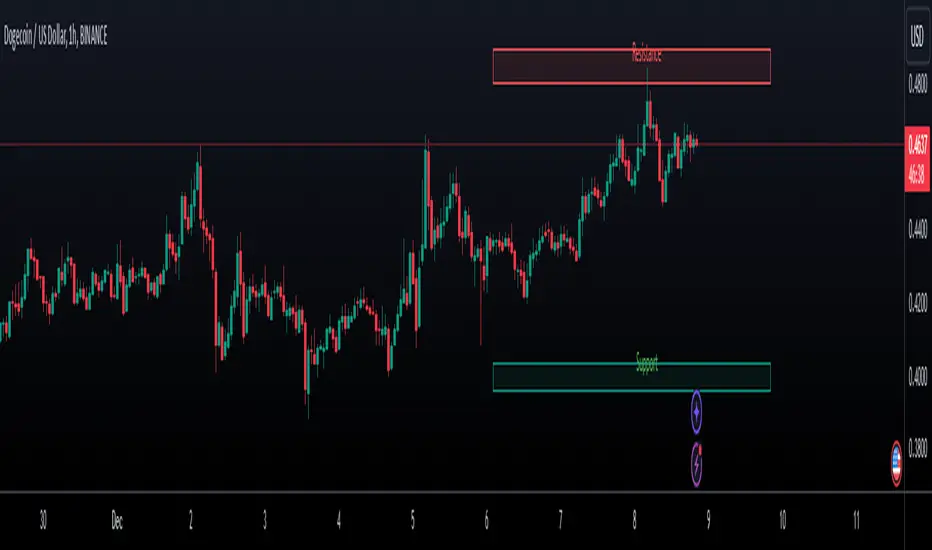
Custom Support LineIt is made with the following conditions in mind.
1. At the center of the candle at the moment,
Out of the last 10 candles, the low price (L) is within 3% of each other, drawing one line at the low prices of the candles.
2. Out of the last 10 candles, the market price (O) is within 3% of each other, drawing one line at the low end of each candle.
3.Out of the last 10 candles, the closing price (C) is within 3% of each other, and one line is drawn at the lower prices of the candles.
4. Draw one line when the three lines match the above three conditions.
We wanted to create a clear support line according to the above conditions.

JaT - Max/Min Labels ProDescription:
The JaT - Max/Min Labels Pro is a powerful and customizable tool designed for traders who want clear, precise, and visually appealing identification of local price extremes. This indicator dynamically detects local maxima and minima based on user-defined sensitivity and displays their values as labels directly on the chart.
Key Features:
Dynamic Extremes Detection: Automatically identifies local highs and lows using a user-configurable lookback period and sensitivity setting.
Customizable Label Offset: Allows you to position labels further away from the bars for enhanced visibility.
Clear Visualization: Labels are color-coded for clarity:
Green for Highs: Transparent green text (50% opacity) displayed above the bar.
Red for Lows: Transparent red text (50% opacity) displayed below the bar.
Efficient Performance: Utilizes optimized Pine Script arrays to manage labels dynamically and avoid clutter.
User-Friendly: Simple configuration with adjustable parameters for lookback period, sensitivity, and label offset.
Parameters:
Lookback Period: Defines the range of bars to analyze for extremes.
Sensitivity: Adjusts the smoothing level for extreme detection using a moving average.
Label Offset: Controls the vertical distance of labels from the bar, ensuring they are easy to read without overlapping.
Who is it for?
This indicator is ideal for traders who rely on technical analysis to spot potential reversal points, breakout levels, or key support/resistance zones. Whether you're a day trader, swing trader, or long-term investor, the JaT - Max/Min Labels Pro provides an elegant and practical solution for enhancing your charting workflow.
How to Use:
Add the indicator to your chart.
Configure the settings to suit your trading style:
Adjust the Lookback Period to define how far back the indicator analyzes.
Set the Sensitivity to control how frequently highs and lows are detected.
Use the Label Offset to adjust label placement for better visibility.
Observe the dynamically generated labels highlighting price extremes.
Feel free to tweak or expand this description if you'd like to emphasize other features or include additional instructions. Let me know if there's anything else you'd like to add or adjust! 😊

Xmaster Formula Indicator [TradingFinder] No Repaint Strategies🔵 Introduction
The Xmaster Formula Indicator is a powerful tool for forex trading, combining multiple technical indicators to provide insights into market trends, support and resistance levels, and price reversals. Developed in the early 2010s, it is widely valued for generating reliable buy and sell signals.
Key components include Exponential Moving Averages (EMA) for identifying trends and price momentum, and MACD (Moving Average Convergence Divergence) for analyzing trend strength and direction.
The Stochastic Oscillator and RSI (Relative Strength Index) enhance accuracy by signaling potential price reversals. Additionally, the Parabolic SAR assists in identifying trend reversals and managing risk.
By integrating these tools, the Xmaster Formula Indicator provides a comprehensive view of market conditions, empowering traders to make informed decisions.
🔵 How to Use
The Xmaster Formula Indicator offers two distinct methods for generating signals: Standard Mode and Advance Mode. Each method caters to different trading styles and strategies.
Standard Mode :
In Standard Mode, the indicator uses normalized moving average data to generate buy and sell signals. The difference between the short-term (10-period) and long-term (38-period) EMAs is calculated and normalized to a 0-100 scale.
Buy Signal : When the normalized value crosses above 55, accompanied by the trend line turning green, a buy signal is generated.
Sell Signal : When the normalized value crosses below 45, and the trend line turns red, a sell signal is issued.
This mode is simple, making it ideal for traders looking for straightforward signals without the need for additional confirmations.
Advance Mode :
Advance Mode combines multiple technical indicators to provide more detailed and robust signals.
This method analyzes trends by incorporating :
🟣 MACD
Buy Signal : When the MACD histogram bars are positive.
Sell Signal : When the MACD histogram bars are negative.
🟣 RSI
Buy Signal : When RSI is below 30, indicating oversold conditions.
Sell Signal : When RSI is above 70, suggesting overbought conditions.
🟣 Stochastic Oscillator
Buy Signal : When Stochastic is below 20.
Sell Signal : When Stochastic is above 80.
🟣 Parabolic SAR
Buy Signal : When SAR is below the price.
Sell Signal : When SAR is above the price.
A signal is generated in Advance Mode only when all these indicators align :
Buy Signal : All conditions point to a bullish trend.
Sell Signal : All conditions indicate a bearish trend.
This mode is more comprehensive and suitable for traders who prefer deeper analysis and stronger confirmations before executing trades.
🔵 Settings
Method :
Choose between "Standard" and "Advance" modes to determine how signals are generated. In Standard Mode, signals are based on normalized moving average data, while in Advance Mode, signals rely on the combination of MACD, RSI, Stochastic Oscillator, and Parabolic SAR.
Moving Average Settings :
Short Length : The period for the short-term EMA (default is 10).
Mid Length : The period for the medium-term EMA (default is 20).
Long Length : The period for the long-term EMA (default is 38).
MACD Settings :
Fast Length : The period for the fast EMA in the MACD calculation (default is 12).
Slow Length : The period for the slow EMA in the MACD calculation (default is 26).
Signal Line : The signal line period for MACD (default is 9).
Stochastic Settings :
Length : The period for the Stochastic Oscillator (default is 14).
RSI Settings :
Length : The period for the Relative Strength Index (default is 14).
🔵 Conclusion
The Xmaster Formula Indicator is a versatile and reliable tool for forex traders, offering both simplicity and advanced analysis through its Standard and Advance modes. In Standard Mode, traders benefit from straightforward signals based on normalized moving average data, making it ideal for quick decision-making.
Advance Mode, on the other hand, provides a more detailed analysis by combining multiple indicators like MACD, RSI, Stochastic Oscillator, and Parabolic SAR, delivering stronger confirmations for critical market decisions.
While the Xmaster Formula Indicator offers valuable insights and reliable signals, it is important to use it alongside proper risk management and other analytical methods. By leveraging its capabilities effectively, traders can enhance their trading strategies and achieve better outcomes in the dynamic forex market.

NPT Levels GeneratorNPT Levels Generator
Description:
The NPT Levels Generator is a custom indicator designed to draw horizontal lines at specific price levels on the chart. It helps traders identify key levels of interest, making it easier to analyze price action and plan trades.
The indicator takes a manually defined Base Price as the central reference point and then generates a series of horizontal lines above and below it at equal intervals. The number of lines and the distance between them are fully customizable through the settings panel.
This tool is particularly useful for identifying support and resistance levels, pivot zones, or any other significant price levels for technical analysis.
Features:
-Customizable Base Price: Define the central level manually.
- Adjustable Line Distance: Set the spacing between each horizontal line.
- Flexible Number of Lines: Choose how many lines to display above and below the base price.
- Custom Line Appearance: Configure the color and thickness of the lines.
This indicator is ideal for traders using price levels as a core part of their strategy, offering flexibility and clarity in visualizing key areas of interest.

Dynamic Support and Resistance Pivot Strategy The Dynamic Support and Resistance Pivot Strategy is a flexible and adaptive tool designed to identify short-term support and resistance levels using the concept of price pivots.
### Key Elements of the Strategy
1. Pivot points as support and resistance levels
Pivots are significant turning points on the price chart, often marking local highs and lows where the price has reversed direction. A pivot high occurs when the price forms a local peak, while a pivot low occurs when the price forms a local trough. When a new pivot high is formed, it creates a resistance level. Conversely, when a new pivot low is formed, it creates a support level.
The strategy continuously updates these levels as new pivots are detected, ensuring they remain relevant to the current market conditions. By identifying these price levels, the strategy dynamically adjusts to market conditions, allowing it to adapt to both trending and ranging markets, since it has a long target and can perform reversal operations.
2. Entry Criteria
- Buy (Long): A long position is triggered when the price is near the support level and then crosses it from below to above. This suggests that the price has found support and may start moving upwards.
- Sell (Short): A short position is triggered when the price is near the resistance level and then crosses it from above to below. This indicates that the price may be reversing and moving downward.
3. Support/Resistance distance (%)
- This parameter establishes a percentage range around the identified support and resistance level. For example, if the Support Resistance Distance is 0.4% (default), the closing price must be within a range of 0.4% above support or below the resistance to be considered "close" and trigger a trade.
4. Exit criteria
- Take profit = 27 %
- Stop loss = 10 %
- Reversal if a new entry point is identified in the opposite direction
5. No Repainting
- The Dynamic Support and Resistance Pivot Strategy is not subject to repainting.
6. Position Sizing by Equity and risk management
- This strategy has a default configuration to operate with 35% of the equity. The stop loss is set to 10% from the entry price. This way, the strategy is putting at risk about 10% of 35% of equity, that is, around 3.5% of equity for each trade. The percentage of equity and stop loss can be adjusted by the user according to their risk management.
7. Backtest results
- This strategy was subjected to backtest and operations in replay mode on **1000000MOGUSDT.P**, with the inclusion of transaction fees at 0.12% and slipagge of 5 ticks, and the past results have shown consistent profitability. Past results are no guarantee of future results. The strategy's backtest results may even be due to overfitting with past data.
8. Chart Visualization
- Support and resistance levels are displayed as green (support) and red (resistance) lines.
- Pivot prices are displayed as green (pivot low) and red (pivot high) labels.
In this image above, the Support/Resistance distance (%) parameter was set to 0.8.
9. Default Configuration
Chart Timeframe: 1h
Pivot Lengh: 2
Support/Resistance distance (%): 0.4*
Stop Loss: 10 %
Take Profit: 27 %
* This parameter can alternatively be set to 0.8.
10. Alternative Configuration
Chart Timeframe: 20 min
Pivot Lengh: 4
Support/Resistance distance (%): 0.1
Stop Loss: 10 %
Take Profit: 25 %
BYBIT:1000000MOGUSDT.P

Nen Star Harmonic Pattern [TradingFinder] NenStar Reversal Auto🔵 Introduction
The Nen-Star Harmonic Pattern is an advanced reversal pattern in technical analysis, designed to identify market trend changes and predict key price reversal points. This pattern is defined by a combination of Fibonacci ratios and critical concepts such as Potential Reversal Zones (PRZ), market structure, and corrective waves.
The key points of this pattern include X, A, B, C, and D, and it appears in both bullish and bearish forms. In its bullish form, the pattern resembles the letter M, while in its bearish form, it takes the shape of W. The critical Fibonacci ratios for this pattern are 0.382 to 0.786 for the XA wave, 1.13 to 1.414 for the AB wave, and 1.272 to 2.618 for the BC wave.
The Nen-Star Harmonic Pattern is one of the most precise tools for identifying market reversals and executing reversal trades. Traders can use it to pinpoint optimal entry and exit points and benefit from high risk-to-reward ratios.
By emphasizing Fibonacci retracement levels, XABCD waves, the formation of bullish and bearish patterns, and precise trade entry points, this pattern has become a practical tool in advanced technical analysis.
Bullish Nen-Star Pattern :
Bearish Nen-Star Pattern :
🔵 How to Use
The Nen-Star Harmonic Pattern indicator allows traders to automatically identify the bullish and bearish structures of this pattern and locate optimal entry and exit points. By accurately analyzing Fibonacci ratios and determining points X, A, B, C, and D, the indicator highlights Potential Reversal Zones (PRZ) on the chart. Traders can rely on the generated signals to manage their trades with greater precision.
🟣 Bullish Nen-Star Pattern
The bullish Nen-Star pattern begins with a price increase from point X to point A, followed by a retracement to point B, which lies between 0.382 and 0.786 of the XA wave.
After this retracement, the price moves to point C, located between 1.13 and 1.414 of the AB wave. The final movement is a price decline to point D, which is between 1.272 and 2.618 of the BC wave and 1.13 to 1.272 of the XA wave.
Point D : Serves as the key Potential Reversal Zone (PRZ).
Entry : A buy trade is initiated at point D, signaling the end of the corrective movement and the beginning of a price increase.
Price Targets :
61.8% retracement of the CD wave
Point A
Point C
1.272 and 1.618 extensions of the CD wave if resistance at point C is broken
Stop Loss : Placed slightly below point D.
🟣 Bearish Nen-Star Pattern
The bearish Nen-Star pattern starts with a price decrease from point X to point A, followed by a retracement to point B, which lies between 0.382 and 0.786 of the XA wave.
After this retracement, the price moves to point C, located between 1.13 and 1.414 of the AB wave. The final movement is a price increase to point D, which is between 1.272 and 2.618 of the BC wave and 1.13 to 1.272 of the XA wave.
Point D : Serves as the key Potential Reversal Zone (PRZ).
Entry : A sell trade is initiated at point D, signaling the end of the corrective movement and the beginning of a price decline.
Price Targets :
61.8% retracement of the CD wave
Point A
Point C
1.272 and 1.618 extensions of the CD wave if support at point C is broken
Stop Loss : Placed slightly above point D.
🔵 Setting
🟣 Logical Setting
ZigZag Pivot Period : You can adjust the period so that the harmonic patterns are adjusted according to the pivot period you want. This factor is the most important parameter in pattern recognition.
Show Valid Forma t: If this parameter is on "On" mode, only patterns will be displayed that they have exact format and no noise can be seen in them. If "Off" is, the patterns displayed that maybe are noisy and do not exactly correspond to the original pattern.
Show Formation Last Pivot Confirm : if Turned on, you can see this ability of patterns when their last pivot is formed. If this feature is off, it will see the patterns as soon as they are formed. The advantage of this option being clear is less formation of fielded patterns, and it is accompanied by the latest pattern seeing and a sharp reduction in reward to risk.
Period of Formation Last Pivot : Using this parameter you can determine that the last pivot is based on Pivot period.
🟣 Genaral Setting
Show : Enter "On" to display the template and "Off" to not display the template.
Color : Enter the desired color to draw the pattern in this parameter.
LineWidth : You can enter the number 1 or numbers higher than one to adjust the thickness of the drawing lines. This number must be an integer and increases with increasing thickness.
LabelSize : You can adjust the size of the labels by using the "size.auto", "size.tiny", "size.smal", "size.normal", "size.large" or "size.huge" entries.
🟣 Alert Setting
Alert : On / Off
Message Frequency : This string parameter defines the announcement frequency. Choices include: "All" (activates the alert every time the function is called), "Once Per Bar" (activates the alert only on the first call within the bar), and "Once Per Bar Close" (the alert is activated only by a call at the last script execution of the real-time bar upon closing). The default setting is "Once per Bar".
Show Alert Time by Time Zone : The date, hour, and minute you receive in alert messages can be based on any time zone you choose. For example, if you want New York time, you should enter "UTC-4". This input is set to the time zone "UTC" by default.
🔵 Conclusion
The Nen-Star Harmonic Pattern is a highly effective analytical tool in global financial markets, playing a crucial role in identifying reversal points and market trend changes. By leveraging Fibonacci principles and price structure, this pattern enables precise analysis across various assets, including stocks, cryptocurrencies, forex, and commodities.
Traders operating in global markets can use this pattern to identify high risk-to-reward trading opportunities. Its clear entry and exit points, defined Potential Reversal Zones (PRZ), and accurate price targets make it an excellent tool for risk management and profitability enhancement.
In the global context, the Nen-Star pattern is widely used by professional analysts in both advanced and emerging markets due to its versatility in analyzing long-term and short-term charts. Beyond trend prediction, it enhances trading strategies and optimizes investment decisions.
Combining this pattern with complementary tools such as volume analysis, technical indicators, and macroeconomic conditions can provide traders with deeper market insights, helping them capitalize on global opportunities.

Liquitive Buy/Sell Dollar AveragerLiquitive Buy/Sell Dollar Averager Indicator
The "Liquitive Buy/Sell Dollar Averager" is a versatile trading tool designed for intraday and multi-timeframe analysis, combining advanced range-bound calculations, RSI normalization, volume spikes, and candle pattern recognition to identify optimal buy and sell conditions. This indicator is particularly suitable for traders employing strategies that focus on dollar-cost averaging, position scaling, and systematic buy/sell decision-making.
Key Features:
Adaptive RSI-Based Levels:
Dynamically calculates inner bounds (IB) and outer bounds (OB) using RSI and price ranges, helping to identify overbought and oversold conditions relative to the price action.
Normalizes RSI values to the price range for seamless visualization overlaid on the chart.
Volume and Candle Analysis:
Detects significant volume spikes relative to a moving average, signaling increased market activity.
Identifies spiking green/red candles to capture momentum-driven price movements.
Dynamic Support and Resistance:
Calculates and plots support and resistance levels based on recent swing highs and lows.
Median and boundary lines help visualize key price levels for decision-making.
Profitability Check:
Buy and Sell Signals:
Checks profitability thresholds based on percentage gains/losses.
Incorporates logic for "time to buy" and "time to sell" using target profit margins.
Implements average move percentage to define realistic thresholds for buy/sell actions.
Time-Based Trading Restrictions:
Configures trading logic to disallow trades after a specific time (e.g., 3:40 PM for intraday sessions).
Ensures logical entry and exit decisions are only made within active trading hours.
Color-Coded Visualization:
Background colors dynamically shift between green (bullish), red (bearish), and neutral, depending on RSI and price position relative to the inner bounds.
Opacity of the background adjusts based on normalized RSI differences to provide a visual cue of market strength.
Customizable Parameters:
Allows user input for key settings like lookback periods, RSI length, percent ranges, volume thresholds, and transparency levels, enabling flexible configuration tailored to individual strategies.
Actionable Alerts and Signals:
Plots "Open Position", "Add to Position", and "Close Position" markers directly on the chart, making it easy to follow systematic trading rules.
How It Works:
Buy Signals:
Triggered when price conditions, volume spikes, and RSI-based thresholds align with profitability metrics.
Designed for dollar-cost averaging, identifying opportunities to add to long positions or open new positions.
Sell Signals:
Evaluates profitability conditions to identify when to close or scale out of positions.
Incorporates real-time evaluation of market momentum and profitability.

Support Resistance Major/Minor [TradingFinder] Market Structure🔵 Introduction
Support and resistance levels are key concepts in technical analysis, serving as critical points where prices pause or reverse due to the interaction of supply and demand. These foundational elements in price action and classical technical analysis assist traders in understanding market behavior and making better trading decisions.
Support levels are zones where demand is strong enough to prevent further price declines, while resistance levels act as barriers that hinder price increases.
Support and resistance levels are divided into two main types: static and dynamic. Static levels are fixed horizontal lines on charts, formed based on historical price points, and are crucial due to repeated price reactions in these areas.
Dynamic levels, on the other hand, move with market trends and are often identified using tools like moving averages and trendlines. These levels are particularly useful for analyzing dynamic trends and identifying potential reversal points in financial markets.
The importance of support and resistance in technical analysis lies in their ability to pinpoint price reversal or continuation points. Professional traders use these levels to determine optimal entry and exit points and combine them with tools such as Fibonacci retracements or moving averages for precise strategies.
Detailed analysis of price behavior at these levels provides insights into trend strength and the likelihood of price breaks or reversals. By understanding these concepts, technical analysts can forecast future price movements and optimize their trading decisions using tools such as indicators and price action. Support and resistance levels, as a cornerstone of technical analysis, form the foundation for many trading strategies.
🔵 How to Use
The Static Support and Resistance Indicator is a vital tool for identifying significant price zones in financial markets. It automatically detects major and minor support and resistance levels in both short-term and long-term intervals, enabling traders to analyze price behavior accurately and develop optimal entry and exit strategies.
🟣 Major Long-Term Support and Resistance
Major Long-Term Support : The lowest price points recorded over long-term intervals that prevent further declines.
Major Long-Term Resistance : The highest price points in long-term intervals that limit further price increases.
🟣 Minor Long-Term Support and Resistance
Minor Long-Term Support : Temporary halts in price decline within a downtrend over long-term intervals.
Minor Long-Term Resistance : Short-term zones within long-term intervals where prices react negatively in an uptrend.
🟣 Major Short-Term Support and Resistance
Major Short-Term Support : The lowest price points in short-term intervals that act as barriers against sharp price drops.
Major Short-Term Resistance : The highest points in short-term intervals that prevent further price surges.
🟣 Minor Short-Term Support and Resistance
Minor Short-Term Support : Temporary halts in price decline within short-term downtrends.
Minor Short-Term Resistance : Zones where price reacts quickly and reverses in short-term uptrends.
🔵 Settings
Long Term S&R Pivot Period : Defines the interval for identifying long-term support and resistance levels (default: 21).
Short Term S&R Pivot Period : Defines the interval for identifying short-term support and resistance levels (default: 5).
🟣 Long-Term Lines
Major Line Display : Enable/disable major long-term lines.
Minor Line Display : Enable/disable minor long-term lines.
Major Line Colors : Green for support, red for resistance (long-term major levels).
Minor Line Colors : Light green for support, light red for resistance (long-term minor levels).
Major Line Style : Choose between solid, dotted, or dashed lines for major long-term levels.
Minor Line Style : Choose between solid, dotted, or dashed lines for minor long-term levels.
Major Line Width : Adjust the thickness of major long-term lines.
Minor Line Width : Adjust the thickness of minor long-term lines.
🟣 Short-Term Lines
Major Line Display : Enable/disable major short-term lines.
Minor Line Display : Enable/disable minor short-term lines.
Major Line Colors : Gray-green for support, gray-red for resistance (short-term major levels).
Minor Line Colors : Dark green for support, dark red for resistance (short-term minor levels).
Major Line Style : Choose between solid, dotted, or dashed lines for major short-term levels.
Minor Line Style : Choose between solid, dotted, or dashed lines for minor short-term levels.
Major Line Width : Adjust the thickness of major short-term lines.
Minor Line Width : Adjust the thickness of minor short-term lines.
🔵 Conclusion
Static support and resistance levels are among the most critical tools in technical analysis, helping traders identify key reversal or continuation points.
This indicator simplifies and enhances the analysis process by automatically detecting major and minor levels in both short-term and long-term intervals. It allows traders to customize settings to suit their trading strategies and analyze different market levels effectively.
Using this indicator improves price action analysis, enhances market understanding, and identifies trading opportunities. Applicable to all trading styles, from day trading to long-term investing, it is an essential tool for technical analysis.
Combining this indicator with other tools like trendlines, Fibonacci retracements, and moving averages enables comprehensive analysis and allows traders to navigate financial markets with greater confidence.

Supports and Resistances Multi Timeframe - VK TradingThe Supports and Resistances Multi Timeframe - VK Trading indicator is designed to help traders identify key support and resistance levels across multiple timeframes. It integrates real-time market data with smooth, customizable visual markers, allowing traders to quickly spot potential entry and exit points. This tool is particularly valuable for trend-following traders who want to see the most critical levels of price action on various timeframes.
Features:
Multi-Timeframe Support: Display support and resistance levels for the current, first, and second timeframes, helping traders identify price points across different market cycles.
Customizable Appearance: Choose from various colors for levels and bands, as well as transparency settings to match your chart's design.
ATR-based Bands: Uses the Average True Range (ATR) to dynamically adjust the width of support and resistance bands, offering more accurate price movement insights.
Pivot Points: Identifies pivot highs and lows, offering precise support and resistance levels based on the price action.
Smoothing Options: Customize the ATR smoothing method with options like RMA, SMA, EMA, and WMA for better alignment with your trading strategy.
Functionalities:
Quick Level Detection: The indicator highlights the most recent high and low levels on the current timeframe, ensuring you’re always aware of nearby price barriers.
Support and Resistance Visualization: Easily visualize the major support and resistance levels on multiple timeframes, improving decision-making and trade management.
Dynamic Band Widths: Customize the ATR multiplier for each timeframe, adapting the support and resistance bands based on the volatility of the market.
Multi-Timeframe Integration: View price action levels from a broader perspective with support and resistance data from the current, first, and second timeframes all in one chart.
Flexible Timeframe Selection: Choose your preferred timeframes for support and resistance levels, from daily, weekly, to monthly, for broader or narrower market views.
How it Helps Traders:
This indicator is ideal for traders who rely on multi-timeframe analysis to make well-informed trading decisions. By visualizing key support and resistance levels across several timeframes, traders can improve the precision of their entries and exits, better manage risk, and enhance their market timing. The tool provides a comprehensive view of price action, allowing traders to spot potential reversals and breakouts, making it easier to execute strategies effectively.
Disclaimer:
This script is an educational and analytical tool. It does not guarantee specific results or eliminate trading risk. Trading in the financial markets involves significant risks; use this script at your own risk.

BK BB Horizontal LinesIndicator Description:
I am incredibly proud and excited to share my second indicator with the TradingView community! This tool has been instrumental in helping me optimize my positioning and maximize my trades.
Bollinger Bands are a critical component of my trading strategy. I designed this indicator to work seamlessly alongside my previously introduced tool, "BK MA Horizontal Lines." This indicator focuses specifically on the Daily Bollinger Bands, applying horizontal lines to the bands which is displayed in all timeframes. The Daily bands in my opinion hold a strong significance when it comes to support and resistance, knowing your current positioning and maximizing your trades. The settings are fully adjustable to suit your preferences and trading style.
If you find success with this indicator, I kindly ask that you give back in some way through acts of philanthropy, helping others in the best way you see fit.
Good luck to everyone, and always remember: God gives us everything. May all the glory go to the Almighty!

Pivot High/Low [s3]This is a technical analysis tool that identifies significant price pivot points (highs and lows) in the market. It looks for both major and minor pivot points, which can help traders identify potential support and resistance levels, trend reversals, and breakout opportunities.
How Pivot Points Are Calculated:
The indicator uses a straightforward "higher than everything around it" or "lower than everything around it" approach:
For Pivot Highs:
- The indicator looks at a specific bar and compares it to bars before and after it
- For a major pivot high: It checks 50 bars to the left and 20 bars to the right
- If the bar's high price is higher than ALL bars within this range, it's marked as a pivot high
- Think of it like a mountain peak - it needs to be the highest point compared to everything around it
For Pivot Lows:
- Same concept but reversed - looking for valleys instead of peaks
- Checks the same ranges (50 left, 20 right)
- The bar's low price must be lower than ALL surrounding bars
- Like finding the bottom of a valley - it needs to be the lowest point in the area
Key Features:
1. Two types of pivot points:
- Major pivots (using longer lookback periods of 50 bars left, 20 bars right)
- Minor pivots (using half the lookback periods - 25 left, 10 right)
2. Visual elements:
- Triangle markers above/below bars for pivot points
- Dotted lines extending from pivot points
- Color coding: Green for lows (support), Red for highs (resistance)
- Major pivots are more prominent than minor pivots
3. Customizable alerts for:
- Formation of new pivot points
- Breakouts above/below pivot levels
Trading Applications:
1. Support and Resistance:
- Major pivot levels act as strong support (lows) and resistance (highs)
- Multiple touches of these levels increase their significance
- Minor pivots can indicate intermediate support/resistance levels
2. Trend Analysis:
- Higher highs and higher lows = Uptrend
- Lower highs and lower lows = Downtrend
- Breaking of major pivot levels can signal trend changes
3. Entry/Exit Signals:
- Long entries: When price bounces off major pivot lows
- Short entries: When price rejects from major pivot highs
- Take profits: At opposite pivot levels
- Stop losses: Just beyond the entry pivot level
4. Breakout Trading:
- Breaking above major pivot highs suggests bullish momentum
- Breaking below major pivot lows suggests bearish momentum
- Use the alert system to catch breakouts early
Settings Customization:
- Adjust lookback periods based on your timeframe
- Toggle visibility of markers and lines
- Customize colors for better visibility
- Enable/disable specific types of alerts
Risk Management Tips:
1. Don't rely solely on pivot points - combine with other indicators
2. Wait for confirmation of bounces/rejections before entering trades
3. Use proper position sizing based on stop loss placement
4. Consider market context and overall trend when trading pivot levels
This indicator is particularly useful for swing traders and position traders who focus on key market turning points and trend changes. It helps identify significant price levels where the market has previously shown reaction, making it valuable for both trend following and counter-trend strategies.

Multi-Timeframe Liquidity LevelsMulti-Timeframe Liquidity Levels – Overview
The Multi-Timeframe Liquidity Levels indicator automatically displays significant highs and lows from various timeframes (Daily, Weekly, Monthly, and Quarterly) on your current chart. This allows traders to quickly identify potential support and resistance zones without frequently switching between different timeframe charts. Additionally, the script offers extra lines for special reference points (e.g., the “Midnight” midpoint of the current day and the previous day’s open/close) to highlight potential liquidity zones even more clearly.
1. Core Idea and Benefits
Time-Saving: Instead of manually reviewing charts in different timeframes, the indicator fetches relevant high/low levels automatically and shows them on your active timeframe.
Clear Layout: Traders instantly see where the Daily, Weekly, Monthly, and Quarterly highs and lows lie—areas often associated with institutional orders or liquidity hunts.
Customizable: You can tailor the color scheme, line style (Solid, Dashed, Dotted), and line width, ensuring the displayed levels fit your personal charting style.
2. How It Works
Multi-Timeframe High/Low
For each timeframe (Day, Week, Month, Quarter), the indicator references the previous candle’s high and low (high , low ).
Using request.security(...), these values are plotted on the chart you’re currently viewing.
Flexible Display
You can individually enable or disable the Daily, Weekly, Monthly, and Quarterly lines, depending on which levels are most relevant to your trading.
With Line Style (Solid, Dashed, Dotted) and Line Width, you can easily emphasize certain lines you consider more important.
Additional Lines
“Midnight” Line: A theoretical midpoint between today’s high and low, which can be useful for gauging daily pivot areas.
Previous Day’s Open/Close: Many traders track these reference points to anticipate market reactions. You can show or hide these lines as desired.
Automatic Line Removal & Creation
When a particular timeframe (e.g., “Show Monthly Levels”) is disabled, the script automatically removes the existing monthly lines.
Enabling it again recreates those lines without hassle.
3. Usage and Interpretation
Identifying Support and Resistance
Highs and lows from higher timeframes are often key zones for entries, exits, or major market reactions.
A Daily level may be crucial for short-term traders, whereas Monthly or Quarterly levels can indicate long-term liquidity areas.
Spotting Market Shifts
If price decisively moves above a Higher-Timeframe line, it could signal strong momentum.
Conversely, a failed breakout (where price quickly returns under or above a level) might warn of a potential reversal.
Extra Lines as Filters
The “Midnight” Line helps visualize a rough central price for the current day, aiding in intraday directional bias.
Previous Day’s Open/Close: Common reference points for day traders, where swift approaches and rejections can indicate potential entries or partial take-profit zones.
4. Practical Tips
Use Color-Coding Wisely: Assign distinct colors (e.g., Blue for Daily, Green for Weekly, Orange for Monthly, Purple for Quarterly) so you can easily discern which timeframe you’re looking at.
Toggle On/Off As Needed: Day traders might focus on Daily and Weekly, while long-term traders may pay closer attention to Monthly and Quarterly.
Combine with Price Action: Lines alone don’t constitute a trading strategy. Use them alongside candlestick patterns, volume analysis, or other indicators for a more complete market perspective.
5. Important Notes & Recommendations
Not Financial Advice: This indicator simply reflects historical high/low data across multiple timeframes and does not constitute a buy or sell recommendation.
Trader Responsibility: Observe how the market actually behaves around these lines and adapt your risk management accordingly.

BK MA Horizontal Lines
Indicator Description:
I am incredibly proud and excited to share my first indicator with the TradingView community! This tool has been instrumental in helping me optimize my positioning and maximize my trades.
Moving Averages (MAs) are among the top three most crucial indicators for trading, and I believe that the Daily, Weekly, and Monthly MAs are especially critical. The way I’ve designed this indicator allows you to combine MAs from your Daily timeframe with one or two from the Weekly or Monthly timeframes, depending on what is most relevant for the specific product or timeframe you’re analyzing.
For optimal use, I recommend:
Spacing your chart about 11 spaces from the right side.
Setting the Labels at 10 in the indicator configuration.
Keeping the line thickness at size 1, while using size 2 for my other indicator, "BK BB Horizontal Lines", which follows a similar concept but applies to Bollinger Bands.
If you find success with this indicator, I kindly ask that you give back in some way through acts of philanthropy, helping others in the best way you see fit.
Good luck to everyone, and always remember: God gives us everything. May all the glory go to the Almighty!

Volume Delta Candles HTF [TradingFinder] LTF Volume Candles 🔵 Introduction
In financial markets, understanding the concepts of supply and demand and their impact on price movements is of paramount importance. Supply and demand, as fundamental pillars of economics, reflect the interaction between buyers and sellers.
When buyers' strength surpasses that of sellers, demand increases, and prices tend to rise. Conversely, when sellers dominate buyers, supply overtakes demand, causing prices to drop. These interactions play a crucial role in determining market trends, price reversal points, and trading decisions.
Volume Delta Candles offer traders a practical way to visualize trading activity within each candlestick. By integrating data from lower timeframes or live market feeds, these candles eliminate the need for standalone volume indicators.
They present the proportions of buying and selling volume as intuitive colored bars, making it easier to interpret market dynamics at a glance. Additionally, they encapsulate critical metrics like peak delta, lowest delta, and net delta, allowing traders to grasp the market's internal order flow with greater precision.
In financial markets, grasping the interplay between supply and demand and its influence on price movements is crucial for successful trading. These fundamental economic forces reflect the ongoing balance between buyers and sellers in the market.
When buyers exert greater strength than sellers, demand dominates, driving prices upward. Conversely, when sellers take control, supply surpasses demand, and prices decline. Understanding these dynamics is essential for identifying market trends, pinpointing reversal points, and making informed trading decisions.
Volume Delta Candles provide an innovative method for evaluating trading activity within individual candlesticks, offering a simplified view without relying on separate volume indicators. By leveraging lower timeframe or real-time data, this tool visualizes the distribution of buying and selling volumes within a candle through color-coded bars.
This visual representation enables traders to quickly assess market sentiment and understand the forces driving price action. Buyer and seller strength is a critical concept that focuses on the ratio of buying to selling volumes. This ratio not only provides insights into the market's current state but also serves as a leading indicator for detecting potential shifts in trends.
Traders often rely on volume analysis to identify significant supply and demand zones, guiding their entry and exit strategies. Delta Candles translate these complex metrics, such as Maximum Delta, Minimum Delta, and Final Delta, into an easy-to-read visual format using Japanese candlestick structures, making them an invaluable resource for analyzing order flows and market momentum.
By merging the principles of supply and demand with comprehensive volume analysis, tools like the indicator introduced here offer unparalleled clarity into market behavior. This indicator calculates the relative strength of supply and demand for each candlestick by analyzing the ratio of buyers to sellers.
🔵 How to Use
The presented indicator is a powerful tool for analyzing supply and demand strength in financial markets. It helps traders identify the strengths and weaknesses of buyers and sellers and utilize this information for better decision-making.
🟣 Analyzing the Highest Volume Trades on Candles
A unique feature of this indicator is the visualization of price levels with the highest trade volume for each candlestick. These levels are marked as black lines on the candles, indicating prices where most trades occurred. This information is invaluable for identifying key supply and demand zones, which often act as support or resistance levels.
🟣 Trend Confirmation
The indicator enables traders to confirm bullish or bearish trends by observing changes in buyer and seller strength. When buyer strength increases and demand surpasses supply, the likelihood of a bullish trend continuation grows. Conversely, decreasing buyer strength and increasing seller strength may signal a potential bearish trend reversal.
🟣 Adjusting Timeframes and Calculation Methods
Users can customize the indicator's candlestick timeframe to align with their trading strategy. Additionally, they can switch between moving average and current candle modes to achieve more precise market analysis.
This indicator, with its accurate and visual data display, is a practical and reliable tool for market analysts and traders. Using it can help traders make better decisions and identify optimal entry and exit points.
🔵 Settings
Lower Time Frame Volume : This setting determines which timeframe the indicator should use to identify the price levels with the highest trade volume. These levels, displayed as black lines on the candlesticks, indicate prices where the most trades occurred.
It is recommended that users align this timeframe with their primary chart’s timeframe.
As a general rule :
If the main chart’s timeframe is low (e.g., 1-minute or 5-minute), it is better to keep this setting at a similarly low timeframe.
As the main chart’s timeframe increases (e.g., daily or weekly), it is advisable to set this parameter to a higher timeframe for more aligned data analysis.
Cumulative Mode :
Current Candle : Strength is calculated only for the current candlestick.
EMA (Exponential Moving Average) : The strength is calculated using an exponential moving average, suitable for identifying longer-term trends.
Calculation Period : The default period for the exponential moving average (EMA) is set to 21. Users can modify this value for more precise analysis based on their specific requirements.
Ultra Data : This option enables users to view more detailed data from various market sources, such as Forex, Crypto, or Stocks. When activated, the indicator aggregates and displays volume data from multiple sources.
🟣 Table Settings
Show Info Table : This option determines whether the information table is displayed on the chart. When enabled, the table appears in a corner of the chart and provides details about the strength of buyers and sellers.
Table Size : Users can adjust the size of the text within the table to improve readability.
Table Position : This setting defines the table’s placement on the chart.
🔵 Conclusion
The indicator introduced in this article is designed as an advanced tool for analyzing supply and demand dynamics in financial markets. By leveraging buyer and seller strength ratios and visually highlighting price levels with the highest trade volume, it aids traders in identifying key market zones.
Key features, such as adjustable analysis timeframes, customizable calculation methods, and precise volume data display, allow users to tailor their analyses to market conditions.
This indicator is invaluable for analyzing support and resistance levels derived from trade volumes, enabling traders to make more accurate decisions about entering or exiting trades.
By utilizing real market data and displaying the highest trade volume lines directly on the chart, it provides a precise perspective on market behavior. These features make it suitable for both novice and professional traders aiming to enhance their analysis and trading strategies.
With this indicator, traders can gain a better understanding of supply and demand dynamics and operate more intelligently in financial markets. By combining volume data with visual analysis, this tool provides a solid foundation for effective decision-making and improved trading performance. Choosing this indicator is a significant step toward refining analysis and achieving success in complex financial markets.

Alternate Bat Harmonic Pattern [TradingFinder] ALT Bat Indicator🔵 Introduction
The Alternate Bat harmonic pattern is one of the most precise and practical tools in technical analysis, introduced by Scott Carney in 2003. This pattern focuses on specific Fibonacci ratios, such as 0.382 at point B and 1.13XA at point D, to identify Potential Reversal Zones (PRZ) where price is likely to reverse.
The Alternative Bat pattern emerged as a result of repeated failures observed in the standard Bat pattern. Traders entering trades near the 0.886XA level of the standard Bat often encountered losses. In the Alternate Bat, point D extends beyond 0.886XA, typically reversing at 1.13XA, offering a more accurate identification of the reversal zone.
A key characteristic of this pattern is its M- or W-shaped structure, where the midpoint B retraces 0.382XA or less. Additionally, the CD leg requires an extension of 2.0 to 3.618 to complete the pattern. Due to its accuracy and the predictable behavior of price near the PRZ, the Alternate Bat pattern is recognized as a powerful tool for forecasting price reversals.
In the bullish Alternative Bat pattern, an M-shaped structure forms. After an initial upward movement (XA), price undergoes a short correction at point B (0.382XA) and then declines toward point D (1.13XA and an extension of 2.0 to 3.618BC), where a potential upward reversal is expected.
In the bearish Alternate Bat pattern, a W-shaped structure forms. After an initial downward movement (XA), price retraces slightly at point B (0.382XA) and then rises toward point D (1.13XA and an extension of 2.0 to 3.618BC), where a potential downward reversal is anticipated.
🔵 How to Use
The Alternate Bat harmonic pattern is a key tool for identifying potential reversal zones (PRZ) in the market. By leveraging the 0.382 retracement at point B and the 1.13XA extension at point D, along with symmetrical price structures, this pattern offers precise reversal opportunities in both bullish and bearish market conditions.
🟣 Bullish Alternate Bat Pattern
The bullish Alternate Bat pattern forms during a downtrend, signaling a potential reversal to the upside. This pattern consists of three downward movements with two corrective waves, ultimately reaching point D, which marks the PRZ.
At the PRZ, the convergence of Fibonacci levels—1.13XA and extensions ranging from 2.0 to 3.618BC—creates a strong support zone where price is likely to reverse upward.
🟣 Bearish Alternative Bat Pattern
The bearish Alternate Bat pattern develops during an uptrend, indicating a potential reversal to the downside. This pattern features three upward price movements with two retracements, ending at point D, where the PRZ forms.
Point D is defined by the 1.13XA extension and the 2.0 to 3.618BC projection, creating a strong resistance zone where price is expected to reverse downward.
🔵 Setting
🟣 Logical Setting
ZigZag Pivot Period : You can adjust the period so that the harmonic patterns are adjusted according to the pivot period you want. This factor is the most important parameter in pattern recognition.
Show Valid Format : If this parameter is on "On" mode, only patterns will be displayed that they have exact format and no noise can be seen in them. If "Off" is, the patterns displayed that maybe are noisy and do not exactly correspond to the original pattern.
Show Formation Last Pivot Confirm : if Turned on, you can see this ability of patterns when their last pivot is formed. If this feature is off, it will see the patterns as soon as they are formed. The advantage of this option being clear is less formation of fielded patterns, and it is accompanied by the latest pattern seeing and a sharp reduction in reward to risk.
Period of Formation Last Pivot : Using this parameter you can determine that the last pivot is based on Pivot period.
🟣 Genaral Setting
Show : Enter "On" to display the template and "Off" to not display the template.
Color : Enter the desired color to draw the pattern in this parameter.
LineWidth : You can enter the number 1 or numbers higher than one to adjust the thickness of the drawing lines. This number must be an integer and increases with increasing thickness.
LabelSize : You can adjust the size of the labels by using the "size.auto", "size.tiny", "size.smal", "size.normal", "size.large" or "size.huge" entries.
🟣 Alert Setting
Alert : On / Off
Message Frequency : This string parameter defines the announcement frequency. Choices include: "All" (activates the alert every time the function is called), "Once Per Bar" (activates the alert only on the first call within the bar), and "Once Per Bar Close" (the alert is activated only by a call at the last script execution of the real-time bar upon closing). The default setting is "Once per Bar".
Show Alert Time by Time Zone : The date, hour, and minute you receive in alert messages can be based on any time zone you choose. For example, if you want New York time, you should enter "UTC-4". This input is set to the time zone "UTC" by default.
🔵 Conclusion
The Alternate Bat harmonic pattern, with its precise Fibonacci ratios like 0.382 and 1.13XA, is a reliable tool for identifying Potential Reversal Zones (PRZ) in financial markets. By recognizing symmetrical price structures and focusing on both bullish and bearish scenarios, traders can identify optimal entry and exit points with high accuracy.
The key strength of this pattern lies in its ability to define strong support and resistance zones near the PRZ, increasing the probability of price reversals. Combining the pattern with candlestick confirmations and volume analysis enhances its effectiveness.
Ultimately, incorporating the Alternative Bat pattern with proper risk management and Fibonacci-based targets allows traders to enter the market confidently and capitalize on potential price reversals.

Pivot MeterThe "Pivot Meter" is a indicator designed to plot pivot levels (support and resistance) directly on the chart. It offers two types of pivot calculations STANDARD and FIBONACCI, allowing traders to choose their preferred method. Here's an overview of its features and functionalities:
________________________________________
Key Features
1. Pivot Types:
o STANDARD: Traditional calculation based on the previous period's high, low, and close.
o FIBONACCI: Uses Fibonacci ratios to calculate support and resistance levels.
2. Dynamic Time Frame Adjustment:
o The indicator adjusts its calculations based on the chart's timeframe, aligning pivot calculations with appropriate periods.
3. Pivot Levels:
o Resistance Levels (R1 to R5): Five resistance levels calculated based on the selected pivot type.
o Support Levels (S1 to S5): Five support levels corresponding to the pivot type.
o Central Pivot (P): The base pivot level for reference.
4. Visualization:
o All pivot levels are plotted as coloured horizontal bands on the chart for easy identification.
o Colours range from warm tones (red for higher resistance levels) to cool tones (blue for lower support levels).
o Thickness and styling make these levels visually prominent.
5. Real-Time Price Line:
o A dynamically updating line marks the current price, with customizable colour and width for visibility.
6. Labels for Levels:
o Labels are placed next to each pivot level for identification (e.g., R1, S1, Pivot).
o Labels dynamically adjust their position with the chart’s bar progression.
________________________________________
Purpose
This indicator helps traders identify potential reversal points, support and resistance levels, and critical price zones. It is especially useful for:
• Day Traders: Quickly assess key levels for short-term trades.
• Swing Traders: Spot significant support/resistance zones over longer periods.
• Trend Followers: Use pivot levels to confirm breakouts or bounces.
________________________________________
Customization Options
• Pivot Type Selection: Choose between STANDARD and FIBONACCI.
• Price Line Colour: Customize the colour of the current price line for better integration with your chart setup.
________________________________________
Technical Details
• Security Function: Data from higher timeframes is accessed using request.security, ensuring accurate and multi-timeframe pivot calculations.
• Dynamic Labelling: Labels update their positions with every new bar to remain synchronized with the latest data.
________________________________________
Usage
Traders can add this indicator to their TradingView charts to monitor critical levels and strategize entries, exits, and stop-loss placements based on the proximity to these pivots. The dual pivot calculation methods make it versatile for diverse trading styles.
Big Money by ChartedhighsBig Money by Chartedhighs
Script Overview:
The "Big Money" indicator is designed to help traders easily identify significant price movements on their charts. This script visually highlights candles where the price change from open to close exceeds a user-defined threshold. It draws attention to these key moments, providing a clear indication of potential big-money moves in the market.
Key Features:
Customizable Threshold:
Allows users to set a specific price change threshold via the input menu (Highlight Threshold).
Only candles with a price change greater than or equal to this value are highlighted.
Candle Highlighting:
Uses color-coded bars to emphasize candles meeting the threshold condition.
Candles are highlighted in yellow for immediate visual clarity.
Dynamic Box Annotation:
Draws a semi-transparent yellow box around highlighted candles.
Extends the box dynamically to subsequent bars, providing an area of interest for continued analysis.
Labeling for Key Moments:
Automatically adds a label ("BigMoney") above highlighted bars to further indicate significant price action.
How It Works:
The script calculates the price change for each bar (close - open) and compares it to the user-defined threshold.
If the price change meets or exceeds the threshold:
The bar color changes to yellow.
A box is drawn around the candle to highlight the price movement visually.
A label is added above the candle to emphasize its significance.
The box extends dynamically until the next highlighted candle, allowing users to track zones of activity.
Customization Options:
Highlight Threshold: Modify the threshold value to suit your trading style or instrument volatility.
Use Case:
This indicator is ideal for traders looking to identify significant price movements quickly. It helps to locate areas where "big money" might be flowing into the market, offering potential entry or exit opportunities.
How to Use:
Add the "Big Money by Chartedhighs" script to your TradingView chart.
Set the Highlight Threshold to a value suitable for your market or timeframe.
Observe highlighted candles and boxes for potential trading signals or areas of interest.
This script is highly visual, intuitive, and customizable, making it a great addition to any trader's toolkit!

Support & Resistance SentinelSupport & Resistance Sentinel
The Support & Resistance Sentinel is a powerful and versatile indicator designed to identify and visualize key support and resistance levels on your charts. By leveraging multiple technical analysis tools, it ensures accuracy and adaptability across different market conditions and timeframes.
Key Features:
Dynamic Support and Resistance Levels: The indicator dynamically identifies local highs and lows, adapting to evolving market conditions.
Volume Spike Detection: Incorporates volume analysis to highlight significant market activity, ensuring the identified levels are robust.
Moving Average and RSI Filters: Utilizes moving averages and Relative Strength Index (RSI) to validate the significance of support and resistance levels.
Higher Timeframe Confirmation: Integrates higher timeframe data to provide an additional layer of confirmation for identified levels.
Customizable Visuals: Allows users to customize the length, color, and extension of support and resistance boxes for clear and personalized chart visualization.
Alerts: Includes alert conditions to notify users when the price hits significant support or resistance levels.
How It Works:
Identification: The indicator analyzes historical price data to identify local highs and lows within a specified lookback period.
Validation: It uses moving averages and RSI to filter out less significant levels, focusing on key support and resistance zones.
Volume Analysis: Detects volume spikes to ensure the levels correspond to substantial market activity.
Higher Timeframe Integration: Combines current timeframe data with higher timeframe levels for added confirmation.
Visualization: Draws customizable boxes around the identified support and resistance levels, extending them for better visual clarity.
Alerts: Sets up alerts to notify users when the price interacts with these crucial levels.
How to Use:
Customization: Adjust input settings such as lookback period, box length, and colors to fit your trading preferences.
Observation: Monitor the chart for highlighted support and resistance zones to understand key market levels.
Trading Decisions: Use these zones to make informed trading decisions, including setting entry and exit points or stop-loss orders.
Alerts: Enable alerts to get notified when price action hits significant support or resistance levels, allowing timely decision-making.
Enhance your trading strategy with the Support & Resistance Sentinel and gain deeper insights into market dynamics..
Enigma End Game Indicator
Enigma End Game Indicator Description
The Enigma End Game indicator is a powerful tool designed to enhance the way traders approach support and resistance, combining mainstream technical analysis with a unique, dynamic perspective. At its core, this indicator enables traders to adapt to market conditions in real time by applying a blend of classic and modern interpretations of support and resistance levels.
In traditional support and resistance analysis, we recognize the significant price points where the market has historically reversed or consolidated. However, the *Enigma End Game* indicator takes this one step further by analyzing each individual candle's high as a potential resistance level and each low as support. This allows the trader to stay more agile, as the market constantly updates and evolves. The dynamic nature of this method acknowledges that price movements are fractal in nature, meaning that these levels are not static but adjust in response to price action on multiple timeframes.
### How It Works:
When using the *Enigma End Game* indicator, it doesn't simply plot buy and sell signals automatically. Instead, the indicator highlights key levels based on the interaction between price and historical price action. Here's how it operates:
1. **Buy Logic:**
The indicator identifies bullish signals based on the *Enigma* logic, but it does not trigger an immediate buy. Instead, it plots arrows above or below the candles, indicating the key price levels where price action has shifted. Traders then focus on these areas, particularly looking for buy opportunities *below* these levels during key market sessions (such as London or New York) while aligning with both mainstream support and resistance and *Enigma* levels.
2. **Sell Logic:**
Similarly, when the indicator identifies a sell signal, it plots an arrow above the candle where price action has reversed. This does not immediately suggest selling. Traders wait for a price retracement back to the previously breached low (for a sell order) or high (for a buy order), observing price action closely on lower timeframes (such as the 1-minute chart) to refine entry points. The entry is triggered when price starts to show signs of reversing at these levels, further validated by mainstream and *Enigma* support/resistance.
### Practical Example – XAU/USD (Gold):
For instance, in the settings of the *Enigma End Game* indicator, if we select the 5-minute (5MN) timeframe as the key level, the indicator will only plot the first 3 arrows following the *Enigma* logic. The arrows will appear above or below the candle that was breached, indicating a potential trend reversal. In this scenario, the first arrow marks the point where price broke a significant support or resistance level. Afterward, the trader watches for a subsequent candle to close below (in the case of a sell) the previous candle’s low, confirming a bearish bias.
Now, the trader does not rush into a sell order. Instead, they wait for the price to pull back towards the previously breached low. At this point, the trader can use a lower timeframe (like the 1-minute chart) to identify both mainstream support and resistance levels and *Enigma* levels above the main 5-minute key level. These additional levels provide a clearer understanding of where price might reverse and give the trader a stronger edge in refining their entry point.
The trader then sets a sell order *above* the price level of the previous low, but only once signs show that price is retracing and ready to fall again. The price point where this retracement occurs, confirmed by both mainstream and *Enigma* levels, becomes the entry signal for the trade.
### Summary:
The *Enigma End Game* indicator combines time-tested principles of support and resistance with a more modern, adaptive view, empowering traders to read the market with greater precision. It guides you to wait for optimal entries, based on dynamic support and resistance levels that change with each price movement. By combining signals on higher timeframes with refined entries on lower timeframes, traders gain a unique advantage in navigating both obvious and hidden levels of support and resistance, ultimately improving their ability to time trades with higher probability of success.
This indicator allows for a more calculated, strategic approach to trading—highlighting the right moments to enter the market while providing the flexibility to adjust to different market conditions.
The *ENIGMA Signals with Retests* indicator is a versatile trading tool that combines key market sessions with dynamic support and resistance levels. It uses logic to identify potential buy and sell signals based on the behavior of recent price swings (highs and lows) and offers flexibility with the number of arrows plotted per session. The user can customize settings like arrow frequency, line styles, and session times, allowing for personalized trading strategies.
The indicator detects buy and sell signals by checking if the price breaks the previous swing high (for buy signals) or swing low (for sell signals). It then stores these levels and draws horizontal lines on the chart, representing critical price levels where traders can expect potential price reactions.
A key feature of this indicator is its ability to limit the number of arrows per session, ensuring a cleaner chart and reducing signal clutter. Horizontal lines are drawn at the identified buy or sell levels, with the option to display labels like "BUY - AT OR BELOW" and "SELL - AT OR ABOVE" to further clarify entry points.
The indicator also incorporates session filtering, allowing traders to focus on specific market sessions (Asia, London, and New York) for more relevant signals, and it ensures that no more than a user-defined number of arrows are plotted within a session.

Yakloft Support and Resistance LevelsYakloft Support and Resistance Levels Indicator
The Yakloft Support and Resistance Levels indicator is a powerful tool designed to help traders identify key support and resistance levels on a price chart. By leveraging advanced pivot point calculations and customizable settings, this indicator provides clear visual cues for potential price reversals and market trends.
Key Features
Automatic Support and Resistance Levels:
Dynamic Calculation: The indicator automatically identifies and plots significant support and resistance levels based on pivot highs and lows.
Customizable Strength: Adjust the S/R Strength parameter to filter levels according to their significance. Higher values display fewer but more robust levels.
Zones Around Levels:
Support and Resistance Zones: Create zones around each support and resistance level to highlight areas of interest rather than exact price points.
High/Low Zones: Plot zones around the highest and lowest price levels within a specified period, providing additional context for potential breakouts or reversals.
Zone Width Adjustment: Customize the width of the zones using the Zone Width % parameter, calculated as a percentage of the price range over the last 300 bars.
Line Styles and Fills:
Customizable Appearance: Modify line colors, styles (Solid, Dotted, Dashed), and widths to match your chart preferences.
Line Fills: Enhance visual clarity by filling zones with semi-transparent colors, making it easier to distinguish between support and resistance areas.
Dynamic Line Management:
Automatic Line Removal: To keep your chart uncluttered, the indicator removes a support or resistance line after the price crosses it twice. This feature helps you focus on the most relevant and current levels.
Expandable Lines:
Line Extension: Choose to extend lines both forward and backward in time with the Expand S/R Lines option, providing a comprehensive view of historical support and resistance.
How It Works
The indicator analyzes price data to identify pivot highs and lows over a specified lookback period. These pivot points are potential areas where the price may reverse or experience significant support or resistance. By filtering these points based on the S/R Strength parameter, the indicator ensures that only the most significant levels are displayed.
Once the levels are identified:
Support Levels: Plotted when the price shows potential to stop falling and possibly start rising.
Resistance Levels: Plotted when the price may stop rising and potentially start falling.
The indicator enhances these levels by:
Adding Zones: By creating a buffer around each level, traders can see areas where the price might interact with support or resistance, rather than focusing on a single price point.
Line Fills: The zones are filled with a semi-transparent color corresponding to support or resistance, improving visual distinction.
Input Parameters
Enable Support & Resistance: Toggle the entire indicator on or off.
Support Color: Choose the color for support lines and fills.
Resistance Color: Choose the color for resistance lines and fills.
S/R Strength: Set the sensitivity of level detection. Higher values result in fewer, more significant levels.
Line Style: Select the style of the support and resistance lines (Solid, Dotted, Dashed).
S/R Line Width: Adjust the thickness of the support and resistance lines.
Enable Zones: Toggle the display of zones around each level.
Enable High/Low Zones: Toggle the display of zones around the highest and lowest price levels.
Zone Width %: Define the width of the zones as a percentage of the price range over the last 300 bars.
Expand S/R Lines: Choose whether to extend the lines across the entire chart or limit them to recent data.
Using the Indicator
Identifying Key Levels:
Use the plotted support and resistance levels to identify potential entry and exit points.
Pay attention to the zones, as they represent areas where the price is more likely to react.
Monitoring Price Interaction:
Observe how the price behaves around the support and resistance levels.
The automatic removal of lines after two crossings helps focus on active levels.
Customizing for Clarity:
Adjust the visual settings to match your trading style and improve chart readability.
Experiment with the S/R Strength and Zone Width % to fine-tune the indicator to different market conditions.
Best Practices
Combine with Other Analysis Tools:
Use the indicator alongside other technical analysis tools like trend lines, moving averages, and oscillators for a more comprehensive market view.
Adjust for Different Timeframes:
The indicator works on various timeframes. Adjust the parameters when switching between short-term and long-term charts to maintain effectiveness.
Stay Updated with Market Conditions:
Market volatility can affect the significance of support and resistance levels. Regularly adjust the S/R Strength parameter to align with current market dynamics.
Limitations
Not a Standalone Solution:
While the indicator provides valuable insights, it should not be used in isolation. Always consider broader market analysis and risk management practices.
Historical Data Dependency:
The accuracy of the levels depends on the availability of sufficient historical data. Ensure your chart includes enough data for the indicator to perform effectively.

Non-Psychological Levels🟩 Non-Psychological Levels is a structural analysis tool that segments price action into objective ranges, identifying Broken and Unbroken levels without relying on psychological or time-based assumptions. By emphasizing mechanically derived price behavior, it provides traders with a clear framework for analyzing support and resistance in a consistent and unbiased manner across various market conditions.
This indicator introduces a new approach to understanding market structure by focusing on price movement within defined segments, free from behavioral patterns, round numbers, or specific time intervals. While the indicator is time-agnostic in design, it works within the natural time progression of the chart, ensuring that segmentation aligns with the inherent structure of price movement. Broken levels, where price has breached a structural boundary, and Unbroken levels, which remain intact, are visualized with horizontal lines. These structural zones are complemented by dynamically boxed segments that contextualize both historical and ongoing price behavior.
By offering an objective perspective, the Non-Psychological Levels indicator complements psychology-based tools, helping traders explore market dynamics from multiple angles. When structural levels align with psychological zones, they reinforce critical price areas; when they differ, they provide opportunities to analyze price behavior from an alternative lens. This indicator is designed as both an educational framework and a practical tool, encouraging a deeper understanding of structural price behavior in technical analysis.
⭕ THEORY AND CONCEPT ⭕
The Non-Psychological Levels indicator is grounded in the principle of analyzing price behavior without reliance on psychological assumptions or time-based factors. Its primary purpose is to provide a structural framework for identifying support and resistance levels by focusing solely on price movement within mechanically defined segments. By removing external influences such as sentiment, time intervals, or market sessions, the indicator offers an unbiased lens through which traders can observe price dynamics.
Non-psychology, as defined here, refers to an approach that excludes behavioral and emotional patterns—like fear, greed, or herd mentality—from price analysis. Traditional tools often depend on these patterns to identify zones such as pivots or Fibonacci retracements, but these methods can be inconsistent in volatile markets. In contrast, the Non-Psychological Levels indicator focuses entirely on what price is doing, free from assumptions about trader behavior or external time constraints.
The indicator’s time-agnostic and mechanically driven design segments price action into consistent ranges, highlighting "Broken" levels (where price breaches structural boundaries) and "Unbroken" levels (where price holds). These structural zones remain unaffected by subjective or external influences, ensuring clarity and consistency across different markets and timeframes. By doing so, the indicator reveals a pure view of price structure, independent of psychological biases.
Importantly, the Non-Psychological Levels indicator is not intended to replace psychology-based tools but to complement them. When its structural levels align with psychological zones like round numbers or session highs/lows, the significance of these areas is reinforced. Conversely, when the levels differ, the contrast provides traders with alternative insights into market dynamics. This dual perspective—blending mechanical objectivity with behavioral analysis—enhances the depth and flexibility of market evaluation.
The following principles outline the theoretical foundation of the indicator and its unique contribution to structural price analysis:
Time-Agnostic Design : The indicator avoids reliance on time-based factors like daily opens, session intervals, or specific events. Instead, it segments price action using bar indexes, ensuring that structural levels are identified independently of external time variables. While the x-axis of a chart inherently represents time, this indicator abstracts away its influence, allowing traders to focus purely on price movement without the bias of temporal context.
Mechanical and Neutral Framework : Every calculation within the indicator is predetermined by a set of mechanical rules, ensuring no subjective input or interpretation affects the results. This objectivity guarantees that levels are derived solely from observed price behavior, providing a reliable framework that traders can trust to remain consistent across different assets, timeframes, and market conditions.
Broken and Unbroken Levels : Broken levels represent zones where price has breached a structural boundary, while Unbroken levels highlight areas where price has consistently respected its range. This distinction provides a clear and systematic method for identifying key support and resistance levels, offering insights into where future price interactions are most likely to occur.
Neutral Price Behavior : By dividing price action into equal segments, the indicator removes the influence of external factors like trader sentiment or psychological expectations. Each segment independently determines significant levels based purely on price action, enabling a structural view of the market that abstracts away behavioral or emotional biases.
Complement to Psychological Tools : While the indicator itself avoids behavioral assumptions, its levels can align with psychological zones like round numbers, pivots, or Fibonacci levels. When these structural and psychological levels overlap, it reinforces the importance of key areas, while divergences offer opportunities to examine price behavior from a new perspective.
Educational Value : The indicator encourages traders to explore the contrast between structural and psychological analysis. By introducing a framework that isolates price behavior from external influences, it challenges traditional methods of technical analysis, fostering deeper insights into market structure and behavior.
🔍 UNDERSTANDING STRUCTURAL LEVELS 🔍
The Non-Psychological Levels indicator offers a straightforward yet powerful way to understand market structure by segmenting price action into mechanically defined ranges. This segmentation highlights two key elements: "Broken" levels, where price has breached structural boundaries, and "Unbroken" levels, which remain intact and respected by price action. Together, these components create a framework for identifying potential areas of support and resistance.
Broken Levels : These are structural boundaries that price has surpassed, indicating areas where previous support or resistance failed. Broken levels often signal transitions in price behavior, such as shifts in momentum or the start of trending movements. They provide insight into zones where price has already tested and moved beyond.
Unbroken Levels : These levels remain intact within a given price segment, marking areas where price has consistently respected boundaries. Unbroken levels are particularly useful for identifying potential reversal points or zones of continued support or resistance. Their persistence across price action often makes them reliable indicators of market structure.
The visual segmentation of price action into distinct ranges allows traders to observe how price transitions between structural zones. For example:
- Clusters of Unbroken levels near the current price may suggest strong support or resistance, offering areas of interest for reversals or breakouts.
- Gaps between Unbroken levels highlight areas of price inefficiency or low interaction, which may become significant if revisited.
By focusing solely on structural price behavior, the Non-Psychological Levels indicator enables traders to analyze price independently of time or psychological factors. This makes it a valuable tool for understanding price dynamics objectively, whether used on its own or alongside other indicators.
🛠️ SETTINGS 🛠️
The Non-Psychological Levels indicator offers various customizable settings to help users tailor its visualization to their specific trading style and market conditions. These settings allow adjustments to sensitivity, level projection, and the source of price calculations (e.g., wicks or closing prices). Below, we outline each setting and its impact on the chart, along with examples to illustrate their functionality.
Custom Settings
Sensitivity : This setting adjusts the balance between detailed and broader structural levels by controlling the number of segments. Higher values result in more segments, revealing finer price levels, while lower values consolidate segments to highlight major price movements.
Source : Allows the user to choose between 'Wick' or 'Close' for detecting levels. Selecting 'Wick' emphasizes the absolute highs and lows of price action, while 'Close' focuses on closing prices within each segment.
Level Labels : Configures the visual representation of price levels, allowing users to toggle between price values, symbols (▲ ▼), or disabling labels altogether. This setting ensures clarity in how Broken and Unbroken levels are displayed on the chart.
Unbroken Levels : - - - Users can customize the colors and label styles for Unbroken levels, which highlight areas where price has respected structural boundaries.
Broken Levels : -|- Similar to Unbroken levels, users can specify the visual appearance of Broken levels, including color customization for Broken highs and lows. These settings help distinguish areas where price has breached a structural boundary.
Projection Options : This setting allows users to control how broken and unbroken levels are visually extended on the chart. The Future option projects lines forward to the right of the current price, showing potential future relevance of levels. The All option extends lines both forward and backward, providing a comprehensive view of how levels align with historical and potential future price action. The None option disables projections, keeping the chart focused solely on current segment levels without any extensions.
Segments : Includes options for customizing the segment visualization:
- Live Segment : Toggles the display of a highlighted box representing the current developing segment, helping users focus on ongoing price action.
- Boxes : Allows users to display filled boxes around each segment for additional visual emphasis.
- Segment Colors : Users can define separate colors for support (lower) and resistance (upper) segments, making it easier to interpret directional trends.
- Boundaries : Enables or disables vertical lines to mark segment boundaries, providing a clearer view of structural divisions.
Repaint : This setting allows users to enable or disable triangle labels within the live segment. When enabled, the triangles dynamically update to reflect real-time price behavior during the live bar but will repaint until the bar is fully confirmed. Disabling this option prevents the triangles from appearing during the live bar, reducing potential confusion as they may otherwise flash on and off during price updates. This setting ensures users can choose their preferred visualization while maintaining clarity in real-time analysis.
Color Settings : Offers extensive customization for all visual elements, including Broken and Unbroken levels, segment boundaries, and live segments. These settings ensure the indicator can adapt to individual preferences for chart readability.
🖼️ CHART EXAMPLES 🖼️
The following chart examples illustrate different configurations and features of the Non-Psychological Levels indicator. These examples highlight how the indicator’s settings influence the visualization of structural price behavior, helping traders understand its functionality in various scenarios.
Broken and Unbroken Levels : Orange prices are Broken HIghs. Blue prices are Broken Lows. Green and Red are Unbroken.
Boundaries : Enable Boundaries to visualize segments.
High Sensitivity Setting : A high sensitivity setting produces fewer segments and levels, emphasizing broader price ranges and major structural zones. This configuration is better suited for higher timeframes or identifying overarching trends.
Low Sensitivity Setting : A low sensitivity setting results in a greater number of segments and levels, offering a granular view of price structure. This configuration is ideal for analyzing detailed price movements on lower timeframes.
Live Segment with Triangles Enabled : This example shows the live segment box with triangle labels enabled. These triangles update dynamically during the live bar but may repaint until the bar is confirmed, helping traders observe real-time price behavior.
Broken and Unbroken Levels : This example highlights Broken levels (where price has breached structural boundaries and are drawn through subsequent price action) and Unbroken levels (where price has respected structural boundaries). These distinctions visually identify areas of potential support and resistance.
Broken and Unbroken Levels with Projection: All : This example demonstrates the "Project All" feature, where broken and unbroken levels are extended both forward and backward on the chart. This visualization highlights historical and potential future support and resistance zones, helping traders better understand how price interacts with these structural levels over time.
Segment Boxes with Boundaries : Filled boxes around individual segments visually distinguish each price interval, offering clarity in observing structural price transitions.
📊 SUMMARY 📊
The Non-Psychological Levels indicator provides a unique framework for analyzing structural price behavior through the identification of Broken and Unbroken levels. These levels act as a mechanical representation of support and resistance, independent of psychological biases or time-based factors. By focusing purely on price movement within defined segments, the indicator offers a neutral and consistent approach to understanding market dynamics.
This method complements traditional tools by providing an unbiased perspective. When structural levels align with psychological zones—such as round numbers or session-based highs and lows—they reinforce the significance of these areas as key price zones. When they diverge, the indicator introduces an alternative view, prompting further exploration of price behavior. This dual perspective enhances the depth of analysis by combining the mechanical and behavioral aspects of price action.
The Non-Psychological Levels indicator is not designed to generate trading signals or predict future price movements but serves as a visual and educational tool. Its adaptability across all markets and timeframes allows traders to integrate it into their broader strategies. By highlighting structural price dynamics, the indicator offers a fresh perspective on market analysis while remaining compatible with other technical tools.
⚙️ COMPATIBILITY AND LIMITATIONS ⚙️
Asset Compatibility :
The Non-Psychological Levels indicator is compatible with all asset classes, including cryptocurrencies, forex, stocks, and commodities. It can be applied to any chart or timeframe, making it a flexible tool for structural price analysis. Users should adjust the Sensitivity setting to ensure the segmentation aligns with the price behavior of the specific asset being analyzed. For instance, higher sensitivity values are more suitable for assets with large price ranges, while lower values work well for assets with tighter ranges.
Visual Range Dependency :
The indicator is optimized to perform calculations only within the visible range of the chart. This is a significant advantage, as it prevents unnecessary calculations and maintains efficient performance. However, because of this dependency, levels may appear to "recalculate" when the chart is zoomed in or out quickly or shifted abruptly. While this does not affect the integrity of the levels, it may cause a temporary lag as the indicator adjusts to the new visual range.
Persistence of Levels Beyond Visibility :
Even if levels are not visible on the chart due to zoom or scroll settings, they still exist in the background and are recalculated when revisited. This ensures that the structural price analysis remains consistent, regardless of the chart view.
Box Limitations in Pine Script :
The indicator is subject to Pine Script's inherent limitation of 500 boxes. This means that no more than 500 segments or level boxes can be drawn on the chart simultaneously. For most configurations, this limitation is mitigated by focusing on the visual range, but users employing very low sensitivity settings may exceed the limit. In such cases, only the most recent 500 boxes will be displayed, potentially omitting earlier segments.
Lag with Low Sensitivity Settings :
When sensitivity is set to a low value, the indicator creates many more segments, resulting in finer granularity and a higher number of boxes. While this provides detailed structural levels, it may increase the likelihood of exceeding Pine Script’s 500-box limit or cause a temporary lag when rendering a dense set of boxes over a wide visual range. Users should adjust sensitivity to balance detail with performance, especially on assets with high volatility or broad price ranges.
Live Segment Caution :
The live segment box updates in real time to reflect price movements as the segment is still developing. Since the segment high and segment low are not yet finalized, users should interpret this feature as a dynamic visualization of current price behavior rather than a definitive structural analysis. This ensures clarity during ongoing price action while maintaining the integrity of the indicator's framework.
Cross-Market Versatility :
The indicator’s time-agnostic and mechanical design ensures that it functions identically across all markets and timeframes. However, users should consider the unique characteristics of different markets when interpreting the results, as certain assets (e.g., highly volatile cryptocurrencies) may require sensitivity adjustments for optimal segmentation.
Visual Range Dependency: Levels recalculate efficiently within the chart's visible range but may lag temporarily when zooming or scrolling quickly.
These considerations ensure that the Non-Psychological Levels indicator remains robust and versatile while highlighting some inherent limitations of Pine Script and real-time recalculations. Users can mitigate these constraints by carefully adjusting sensitivity and understanding how the visual range dependency affects performance.
⚠️ DISCLAIMER ⚠️
The Non-Psychological Levels indicator is a visual analysis tool and is not designed as a predictive or trading signal indicator. Its primary purpose is to highlight structural price levels, providing an objective framework for understanding support and resistance within mechanically segmented price action.
The indicator operates within the visible range of the chart to ensure efficiency and adaptiveness, but this recalculation should not be interpreted as a forecast of future price behavior. While the structural levels may align with significant price zones in hindsight, they are purely a reflection of observed price dynamics and should not be used as standalone trading signals.
This indicator is intended as an educational and visual aid to complement other analysis methods. Users are encouraged to integrate it into a broader trading strategy and make adjustments to the settings based on their individual needs and market conditions.
🧠 BEYOND THE CODE 🧠
The Non-Psychological Levels indicator, like other xxattaxx indicators , is designed with education and community collaboration in mind. Its open-source nature encourages exploration, experimentation, and the development of new approaches to price analysis. By focusing on structural price behavior rather than psychological or time-based factors, this indicator introduces a fresh perspective for users to study.
Beyond its visual utility, the indicator serves as an educational framework for understanding the concept of non-psychological analysis. It offers traders an opportunity to explore price dynamics in a purely mechanical way, challenging conventional methods and fostering deeper insights into structural behavior. This approach is especially valuable for those interested in exploring new concepts or seeking alternative perspectives on market analysis.
Your comments, suggestions, and discussions are invaluable in shaping the future of this project. We actively encourage your feedback and contributions, which will directly help us refine and improve the Non-Psychological Levels indicator. We look forward to seeing the creative ways in which you use and enhance this tool. MVS
