Jimmy's Dikfat DaytraderThis Day Trading Indicator applies the use of multiple techniques designed to maximize profits and trade success probability while utilizing proprietary mathematical techniques to calculate specific high probability Pivot Points, Break of Structure, Supply and Demand, previous days High and Low, Liquidity Hunts, Dynamic Trend Lines and Fibonacci Discount Zones. The combination of these techniques combined with unique mathematical calculation & variance allow the user to make an informed analysis to take high probability trades by exposing Market Maker discount zones and highlight smart money purchasing.
Pivot Points: A traditional pivot point is described as an individual candle high that is higher than the previous two candles to the left and forward two candles to the right. Likewise a pivot is also an individual candle low that is lower than the previous two candles to the left and forward two candles to the right. In this indicator standard pivots are highlighted as yellow and white candles. Yellow candles are High or Top Pivots; White Candles are Low or Bottom Pivots. The number of pivots checked for either left or right or both can be changed in the settings. Increasing this value will add more pivot points to the chart, decreasing this value will add less. It is recommended to change values left and right with the same number.
Note: In this study, all traditional pivots will be highlighted by yellow or white for the advanced user, but not all pivot markers will highlight all pivots for the purposes of identifying a high probability trade.
Break of Structure: Break of structure occurs when current price drops below or likewise rises above a pivot point. For the purposes of this study, a break of structure tag will appear over a previous pivot tag ONLY when there is a candle close below or above the previous pivot for the purposes of identifying liquidity hunts and high probability trades. As you will note in the example chart, break of structure is used to determine not only trend but high probability trade areas by identifying market structure. Unbroken pivot highs or lows can be used to take trades, with a stop below the low (or above the high) of the unbroken pivot candle. BOS (Break of Structure) Tags will effectively show where market participants do not want to take a trade and be chopped up in a market that is trending only 30% of the time. BOS also gives future indication of where the Market Makers are taking price action. Breaks of structure in a particular direction typically indicate a continuation of price action in that direction. Trade opportunities occur after the pullback in the opposite direction of break of structure. This highlights areas traders can take on the pullback, in the direction of structure breaks, typically on unbroken pivots.
Note: In this study, not all BOS (Break of Structure) markers will highlight all breaks of structure for the purposes of identifying a high probability trade. Some very few examples of structure is not marked as broken to assist in identifying Liquidity Hunts.
Liquidity Hunt: A Liquidity Hunt is where price action moves in the opposite direction of an intended move (typically with high magnitude and velocity) to gather "Liquidity" and trigger stops created by traders caught in the break of structure zone. Any unbroken pivot is a relevant area of Liquidity. Some of the High probability areas of Liquidity will be found at Equal (or near equal) Lows or Equal High pivots. Current areas of Liquidity are marked on the chart as an Aqua (Light Blue) Background line that extends right infinitely. Once Liquidity has been taken at one of these lines, the Line will "Break" And stop displaying forward. The number of pivots calculated specifically for break of structure and Liquidity Hunts can be changed under the Liquidity Hunt setting. Much like with pivots, it is recommended to change these numbers with the same value for best results.
Due to the complexity of the math, Some liquidity pivots will only confirm and display a pivot tag after twice the candles defined have been found to the left and right under liquidity hunt settings, and some will display after the exact number specified in settings. As noted previous some will not display at all due to the high probability nature of this indicator and having been found as a "cluster" in the Supply and Demand Boxes.
Supply and Demand Boxes: Supply and Demand boxes will be created when a specific number of pivots are found in succession or in a "cluster" and a box will be drawn from the current grouping of pivots, first pivot high to the nearest pivot low in the cluster. This unique style of supply and demand box drawing has been proven to be an effective identifier of buying and selling in the price action, or likewise support or resistance upon return to these boxes. The boxes were specifically designed to identify high probability areas of Supply and Demand and are more likely to be areas of high probability buying and selling. Supply is when price action moves into or creates an area where sellers are waiting. Demand is when price action moves into or creates an area where Buyers are waiting. When price action creates a box, the box will remain Neutral with a white color while Price action remains within the box. This box will turn Red or into a Supply Box, when price action drops below the box boundaries. The box will likewise turn Green or into a Demand Box, when price action rises above the box boundaries. Any return to a colored box from the direction it was created could be anticipated as a retracement to continue in the direction of price action indicated by the box.
In the settings boxes can be extended to the current bar right to show previous areas of supply and demand, or can be left "Truncated" or in box form as a highlighter for cluster analysis.
Previous Days High and Low: The previous days High and low will be displayed on the current day as a magenta line. Some traders use these lines to anticipate price action on the day compared to where price action is moving relative to the previous day. Historical Magenta lines are also the marked on a specific day, for the previous days High and low. Historical Lines can be turned off by reducing Opacity of the setting to Zero, leaving only the previous days high and low on the current day.
Dynamic Trend Lines: Trend Lines will be created automatically that will connect unbroken pivots and extend right, highlighting the current trend. (Coming Soon™️)
Fibonacci Discount Zone: The Fibonacci Discount Zone can be found by measuring an unbroken pivot High or Low, that breaks structure left to create a new High or Low. When structure is broken and price begins a retracement before moving back in the direction of the broken structure, the retracement is typically back into the "Discount Zone" between the 618 and 786 Fibonacci zone. This zone will be automatically plotted as a light grey box in the background of the chart. (Coming Soon™️)
Cari skrip untuk "pivot"

Smart Market Matrix Smart Market Matrix
This indicator is designed for intraday, scalping, providing automated detection of price pivots, liquidity traps, and breakout confirmations, along with a context dashboard featuring volatility, trend, and volume.
## Summary Description
### Menu Settings & Their Roles
- **Swing Pivot Strength**: Controls the sensitivity for detecting High/Low pivots.
- **Show Pivot Points**: Toggles the display of HH/LL markers on the chart.
- **VWMA Length for Trap Volume** & **Volume Spike Multiplier**: Identify concentrated volume spikes for liquidity traps.
- **Wick Ratio Threshold** & **Max Body Size Ratio**: Detect candles with disproportionate wicks and small bodies (doji-ish) for traps.
- **ATR Length for Trap**: Measures volatility specific to trap detection.
- **VWMA Length for Breakout Volume**, **ATR Multiplier for Breakout**, **ATR Length for Breakout**, **Min Body/Range Ratio**: Set adaptive breakout thresholds based on volatility and volume.
- **OBV Smooth Length**: Smooths OBV momentum for breakout confirmation.
- **Enable VWAP Filter for Confirmations**: Optionally validate breakouts against the VWAP.
- **Enable Higher-TF Trend Filter** & **Trend Filter Timeframe**: Align breakout signals with the 1h/4h/Daily trend.
- **ADX Length**, **EMA Fast/Slow Length for Context**: Parameters for the context dashboard (Volatility, Trend, Volume).
- **Show Intraday VWAP Line**, **VWAP Line Color/Width**: Display the intraday VWAP line with custom style.
### Signal Interpretation Map
| Signal | Description | Recommended Action |
|--------------------------------|-----------------------------------------------------------|-------------------------------------------|
| 📌 **HH / LL (pivot)** | Market structure (support/resistance) | Note key levels |
| **Bull Trap(green diamond)** | Sweep down + volume spike + wick + rejection | Go long with trend filter
| **Bear Trap(red diamond)** | Sweep up + volume spike + wick + rejection | Go short with trend filter
| 🔵⬆️ **Breakout Confirmed Up** | Close > ATR‑scaled high + volume + OBV↑ | Go long with trend filter |
| 🔵⬇️ **Breakout Confirmed Down** | Close < ATR‑scaled low + volume + OBV↓ | Go short with trend filter |
| 📊 **VWAP Line** | Intraday reference to guide price | Use as dynamic support/resistance |
| ⚡ **Volatility** | ATR ratio High/Med/Low | Adjust position size |
| 📈 **Trend Context** | ADX+EMA Strong/Moderate/Weak | Confirm trend direction |
| 🔍 **Volume Context** | Breakout / Rising / Falling / Calm | Check volume momentum |
*This summary gives you a quick overview of the key settings and how to interpret signals for efficient intraday scalping.*
### Suggested Settings
- **Intraday Scalping (5m–15m)**
- `Swing Pivot Strength = 5`
- `VWMA Length for Trap Volume = 10`, `Volume Spike Multiplier = 1.6`
- `ATR Length for Trap = 7`
- `VWMA Length for Breakout Volume = 12`, `ATR Length for Breakout = 9`, `ATR Multiplier for Breakout = 0.5`
- `Min Body/Range Ratio for Breakout = 0.5`, `OBV Smooth Length = 7`
- `Enable Higher-TF Trend Filter = true` (TF = 60)
- `Show Intraday VWAP Line = true` (Color = orange, Width = 2)
- **Swing Trading (4h–Daily)**
- `Swing Pivot Strength = 10`
- `VWMA Length for Trap Volume = 20`, `Volume Spike Multiplier = 2.0`
- `ATR Length for Trap = 14`
- `VWMA Length for Breakout Volume = 30`, `ATR Length for Breakout = 14`, `ATR Multiplier for Breakout = 0.8`
- `Min Body/Range Ratio for Breakout = 0.7`, `OBV Smooth Length = 14`
- `Enable Higher-TF Trend Filter = true` (TF = D)
- `Show Intraday VWAP Line = false`
*Adjust these values based on the symbol and market volatility for optimal performance.*

CARNAC Trading - Dynamic Support and Resistance LevelsThe **CARNAC Trading - Dynamic Support and Resistance Levels** indicator is designed to help traders identify key support and resistance levels on any chart timeframe. This indicator dynamically detects major support and resistance levels based on historical price pivots and displays them as lines on the chart. The levels are color-coded for easy identification—**green lines** represent support levels below the current price, while **red lines** represent resistance levels above the current price.
Key Features:
- Dynamic Support/Resistance Detection**: Automatically identifies the strongest support and resistance levels on the chart.
- Timeframe Selection**: Allows users to choose a specific timeframe for detecting support and resistance levels, independent of the chart's timeframe.
- Pivot Strength and Lookback Period**: Customizable inputs to control how far back the indicator looks and how strong the pivots need to be for support/resistance detection.
- Level Limitation**: Limits the number of support and resistance lines to keep charts clean, ensuring only the most relevant levels are displayed.
---
How to Use the Indicator:
Inputs and Settings:
1. **Lookback Period**: Defines how many bars back the indicator will consider for detecting support and resistance levels. You can adjust this depending on how much historical data you want to include. A larger value will capture more significant levels, while a smaller value focuses on more recent price action.
2. **Pivot Strength**: This setting determines how significant a high or low must be to qualify as a pivot. A higher pivot strength will capture stronger, more critical levels, while a lower value will detect more frequent, minor pivots.
3. **Max Levels Above/Below Price**: This controls the maximum number of support and resistance levels displayed on each side of the current price. Keeping this number low helps reduce clutter and focuses on the most important levels.
4. **Timeframe for Support/Resistance Detection**: Select the timeframe used for detecting support and resistance levels, which can differ from the chart's timeframe. This is helpful when you're trading on shorter timeframes but want to see key levels from a higher timeframe (e.g., detecting daily levels while trading intraday).
---
Visualization:
- **Green Lines**: Represent support levels below the current price. These are potential areas where buying interest may increase, and the price could bounce upwards.
- **Red Lines**: Represent resistance levels above the current price. These are potential areas where selling interest may increase, and the price could fall downwards.
---
Example Usage:
1. **Identifying Support and Resistance Zones**: Use this indicator to identify critical support and resistance zones. These are areas where the price has historically reversed or paused, making them ideal for setting entry, exit, stop-loss, or take-profit levels.
2. **Trend Analysis**: By observing which side of the current price the majority of lines are on (more red or more green), traders can gauge whether the market is facing more resistance or support, helping them align with the current trend.
3. **Timeframe Flexibility**: You can choose to detect support and resistance levels from higher timeframes (e.g., Daily or Weekly) while trading on lower timeframes (e.g., 15-minute or 1-hour charts). This gives you a macro-level view of key price levels while executing trades on the micro-level.
---
Recommendations:
- **Swing Traders**: Use this indicator with a larger lookback period and higher pivot strength to capture major long-term support and resistance levels.
- **Scalpers and Intraday Traders**: Use shorter lookback periods and lower pivot strengths to detect key levels within a shorter timeframe.
By customizing the inputs and tailoring them to your trading style, this indicator can provide valuable insights into price levels where significant buying or selling activity is likely to occur, helping you make more informed trading decisions.
IPB_PBOThis indicator is called Indian Pivot Boss _ Pivot Based Oscillator.
This is an oscillator based on pivot level of each candle. It is based on the concept outlined in the Secrets of Pivot Boss book.
It is the average of mutual differences between fast moving average, medium moving average and slow moving average of the candle pivots. This is then plotted as an oscillator.
When Pivot based oscillator is sloping upwards, it is suggested NOT TO STAY ON THE SHORT SIDE. Staying long side or Keeping quiet are the desirable options.
When Pivot based oscillator is sloping downwards, it is suggested NOT TO STAY ON THE LONG SIDE. Staying short side or Keeping quiet are the desirable options.
This indicator has to be used in conjunction with other indicators and should not be relied on a solo basis.

Support/Resistance With Breaks & Bounces [MyTradingCoder]This script uses the built-in pivothigh/pivotlow functions to find and identify new levels of basic support and resistance. The script will also automatically identify the first occurrence of a bounce/rejection off the most recent green/red line as well as automatically identify the first occurrence of a breakout of the most recent green/red line. This is a very basic, but effective indicator that is well written, and open source for anyone to learn from or build off of.
All details needed to understand how to use the script are listed below. Enjoy!
Customizable inputs:
- Option to change how pivot points are calculated('candle body' or 'candle wicks')
- Option to change the sensitivity of the pivots(leftbars and rightbars linked)
- Option to change the line width
Available Alert Options:
- Red Line Breakout
- Red Line Bounce/Rejection
- Green Line Breakout
- Green Line Bounce/Rejection
User Manual:
- All calculations are done on the last update of the bar(candle close)
- Only 1 breakout will be allowed per line
- Only 1 rejection will be allowed per line
- If the text is red, then the signal is related to the 'red line', if the text is green, then the signal is related to the 'green line'
- The code is open source, and is programmed using arrays/loops out of the gate, despite not needing to do so. This allows for easy modifications to the scripts behavior while keeping the functionality without it breaking.
- Pivot Rightbars is hardcoded to the same value for leftbars(leftbars = sensitivity). Uncomment the input for right_bars if you want the ability to change the rightbars independently from the leftbars
- When a new line is identified, the old one will stop updating, and no longer be considered for breakout/rejections. This can be changed with a bit of pine knowledge by performing some slight modifications to the code.
- When a new line is drawn, the old line will move backwards a little bit for cleanliness/clarity purposes
- If you have any questions/comments/requests/concerns please leave them down in the comments below
- Don't forget to leave a like if you find this script useful

CPR by WsrWe recommend some preconditions for Intraday Trading Strategy with CPR (Central Pivot Range)
Rules For BUY Setup with CPR
1) Today's Pivot Level Should be higher than Previous Day's Pivot Level
2) The previous day's close should be near day's high.
Rules For SELL Setup with CPR
1) Today's Pivot Level Should be lower than Previous Day's Pivot Level
2) The previous day's close should be near day low.
CPR or central pivot range is the best tool available for the trader to see the price base indicator. You can use this tool i.e CPR (central pivot range) to check the price indicator in the stock market. You know the price of shares sometimes goes up or sometimes goes down in the stock market. So it will be best to stay updated and know it before the time the share market/stock market fall or rises.
Smart Levels📊 SMART LEVELS - Dynamic Support & Resistance Indicator
═══════════════════════════════════════════════════════════════
🎯 OVERVIEW
Smart Levels is an advanced support and resistance indicator that automatically identifies and displays the most significant price levels based on historical pivot points. Unlike simple pivot indicators, Smart Levels uses intelligent clustering and weighting algorithms to merge nearby extremums and highlight only the most reliable levels that matter for trading decisions.
This indicator emphasizes identifying key price levels where multiple pivot points converge, creating zones of increased probability for price reactions.
═══════════════════════════════════════════════════════════════
🔧 HOW IT WORKS
1. PIVOT POINT DETECTION
The indicator scans historical price data to identify pivot highs and pivot lows using configurable left/right bar parameters. Each detected extremum represents a potential support or resistance point where price previously reversed.
2. INTELLIGENT LEVEL CLUSTERING
KEY INNOVATION: Instead of drawing a line at every pivot point, Smart Levels uses an ATR-based clustering algorithm to merge nearby extremums into consolidated levels.
• Extremums within a specified percentage of ATR are grouped together
• The level price is calculated as a weighted average of all contributing pivot points
• This eliminates visual clutter and focuses on truly significant zones
3. TOUCH-BASED LEVEL RANKING
Levels are ranked by the number of pivot points (touches) that contributed to them:
• 5+ touches: Strong levels (solid lines, thicker width)
• 2-4 touches: Moderate levels (dashed lines, standard width)
• Only levels meeting the minimum touch threshold are displayed
4. LEVEL CLASSIFICATION
Each level is automatically classified based on the types of extremums it contains:
• 🟢 SUPPORT - Contains only pivot lows (green)
• 🔴 RESISTANCE - Contains only pivot highs (red)
• 🔵 MIRROR LEVEL - Contains both highs and lows, indicating a level that has acted as both support and resistance (blue)
═══════════════════════════════════════════════════════════════
📋 KEY FEATURES
✨ SMART LEVEL DETECTION
• ATR-Adaptive Clustering: Automatically adjusts merge zones based on market volatility
• Configurable History: Look back 50-500 bars to find relevant levels
• Touch-Based Filtering: Only show levels with minimum confirmation (2-10 touches)
• Top N Display: Automatically displays the strongest 3-20 levels to avoid clutter
📊 DETAILED PRICE INFORMATION
• Multi-Line Price Labels: Each level shows ALL contributing pivot prices in a vertical list
• Labels display the exact historical prices that formed the level
• Visual classification icons (↑ support, ↓ resistance, 🔄 mirror)
• Labels positioned to the right of current price for clear visibility
🎨 VISUAL CUSTOMIZATION
• Customizable colors for support, resistance, and mirror levels
• Automatic line styling based on level strength
• Optional debug mode showing all detected pivot points
• Highlight feature that marks which extremums contributed to displayed levels
📈 REAL-TIME UPDATES
• Levels recalculate on every bar for dynamic adaptation
• Lines extend into the future for forward-looking analysis
• Information table shows current ATR, merge zone, and level statistics
═══════════════════════════════════════════════════════════════
⚙️ INPUT PARAMETERS
EXTREMUM DETECTION
• Bars Left (7) - Number of bars to the left for pivot detection (2-20)
• Bars Right (7) - Number of bars to the right for pivot detection (2-20)
• Lookback History (200) - How many bars back to analyze for levels (50-500)
LEVEL SETTINGS
• Merge Percent (0.8% ATR) - Maximum distance to cluster extremums (0.2-3.0%)
• Minimum Touches (2) - Minimum pivot points required to display a level (2-10)
• Maximum Levels (10) - How many top levels to display (3-20)
VISUAL OPTIONS
• Support Color (Green) - Color for support levels
• Resistance Color (Red) - Color for resistance levels
• Mirror Color (Blue) - Color for mirror levels
• Show Debug Pivots - Display all detected pivot points
• Highlight Used Extremums - Mark extremums that form displayed levels
═══════════════════════════════════════════════════════════════
📖 HOW TO USE
BASIC SETUP
1. Add the indicator to your chart (works on any timeframe)
2. Start with default parameters and observe the detected levels
3. Adjust "Minimum Touches" to filter more/less levels
4. Tune "Merge Percent" based on your timeframe and instrument volatility
TRADING APPLICATIONS
1. Entry Timing: Watch for price reactions at identified levels for potential entry points
2. Stop Loss Placement: Place stops beyond strong levels (5+ touches)
3. Target Selection: Use the next significant level as a profit target
4. Breakout Confirmation: Monitor for decisive breaks of strong resistance/support levels
5. Mirror Level Strategy: Blue levels that flip from support to resistance (or vice versa) can provide high-probability setups
INTERPRETATION TIPS
• Solid thick lines (5+ touches) = Extremely reliable levels with strong historical significance
• Dashed lines (2-4 touches) = Valid levels but with less confirmation
• Mirror levels (blue) = Highest probability zones as they've worked in both directions
• Check the price labels to see the exact historical prices that formed each level
RECOMMENDED SETTINGS BY TIMEFRAME
• Scalping (1m-5m): Lookback 100-150, Merge 0.5-0.8%, Min Touches 2-3
• Intraday (15m-1h): Lookback 150-200, Merge 0.8-1.2%, Min Touches 3-4
• Swing (4h-1D): Lookback 200-300, Merge 1.0-1.5%, Min Touches 3-5
• Position (1D-1W): Lookback 300-500, Merge 1.5-2.0%, Min Touches 4-6
═══════════════════════════════════════════════════════════════
🔍 DEBUG FEATURES
Enable the debug options to understand how the indicator works:
• Show Debug Pivots: Displays small triangles at all detected pivot points (faded)
• Highlight Used Extremums: Bright colored triangles show which pivots contributed to displayed levels
• Info Table: Shows current ATR, merge zone size, number of detected extremums, and active levels
These features help you fine-tune parameters and understand why certain levels appear or disappear.
═══════════════════════════════════════════════════════════════
⚡ TECHNICAL DETAILS
• Version: Pine Script v5
• Overlay: Yes (draws directly on price chart)
• Maximum Lines: 50 (configurable limit)
• Maximum Labels: 50 (configurable limit)
• ATR Period: 14 bars (standard volatility measurement)
• Calculation Method: Weighted average of clustered pivot points
• Update Frequency: Every bar (dynamic recalculation)
═══════════════════════════════════════════════════════════════
💡 WHAT MAKES THIS INDICATOR ORIGINAL
1. INTELLIGENT CLUSTERING ALGORITHM
Unlike basic pivot indicators that draw every level, Smart Levels uses ATR-adaptive clustering to merge nearby extremums, highlighting only the most significant zones
2. DETAILED PRICE HISTORY
Multi-line labels show ALL historical prices that formed each level, providing transparency about level formation
3. DYNAMIC STRENGTH VISUALIZATION
Automatic line styling (solid vs dashed, thickness) based on level confirmation strength
4. MIRROR LEVEL DETECTION
Identifies zones that have acted as both support AND resistance, which are statistically more reliable
5. REAL-TIME ADAPTATION
Continuous recalculation ensures levels remain relevant as new price action develops
6. VISUAL DEBUGGING SYSTEM
Comprehensive tools to understand level formation and tune parameters effectively
═══════════════════════════════════════════════════════════════
⚠️ IMPORTANT NOTES
• This indicator identifies historical support/resistance zones - it does NOT predict future price movements
• Always combine with other forms of analysis (trend, volume, fundamentals) for trading decisions
• Levels can break - use proper risk management and stop losses
• Higher timeframes generally produce more reliable levels
• On first load, the indicator needs leftBars + rightBars bars to detect the first pivots
═══════════════════════════════════════════════════════════════
📚 METHODOLOGY BACKGROUND
This indicator implements a clustering-based approach to support and resistance analysis, which emphasizes:
• Identifying price levels where multiple extremums converge
• Focusing on the strongest, most tested levels rather than every minor pivot
• Using historical price behavior to anticipate future support/resistance
• Combining level analysis with proper risk management and position sizing
The clustering approach ensures that levels represent genuine zones of supply/demand accumulation rather than isolated price spikes, making them more reliable for trading decisions.
═══════════════════════════════════════════════════════════════

Advanced Support & Resistance [Alpha Extract]🔶 AE - Advanced Support & Resistance
A sophisticated yet user-friendly tool designed to enhance your trading analysis by accurately identifying and plotting key support and resistance levels. Built on a unique pivot-based detection algorithm, this indicator provides clear visual cues in real time, helping traders stay ahead of potential market reversals and breakouts.
🔶 Pivot-Based Detection
Leverages pivot highs and lows along with a configurable threshold to filter out overlapping levels. This method helps the script stand out from simpler support/resistance indicators by focusing on the most significant price zones.
🔶 Multi-Timeframe Analysis
Pulls higher-timeframe data to ensure that critical levels remain visible and properly scaled, regardless of your current chart view. This prevents distortion and offers a more comprehensive perspective of market structure.
🔶 Break Signal Alerts
Generates breakout or breakdown signals whenever the price crosses above or below a detected level—labeled as RB (Resistance Break) or SB (Support Break)—so traders can quickly spot shifts in momentum or trend.
🔶 Customizable Parameters
Fine-tune sensitivity and appearance—adjust pivot bar settings, lookback periods, thresholds, and the maximum number of plotted levels to match your trading style and preferences.
// === USER INPUTS ===
pivotLeft = input.int(15, "Left Pivot Bars", minval=1)
pivotRight = input.int(15, "Right Pivot Bars", minval=1)
lookback = input.int(200, "Lookback Period", minval=50)
threshold = input.float(0.2, "Price Threshold %", minval=0.1, step=0.1)
maxLevels = input.int(10, "Maximum Levels", minval=1)
📊How It Works
🔶 Identifying Pivots
The script scans for pivot highs and lows within a user-defined range of bars (Left Pivot Bars and Right Pivot Bars). Each pivot is evaluated against a proximity threshold, ensuring that similar nearby levels are combined into a single zone rather than cluttering the chart.
// === SUPPORT & RESISTANCE DETECTION ===
ph = ta.pivothigh(high, pivotLeft, pivotRight)
pl = ta.pivotlow(low, pivotLeft, pivotRight)
🔶Automatic Updates & Removal
Levels that remain untested or break too frequently are automatically removed based on the configured lookback period, keeping your chart focused on the most relevant support/resistance zones.
🔶Fixed Scaling
Through the use of higher-timeframe anchoring, the indicator maintains consistent plot lines that won’t distort when you zoom in or out. This approach ensures you always see crucial levels clearly.
🔶Entry and Exit Points
Pinpoint potential entry and exit opportunities based on how price interacts with these zones.
🔶Risk Management
Place stop-loss and take-profit orders around these levels to manage trade risk more effectively.
🔶Trend Confirmation
Observe how price respects or breaks levels to confirm ongoing trends or detect early signs of reversal.
🔶Sensitivity Adjustment
Control pivot bar width (pivotLeft and pivotRight) and the proximity threshold to focus on major or minor price zones.
🔶Visualization Options
Adjust line colors, styles, and thickness to align with your charting preferences.
🔶Maximum Levels
Limit the number of displayed levels to keep your chart clean and free of unnecessary clutter.

The Multi-day Central Pivot RangeThe indicator is a Multi-day CPR.
It shows CPR range as per yesterday's HLC and also CPR range for last n number of trading sessions.
For example: If you mention the value as two in Multi-day CPR (blue color) then it calculates the CPR using HLC of the last two trading sessions.
Also, the daily CPR is designed in such a way to highlight Virgin CPR (purple color) separately from the normal CPR(fuchsia color) .

ATR ZigZag BreakoutATR ZigZag Breakout
This strategy uses my ATR ZigZag indicator (powered by the ZigZagCore library) to scalp breakouts at volatility-filtered highs and lows.
Everyone knows stops cluster around clear swing highs and lows. Breakout traders often pile in there, too. These levels are predictable areas where aggressive orders hit the tape. The idea here is simple:
→ Let ATR ZigZag define clean, volatility-filtered pivots
→ Arm a stop market order at those pivots
→ Join the breakout when the crowd hits the level
The key to greater success in this simple strategy lies in the ZigZag. Because the pivots are filtered by ATR instead of fixed bar counts or fractals, the levels tend to be more meaningful and less noisy.
This approach is especially suited for intraday trading on volatile instruments (e.g., NQ, GC, liquid crypto pairs).
How It Works
1. Pivot detection
The ATR ZigZag uses an ATR-based threshold to confirm swing highs and lows. Only when price has moved far enough in the opposite direction does a pivot become “official.”
2. Candidate breakout level
When a new swing direction is detected and the most recent high/low has not yet been broken in the current leg, the strategy arms a stop market order at that pivot.
• Long candidate → most recent swing high
• Short candidate → most recent swing low
These “candidate trades” are shown as dotted lines.
3. Entry, SL, and TP
If price breaks through the level, the stop order is filled and a bracket is placed:
• Stop loss = ATR × SL multiplier
• Take profit = SL distance × RR multiplier
Once a level has traded, it is not reused in the same swing leg.
4. Cancel & rotate
If the market reverses and forms a new swing in the opposite direction before the level is hit, the pending order is cancelled and a new candidate is considered in the new direction.
Additional Features
• Optional session filter for backtesting specific trading hours

Clean CPR for Intraday, Swing trading✅ Clean CPR for Intraday & Swing Trading (NSE-Optimized)
Simple, Accurate, No-Clutter CPR levels for NIFTY, BANKNIFTY, FINNIFTY & Stocks
Perfect for Indian intraday & swing traders who want clean charts, reliable zones, and fast decision-making without overcomplicated indicators.
✅ 📌 Short Summary
This indicator plots Previous Day High/Low, CPR, Support & Resistance, and high-probability shaded zones (PH↔R1 & PL↔S1). It’s built specifically to help Indian traders identify reversal zones, breakout levels, and trend direction quickly — without chart noise or unnecessary lines.
✅ 🔍 What This CPR Indicator Does
A clean, beginner-friendly version of CPR built for practical trading in NSE markets.
1️⃣ Previous Day High & Low (PH / PL)
Plots yesterday’s high & low with price labels
These act as powerful reference levels used heavily in Indian intraday setups
Helps spot opening range breakouts, rejections, and pullback entries
2️⃣ Central Pivot Range (CPR)
CPR gives the market structure for the day
Price above CPR → Bullish bias
Price below CPR → Bearish bias
Narrow CPR → Possible trending day
Wide CPR → Likely sideways market
This is especially useful in NIFTY, BANKNIFTY, which reacts strongly to CPR width.
3️⃣ Support & Resistance Levels (R1 / S1)
Plots the first major resistance and support levels
You can plot R1 to R5, S1 to S5
Each Line can be same or different color as per your choice
4️⃣ Smart Shaded Zones (High-Probability Areas)
These shaded blocks highlight the most important reversal zones:
✅ Resistance Zone → Area between PH and R1
✅ Support Zone → Area between PL and S1
These zones often act as:
Bounce areas
Reversal regions
Ideal trade entry/exit points
Especially powerful when combined with opening range & volume spikes.
5️⃣ Current Day Open Line
Shows the opening price of today, a key reference for:
Trend confirmation
Intraday bias
Opening drive setups
6️⃣ Clean Design — No Clutter
Old historic zones are automatically removed
Only the useful previous session zones remain
All prices shown as whole numbers (no decimals)
Clear labels, clean zones, easy to read even on mobile
✅ Why This Is Perfect for Indian Traders
This indicator is optimized for:
NIFTY Futures / Options
BANKNIFTY Futures / Options
FINNIFTY
NSE Stocks
Index scalping & options trading
Indian intraday traders rely heavily on:
Previous Day High/Low
CPR width
R1/S1 reactions
Day Open behavior
PH↔R1 reversal zones
PL↔S1 support zones
This tool highlights all of them automatically, without crowding your chart.
✅ Who Should Use This
✔ New traders
✔ Intraday scalpers
✔ Swing traders
✔ Option buyers/sellers
✔ Anyone who wants a clean CPR layout without confusing extras
✅ Benefits
Clear bullish/bearish bias
High-precision reversal zones
Better entries/exits
Faster chart reading
No overthinking — the zones show themselves

The Barking Rat PROThe Barking Rat PRO is designed around high/low pivot structure to capture meaningful market reversals. It intelligently identifies turning points by combining higher high/lower low (HH/LL) pivot detection, Fair Value Gap (FVG) confirmation, volatility-aware filters, and momentum checks. Unique features, such as a one-bar flip handler and a contextual ribbon overlay, provide traders with both clarity and precision. These tools help isolate high-probability setups while filtering out low-conviction signals, making trade opportunities easier to spot and act upon.
🧠 Core Logic: Structure-First, Filtered Reversals
The strategy takes a methodical, disciplined approach, prioritizing structural pivots over random signals. By layering multiple validation checks—structural pivots, gap confirmation, volatility filters, and momentum alignment—it highlights trades with high conviction while reducing exposure to noisy market conditions. The result is a clear, repeatable framework for reversal trading that can be applied across timeframes.
HH/LL Pivot Framework
Trades are triggered based on simple structural pivots: higher highs (HH) and lower lows (LL). When a structure flip occurs, the strategy either opens a new position or executes a one-bar delayed flip if an opposing position already exists. This ensures smooth transitions and avoids premature entries on minor market swings, keeping trading decisions focused on meaningful trend shifts.
Volatility & Distance Filters
To avoid low-quality trades, entries are validated against relative volatility, ensuring that pivots represent significant market movement. Trades must also be sufficiently spaced from previous entries and separated by a minimum number of bars, which prevents overtrading and clustered signals that can dilute performance.
Momentum Filter (RSI)
The strategy optionally aligns entries with momentum conditions using RSI. Long trades are favored when RSI is relatively low, suggesting potential exhaustion on the downside, while short trades are favored when RSI is relatively high, indicating potential overextension on the upside. This additional layer improves timing, helping traders avoid entering against strong, ongoing momentum.
Background Ribbon (Contextual Visuals)
A translucent ribbon overlays the chart to provide visual context of active trades. The ribbon displays volatility envelopes and position direction: green for long trades, red for short trades. It enhances clarity by giving traders a quick visual reference of the market environment without cluttering the chart.
Why These Parameters Were Chosen
The strategy focuses only on structurally meaningful pivots to ensure high-conviction trades.
Volatility filters confirm that trade signals are significant relative to recent price action, while FVG confirmation captures institutional-style imbalances.
Momentum and spacing rules prevent low-quality entries and overtrading, while the one-bar flip handler ensures seamless transitions when the structure reverses.
Ribbon overlays provide intuitive, real-time visualization of active trades and market context.
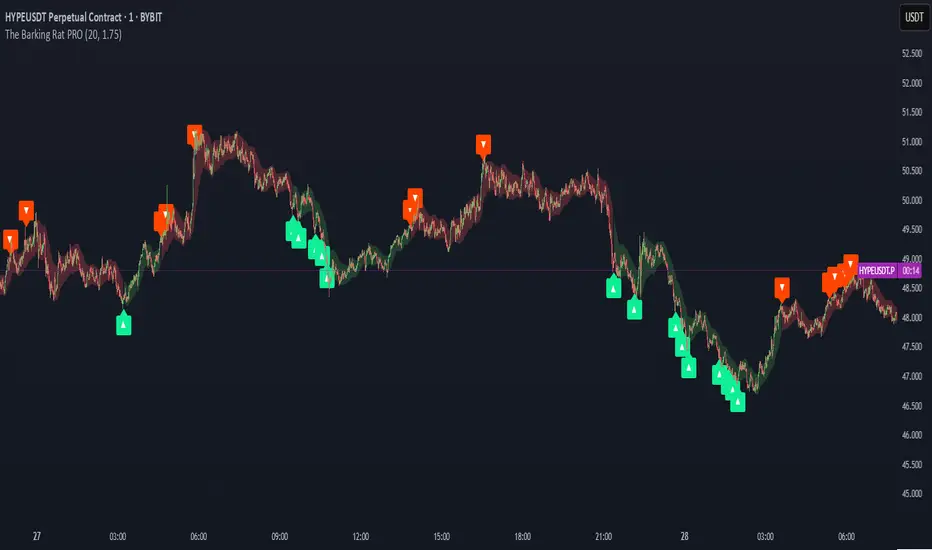
📈 Chart Visuals: Clear & Intuitive
- Green “▲” below a candle: Long entry triggered on LL → HH structure flip
- Red “▼” above a candle: Short entry triggered on HH → LL structure flip
- Translucent Ribbon: Green when long, Red when short
🔔 Alerts: Stay Notified Without Watching
The strategy supports real-time alerts on candle close, ensuring that only fully confirmed signals trigger notifications.
You must manually configure alerts within your TradingView account. Once set up, a single alert per instrument covers all relevant entries and exits, making hands-free monitoring simple and efficient.
⚙️ Strategy Report Properties
Position size: 25% of equity per trade
Initial capital: 10,000.00 USDT
Pyramiding: 25 entries per direction
Slippage: 2 ticks
Commission: 0.055% per side
Backtest timeframe: 1-minute
Backtest instrument: HYPEUSDT
Backtesting range: Aug 11, 2025 — Aug 28, 2025
💡Why 25% Equity Per Trade?
While it's always best to size positions based on personal risk tolerance, we defaulted to 25% equity per trade in the backtesting data — and here’s why:
Backtests using this sizing show manageable drawdowns even under volatile periods
The strategy generates a sizeable number of trades, reducing reliance on a single outcome
Combined with conservative filters, the 25% setting offers a balance between aggression and control
Users are strongly encouraged to customize this to suit their risk profile.
🔍 What Makes This Strategy Unique?
HH/LL Pivot Focus: Trades pivot structure flips instead of relying on generic indicators.
Fair Value Gap Confirmation: Only pivots supported by FVGs are acted upon, reducing noise.
One-Bar Flip Handler: Ensures clean transitions when the structure reverses, avoiding same-bar conflicts.
Volatility & Spacing Filters: Trades require sufficient movement from prior entries and minimum bar spacing to maintain quality.
Momentum-Aware Entries: RSI alignment favors entries near potential exhaustion points, improving signal reliability.
Contextual Ribbon Overlay: Visualizes volatility and active positions clearly, without cluttering the chart.
Machine Learning Key Levels [AlgoAlpha]🟠 OVERVIEW
This script plots Machine Learning Key Levels on your chart by detecting historical pivot points and grouping them using agglomerative clustering to highlight price levels with the most past reactions. It combines a pivot detection, hierarchical clustering logic, and an optional silhouette method to automatically select the optimal number of key levels, giving you an adaptive way to visualize price zones where activity concentrated over time.
🟠 CONCEPTS
Agglomerative clustering is a bottom-up method that starts by treating each pivot as its own cluster, then repeatedly merges the two closest clusters based on the average distance between their members until only the desired number of clusters remain. This process creates a hierarchy of groupings that can flexibly describe patterns in how price reacts around certain levels. This offers an advantage over K-means clustering, since the number of clusters does not need to be predefined. In this script, it uses an average linkage approach, where distance between clusters is computed as the average pairwise distance of all contained points.
The script finds pivot highs and lows over a set lookback period and saves them in a buffer controlled by the Pivot Memory setting. When there are at least two pivots, it groups them using agglomerative clustering: it starts with each pivot as its own group and keeps merging the closest pairs based on their average distance until the desired number of clusters is left. This number can be fixed or chosen automatically with the silhouette method, which checks how well each point fits in its cluster compared to others (higher scores mean cleaner separation). Once clustering finishes, the script takes the average price of each cluster to create key levels, sorts them, and draws horizontal lines with labels and colors showing their strength. A metrics table can also display details about the clusters to help you understand how the levels were calculated.
🟠 FEATURES
Agglomerative clustering engine with average linkage to merge pivots into level groups.
Dynamic lines showing each cluster’s price level for clarity.
Labels indicating level strength either as percent of all pivots or raw counts.
A metrics table displaying pivot count, cluster count, silhouette score, and cluster size data.
Optional silhouette-based auto-selection of cluster count to adaptively find the best fit.
🟠 USAGE
Add the indicator to any chart. Choose how far back to detect pivots using Pivot Length and set Pivot Memory to control how many are kept for clustering (more pivots give smoother levels but can slow performance). If you want the script to pick the number of levels automatically, enable Auto No. Levels ; otherwise, set Number of Levels . The colored horizontal lines represent the calculated key levels, and circles show where pivots occurred colored by which cluster they belong to. The labels beside each level indicate its strength, so you can see which levels are supported by more pivots. If Show Metrics Table is enabled, you will see statistics about the clustering in the corner you selected. Use this tool to spot areas where price often reacts and to plan entries or exits around levels that have been significant over time. Adjust settings to better match volatility and history depth of your instrument.

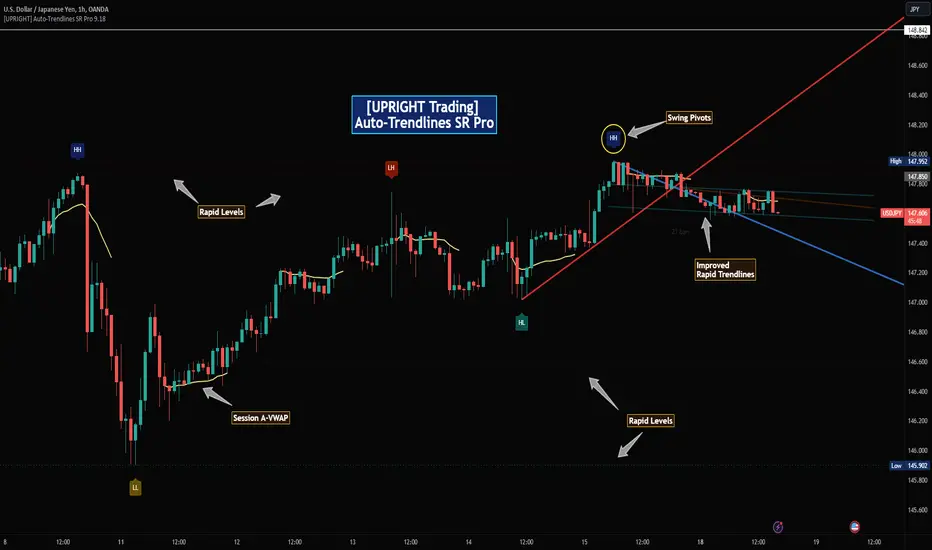
[UPRIGHT Trading] Auto-Trendlines Pro (cc)Hello Traders -
Today I am releasing a full-featured auto-trendline indicator.
This makes it easier for beginners and professionals alike to analyze a charts trending support and resistance.
What are Trendlines and why do we use them?
In short, a trendline is a diagonal line that connects to two or more price points on a chart to show the current direction of price. These are used to identify and confirm trend direction in technical analysis and show support and resistance points.
Utilizing pivot points and different calculations for sources we're able to create the trendlines; with adjustable slopes (or just use of proprietary calculations) we are able to make these lines to line up with the current trend.
How it's different:
Accurate auto-drawn calculated trendlines.
Fully customizable - the ability to adjust the trendlines easily to exact specifications with every type of trader in mind.
Can be used to spot long trend as well as short, by adjusting length or using extend both to see previous pivots it's touched.
Then retracted, for perfect long trend.
Can show old trendlines for analysis (click image to see).
Auto-labels Higher-Highs, Higher-Lows, Lower-Highs, Lower-Lows at pivots.
Lining up trendlines with Break signals can help provide more accurate trendlines (potentially teaching) beginners how to draw them better.
Signature double trendline set.
Also notice the additional sell/buy signals (shown above).
Squeeze / Low-float mode adjusts to fit big moves.
Adjust the opacity to hide or fade a line (as seen above).
Pre-filled alerts for breakouts / breakdowns.
Please see author instructions for access.
Cheers,
Mike
(UPRIGHT Trading)
Bifurcation Point Adaptive (Auto Oscillator ML)Bifurcation Point Adaptive - Auto Oscillator ML
Overview
Bifurcation Point Adaptive (🧬 BPA-ML) represents a paradigm shift in divergence-based trading systems. Rather than relying on static oscillator settings that quickly become obsolete as market dynamics shift, BPA-ML employs multi-armed bandit machine learning algorithms to continuously discover and adapt to the optimal oscillator configuration for your specific instrument and timeframe. This self-learning core is enhanced by a Cognitive Analytical Engine (CAE) that provides market-state intelligence, filtering out low-probability setups before they reach your chart.
The result is a system that doesn't just detect divergences - it understands context, learns from outcomes, and evolves with the market.
What Sets This Apart: Technical Comparison
The TradingView community has many excellent divergence indicators and several claiming "machine learning" capabilities. However, a detailed technical analysis reveals that BPA-ML operates at a fundamentally different level of sophistication.
Machine Learning: Real vs Marketing
Most indicators labeled "ML" or "AI" on TradingView use one of three approaches:
K-Nearest Neighbors (KNN): These indicators find similar historical patterns and assume current price will behave similarly. This is pattern matching, not learning. The system doesn't improve over time or adapt based on outcomes - it simply searches historical data for matches.
Clustering (K-Means): These indicators group volatility or market states into categories (high/medium/low). This is statistical classification, not machine learning. The clusters are recalculated but don't learn which classifications produce better results.
Gaussian Process Regression (GPR): These indicators use kernel weighting to create responsive moving averages. This is advanced curve fitting, not learning. The system doesn't evaluate outcomes or adjust strategy.
BPA-ML's Approach: True Reinforcement Learning
BPA-ML implements multi-armed bandit algorithms - a proven reinforcement learning technique used in clinical trials, A/B testing, and recommendation systems. This is fundamentally different:
Exploration vs Exploitation: The system actively balances trying new configurations (exploration) against using proven winners (exploitation). KNN and clustering don't do this - they simply process current data against historical patterns.
Reward-Based Learning: Every configuration is scored based on actual forward returns, normalized by volatility and clipped to prevent outlier dominance. The system receives a bonus when signals prove profitable. This creates a feedback loop where the indicator literally learns what works for your specific instrument and timeframe.
Four Proven Algorithms: UCB1 (Upper Confidence Bound), Thompson Sampling (Bayesian), Epsilon-Greedy, and Gradient-based learning. Each has different exploration characteristics backed by peer-reviewed research. You're not getting marketing buzzwords - you're getting battle-tested algorithms from academic computer science.
Continuous Adaptation: The learning never stops. As market microstructure evolves, the bandit discovers new optimal configurations. Other "adaptive" indicators recalculate but don't improve - they use the same logic on new data. BPA-ML fundamentally changes which logic it uses based on what's working.
The Configuration Grid: 40 Arms vs Fixed Settings
Traditional divergence indicators use a single oscillator with fixed parameters - typically RSI with length 14. More advanced systems might let you choose between RSI, Stochastic, or CCI, but you're still picking one manually.
BPA-ML maintains a grid of 40 candidate configurations:
- 5 oscillator families (RSI, Stochastic, CCI, MFI, Williams %R)
- 4 length parameters (short, medium, medium-long, long)
- 2 smoothing settings (fast, slow)
The bandit evaluates all 40 continuously and automatically selects the optimal one. When market microstructure changes - say, from trending crypto to ranging forex - the system discovers this and switches configurations without your intervention.
Why This Matters: Markets exhibit different characteristics. Bitcoin on 5-minute charts might favor fast Stochastic (high sensitivity to quick moves), while EUR/USD on 4-hour charts might favor smoothed RSI (filtering noise in steady trends). Manual optimization is guesswork. The bandit discovers these nuances mathematically.
Cognitive Analytical Engine: Beyond Simple Filters
Many divergence indicators include basic filters - perhaps checking if RSI is overbought/oversold or if volume increased. These are single-metric gates that treat all market states the same.
BPA-ML's CAE synthesizes five intelligence layers into a comprehensive market-state assessment:
Trend Conviction Score (TCS): Combines ADX normalization, multi-timeframe EMA alignment, and structural persistence. This isn't just "is ADX above 25?" - it's a weighted composite that captures trending vs ranging regimes with nuance. The threshold itself is adaptive via mini-bandit if enabled.
Directional Momentum Alignment (DMA): ATR-normalized EMA spread creates a regime-aware momentum indicator. The same price move reads differently in high vs low volatility environments. Most indicators ignore this context.
Exhaustion Modeling: Aggregates volume spikes, pin bar formations, extended runs without pullback, and extreme oscillator readings into a unified probability of climax. This multi-factor approach catches exhaustion signals that single metrics miss. High exhaustion can override trend filters - allowing reversal trades at genuine turning points that basic filters would block.
Adversarial Validation: Before approving a bullish signal, the engine quantifies both the bull case AND the bear case. If the opposing case dominates by a threshold, the signal is blocked. This is game-theory applied to trading - most indicators don't check if you're fighting obvious strength in the opposite direction.
Confidence Scoring: Every signal receives a 0-1 quality score blending all CAE components plus divergence strength. You can size positions by confidence - a concept absent in most divergence indicators that treat all signals identically.
Adaptive Parameters: Mini-Bandits
Even the filtering thresholds themselves learn. Most indicators have you set pivot lookback periods, minimum divergence strength, and trend filter strictness manually. These are instrument-specific - what works for one asset fails on another.
BPA-ML's mini-bandits optimize:
- Pivot lookback strictness (balance between catching small structures vs requiring major swings)
- Minimum slope change threshold (filter weak divergences vs allow early entries)
- TCS threshold for trend filtering (how strict counter-trend blocking should be)
These learn the same way the oscillator bandit does - via reward scoring and outcome evaluation. The entire system personalizes to your trading context.
Visual Intelligence: Five Presentation Modes
Most indicators offer basic customization - perhaps choosing colors or line thickness. BPA-ML includes five distinct visual modes, each designed for specific use cases:
Quantum Mode: Renders signals as probability clouds where opacity encodes confidence. High-confidence signals are bold and opaque; low-confidence signals are faint and translucent. This visually guides position sizing in a way that static markers cannot. No other divergence indicator I've found uses confidence-based visual encoding.
Holographic Mode: Multi-layer gradient bands create depth perception showing signal quality zones. Excellent for teaching and presentations.
Cyberpunk Mode: Neon centerlines with particle glow trails. High-contrast for immersive dark-theme trading.
Standard Mode: Professional dashed lines and zones. Clean, presentation-ready.
Minimal Mode: Maximum performance for backtesting and low-powered devices.
The visual system isn't cosmetic - it's part of the decision support infrastructure.
Dashboard: Real-Time Intelligence
Many indicators include dashboards showing current indicator values or basic statistics. BPA-ML's dashboard is a comprehensive control center:
Oscillator Section: Shows which configuration is currently selected, why it's selected (pull statistics, reward scores), and learning progression (warmup, learning, active).
CAE Section: Real-time TCS, DMA, Exhaustion, Adversarial cases, and Confidence scores with visual indicators (emoji-coded states, bar graphs, trend arrows).
Bandit Performance: Algorithm selection, mode (Switch vs Blend), arm distribution, differentiation metrics, learning diagnostics.
State Metrics Grid (Large mode): Normalized readings for trend alignment, momentum, volatility, volume flow, Bollinger position, ROC, directional movement, oscillator bias - all synthesized into a composite market state.
This level of transparency is rare. Most "black box" indicators hide their decision logic. BPA-ML shows you exactly why it's making decisions in real-time, enabling informed discretionary overrides.
Repainting: Complete Transparency
Many divergence indicators don't clearly disclose repainting behavior. BPA-ML offers three explicit timing modes:
Realtime: Shows developing signals on current bar. Repaints by design - this is a preview mode for learning, not for trading.
Confirmed: Signals lock at bar close. Zero repainting. Recommended for live trading.
Pivot Validated: Waits for full pivot confirmation (5+ bar delay). Highest purity, zero repainting, ideal for backtesting divergence quality.
You choose the mode based on your priority - speed vs certainty. The transparency empowers rather than obscures.
Educational Value: Learning Platform
Most indicators are tools - you use them, but you don't learn from them. BPA-ML is designed as a learning platform:
Advisory Mode: Signals always appear, but blocked signals receive warning annotations explaining why CAE would have filtered them. You see the decision logic in action without missing learning opportunities.
Dashboard Transparency: Real-time display of all metrics shows exactly how market state influences decisions.
Comprehensive Documentation: In-indicator tooltips, extensive publishing statement, and user guides explain not just what to click, but why the algorithms work and how to apply them strategically.
Algorithm Comparisons: By trying different bandit algorithms (UCB1 vs Thompson vs Epsilon vs Gradient), you learn the differences between exploration strategies - knowledge applicable beyond trading.
This isn't just a signal generator - it's an educational tool that teaches machine learning concepts, market intelligence interpretation, and systematic decision-making.
What This System Is NOT
To be completely transparent about positioning:
Not a Prediction System: BPA-ML doesn't predict future prices. It identifies structural divergences, assesses current market state, and learns which oscillator configurations historically correlated with better forward returns. The learning is retrospective optimization, not fortune telling.
Not Fully Automated: This is a decision support tool, not a push-button profit machine. You still need to execute trades, manage risk, and apply discretionary judgment. The confidence scores guide position sizing, but you determine final risk allocation.
Not Beginner-Friendly: The sophistication comes with complexity. This system requires understanding of divergence trading, basic machine learning concepts, and market state interpretation. It's designed for intermediate to advanced traders willing to invest time in learning the system.
Not Magic: Even with optimal configurations and intelligent filtering, markets are probabilistic. Losing trades are inevitable. The system improves your probability distribution - it doesn't eliminate risk or guarantee profits.
The Fundamental Difference
Here's the core distinction:
Traditional Divergence Indicators: Detect patterns and hope they work.
"ML" Indicators (KNN/Clustering): Detect patterns and compare to historical similarities.
BPA-ML: Detects patterns, evaluates outcomes, learns which detection methods work best for this specific context, understands market state before suggesting trades, and continuously improves without manual intervention.
The difference isn't incremental - it's architectural. This is trading system infrastructure with embedded intelligence, not just a pattern detector with filters.
Who This Is For
BPA-ML is ideal for traders who:
- Value systematic approaches over discretionary guessing
- Appreciate transparency in decision logic
- Are willing to let systems learn over 200+ bars before judging performance
- Trade liquid instruments on 5-minute to daily timeframes
- Want to learn machine learning concepts through practical application
- Seek professional-grade tools without institutional price tags
It's not ideal for:
- Absolute beginners needing simple plug-and-play systems
- 1-minute scalpers (noise dominates at very low timeframes)
- Traders of illiquid instruments (insufficient data for learning)
- Those seeking magic solutions without understanding methodology
- Impatient optimizers wanting instant perfection
What Makes This Original
The innovation in BPA-ML lies in three interconnected breakthroughs that work synergistically:
1. Multi-Armed Bandit Oscillator Selection
Traditional divergence indicators require manual optimization - you choose RSI with a length of 14, or Stochastic with specific settings, and hope they work. BPA-ML eliminates this guesswork through machine learning. The system maintains a grid of 40 candidate oscillator configurations spanning five oscillator families (RSI, Stochastic, CCI, MFI, Williams %R), four length parameters, and two smoothing settings. Using proven bandit algorithms (UCB1, Thompson Sampling, Epsilon-Greedy, or Gradient-based learning), the system continuously evaluates which configuration produces the best forward returns and automatically switches to the winning arm. This isn't random testing - it's intelligent exploration with exploitation, balancing the discovery of new opportunities against leveraging proven configurations.
2. Cognitive Analytical Engine (CAE)
Divergences occur constantly, but most fail. The CAE solves this by computing a comprehensive market intelligence layer:
Trend Conviction Score (TCS): Synthesizes ADX normalization, multi-timeframe EMA alignment, and structural persistence into a single 0-1 metric that quantifies how strongly the market is trending. When TCS exceeds your threshold, the system knows to avoid counter-trend trades unless other factors override.
Directional Momentum Alignment (DMA): Measures the spread between fast and slow EMAs, normalized by ATR. This creates a regime-aware momentum indicator that adjusts its interpretation based on current volatility.
Exhaustion Modeling: Aggregates volume spikes, pin bar formations, extended runs above/below EMAs, and extreme RSI readings into a probability that the current move is reaching climax. High exhaustion can override trend filters, allowing reversal trades at genuine turning points.
Adversarial Validation: Before approving a bullish signal, the engine quantifies both the bull case (proximity to support EMAs, oversold conditions, volume confirmation) and the bear case (distance to resistance, overbought conditions). If the opposing case dominates by your threshold, the signal is blocked or flagged with a warning.
Confidence Scoring: Every signal receives a 0-1 confidence score blending TCS, momentum magnitude, pullback quality, market state metrics, divergence strength, and adversarial advantage. You can gate signals on minimum confidence, ensuring only high-probability setups reach your attention.
3. Adaptive Parameter Mini-Bandits
Beyond the oscillator itself, BPA-ML uses additional bandit systems to optimize:
- Pivot lookback strictness
- Minimum slope change threshold
- TCS threshold for trend filtering
These parameters are often instrument-specific. The adaptive bandits learn these nuances automatically.
Why These Components Work Together
Each layer serves a specific purpose in the signal generation hierarchy:
Layer 1 - Oscillator Selection: The bandit ensures you're always using the oscillator configuration best suited to current market microstructure.
Layer 2 - Divergence Detection: With the optimal oscillator selected, the engine scans for structural divergences using confirmed pivots.
Layer 3 - CAE Filtering: Raw divergences are validated against market intelligence.
Layer 4 - Spacing & Timing: Quality signals need proper spacing to avoid over-trading.
This isn't a random collection of indicators. It's a decision pipeline where each stage refines signal quality, and the machine learning ensures the entire system stays calibrated to your specific trading context.
Core Components - Deep Dive
Divergence Engine
The foundation is a dual-mode divergence detector:
Regular Divergence: Price makes a higher high while oscillator makes a lower high (bearish), or price makes a lower low while oscillator makes a higher low (bullish). These signal potential reversals.
Hidden Divergence: Price makes a lower high while oscillator makes a higher high (bullish continuation), or price makes a higher low while oscillator makes a lower low (bearish continuation). These signal trend strength.
Pivots are confirmed using symmetric lookback periods. Divergence strength is quantified via slope separation between price and oscillator.
Signal Timing Modes
Realtime (live preview): Shows potential signals on current bar. Repaints by design. Use for learning only.
Confirmed (1-bar delay): Signals lock at bar close. No repainting. Recommended for live trading.
Pivot Validated: Waits for full pivot confirmation (5+ bar delay). Highest purity, best for backtesting.
Multi-Armed Bandit Algorithms
UCB1: Optimism under uncertainty. Excellent balance for most use cases.
Thompson Sampling: Bayesian approach with smooth exploration. Great for long-term adaptation.
Epsilon-Greedy: Simple exploitation with random exploration. Easy to understand.
Gradient-based: Lightweight weight adjustment based on rewards. Fast and efficient.
Bandit Operating Modes
Switch Mode: Uses top-ranked arm directly. Maximum amplitude, crisp signals.
Blend Mode: Softmax mixture with dominant-arm preservation. Ensemble stability while maintaining amplitude for overbought/oversold crossings.
How to Use This Indicator
Initial Setup
1. Apply BPA-ML to your chart
2. Select visual mode (Minimal/Standard/Holographic/Cyberpunk/Quantum)
3. Choose signal timing - "Confirmed (1-bar delay)" for live trading
4. Set Oscillator Type to "Auto (ML)" and enable it
5. Select bandit algorithm - UCB1 recommended
6. Choose Blend mode with temperature 0.4-0.5
CAE Configuration
Start with "Advisory" mode to learn the system. Signals appear with warnings if CAE would have blocked them.
Switch to "Filtering" mode when comfortable - CAE actively blocks low-quality signals.
Enable the three primary filters:
- Strong Trend Filter
- Adversarial Validation
- Confidence Gating
Parameter Guidance by Trading Style
Scalping (1-5 minute charts):
- Algorithm: Thompson or UCB1
- Mode: Blend (temp 0.3-0.4)
- Horizon: 8-12 bars
- Min Confidence: 0.30-0.40
- TCS Threshold: 0.70-0.80
- Spacing: 8-12 any, 16-24 same-side
Day Trading (15min-1H charts):
- Algorithm: UCB1
- Mode: Blend (temp 0.4-0.6)
- Horizon: 12-24 bars
- Min Confidence: 0.35-0.45
- TCS Threshold: 0.80-0.85
- Spacing: 12-20 any, 20-30 same-side
Swing Trading (4H-Daily charts):
- Algorithm: UCB1 or Thompson
- Mode: Blend (temp 0.6-1.0) or Switch
- Horizon: 20-40 bars
- Min Confidence: 0.40-0.55
- TCS Threshold: 0.85-0.95
- Spacing: 20-40 any, 30-60 same-side
Signal Interpretation
Bullish Signals: Green markers below price. Enter long when detected.
Bearish Signals: Red markers above price. Enter short when detected.
Blocked Signals: Orange X markers show filtered signals (Advisory mode).
Confidence Rings: Single ring at 50%+ confidence, double at 70%+. Use for position sizing.
Dashboard Metrics
Oscillator Section: Shows active type, value, state, and parameters.
Cognitive Engine:
- TCS: 0.80+ indicates strong trend
- DMA: Momentum direction and strength
- Exhaustion: 0.75+ warns of reversal
- Bull/Bear Case: Adversarial scoring
- Differential: Net directional advantage
Bandit Performance: Shows algorithm, mode, selected configuration, and learning diagnostics.
Visual Zones
- Bullish Zone: Blue/cyan tint - favorable for longs
- Bearish Zone: Red/magenta tint - favorable for shorts
- Exhaustion Zone: Yellow warning - reduce sizing
Visual Mode Selection
Minimal: Clean triangles, maximum performance
Standard: Dashed lines with zones, professional presentation
Holographic: Gradient bands, excellent for teaching
Cyberpunk: Neon glow trails, high contrast
Quantum: Probability cloud with confidence-based opacity
Calculation Methodology
Oscillator Computation
For each bandit arm: calculate base oscillator, apply smoothing, normalize to 0-100.
Switch mode: use top arm directly.
Blend mode: softmax mixture blended with dominant arm (70/30) to preserve amplitude.
Divergence Detection
1. Identify price and oscillator pivots using symmetric periods
2. Store recent pivots with bar indices
3. Scan for slope disagreements within lookback range
4. Require minimum slope separation
5. Classify as regular or hidden divergence
6. Compute strength score
CAE Metrics
TCS: 0.35×ADX + 0.35×structural + 0.30×alignment
DMA: (EMA21 - EMA55) / ATR14
Exhaustion: Aggregates volume, divergence, RSI extremes, pins, extended runs
Confidence: 0.30×TCS + 0.25×|DMA| + 0.20×pullback + 0.15×state + 0.10×divergence + adversarial
Bandit Rewards
Every horizon period: compute log return normalized by ATR, clip to ±0.5, bonus if signal was positive. Update arm statistics per algorithm.
Ideal Market Conditions
Best Performance:
- Liquid instruments with clear structure
- Trending markets with consolidations
- 5-minute to daily timeframes
- Consistent volume and participation
Learning Requirements:
- Minimum 200 bars for warmup
- Ideally 500-1000 bars for full confidence
- Performance improves as bandit accumulates data
Challenging Conditions:
- Extremely low liquidity
- Very low timeframes (1-minute or below)
- Extended sideways consolidation
- Fundamentally-driven gap markets
Dashboard Interpretation Guide
TCS:
- 0.00-0.50: Weak trend, reversals viable
- 0.50-0.75: Moderate trend, mixed approach
- 0.75-0.85: Strong trend, favor continuation
- 0.85-1.00: Very strong trend, counter-trend high risk
DMA:
- -2.0 to -1.0: Strong bearish
- -0.5 to 0.5: Neutral
- 1.0 to 2.0: Strong bullish
Exhaustion:
- 0.00-0.50: Fresh move
- 0.50-0.75: Mature, watch for reversals
- 0.75-0.85: High exhaustion
- 0.85-1.00: Critical, reversal imminent
Confidence:
- 0.00-0.30: Low quality
- 0.30-0.50: Moderate quality
- 0.50-0.70: High quality
- 0.70-1.00: Premium quality
Common Questions
Why no signals?
- Blend mode: lower temperature to 0.3-0.5
- Loosen OB/OS to 65/35
- Lower min confidence to 0.35
- Reduce spacing requirements
- Use Confirmed instead of Pivot Validated
Why frequent oscillator switching?
- Normal during warmup (first 200+ bars)
- After warmup: may indicate regime shifting market
- Lower temperature in Blend mode
- Reduce learning rate or epsilon
Blend vs Switch?
Use Switch for backtesting and maximum exploitation.
Use Blend for live trading with temperature 0.3-0.5 for stability.
Recalibration frequency?
Never needed. System continuously adapts via bandit learning and weight decay.
Risk Management Integration
Position Sizing:
- 0.30-0.50 confidence: 0.5-1.0% risk
- 0.50-0.70 confidence: 1.0-1.5% risk
- 0.70+ confidence: 1.5-2.0% risk (maximum)
Stop Placement:
- Reversals: beyond divergence pivot plus 1.0-1.5×ATR
- Continuations: beyond recent swing opposite direction
Targets:
- Primary: 2-3×ATR from entry
- Scale at interim levels
- Trail after 1.5×ATR in profit
Important Disclaimers
BPA-ML is an advanced technical analysis tool for identifying high-probability divergence patterns and assessing market state. It is not a complete trading system. Machine learning components adapt to historical patterns, which does not guarantee future performance. Proper risk management, position sizing, and additional confirmation methods are essential. No indicator eliminates losing trades.
Backtesting results may differ from live performance due to execution factors and dynamic bandit learning. Always validate on demo before committing real capital. CAE filtering reduces but does not eliminate false signals. Market conditions change rapidly. Use appropriate stops and never risk excessive capital on any single trade.
— Dskyz, Trade with insight. Trade with anticipation.

Simple CPR for intraday index tradingSimple CPR is an indicator that displays the Central Pivot Range (CPR) and Support-Resistance pivots. It offers granular customization across CPR, Floor pivots, Developing CPR, and Session High/Low levels.
Original concept from Larry Williams, Mark Fisher & Frank Ochoa
Modified from " CPR (Central Pivot Range)" script by ajithcpas
What is CPR (Central Pivot Range)?
The Central Pivot Range (CPR) is calculated from the previous period’s High (H), Low (L), and Close (C). It forms three levels:
• Pivot (P) = (H + L + C) / 3
• Top Central (TC) = ( P - BC) + P
• Bottom Central (BC) = ( H + L)/2
Together, these levels form a central zone representing the market’s “value area.” Price trading above the CPR typically indicates bullish sentiment, while trading below the CPR reflects bearish bias. A narrow CPR often precedes strong trending moves, whereas a wider CPR signals potential consolidation.
How Pivot Levels are Calculated
Beyond CPR, the indicator supports multiple pivot calculation models, including Traditional, Classic, Fibonacci, and Camarilla
For example, in the traditional model:
• R1 = ( 2 × P ) − L
• S1 = ( 2 × P ) − H
• Higher levels (R2, R3…) scale proportionally by the prior range (H-L).
These levels serve as dynamic intraday support-resistance zones and breakout targets.
Key Features
⦿ Multi-Formula CPR : Select Traditional, Classic, Fibonacci, or Camarilla pivots.
⦿ Multi-Timeframe Control : Auto-detect or manually set CPR timeframe (Daily → Yearly).
⦿ Complete Pivot Suite : Extending to five resistance and five support levels (R1–R5, S1–S5) with optional midpoints (R0.5, R1.5, R2.5, R3.5, R4.5, S0.5, S1.5, S2.5, S3.5, S4.5).All levels can be individually toggled on or off, giving traders complete control over the level of chart detail they prefer.
⦿ Full Customization : Independently toggle lines, fills, price labels, and level names.
⦿ Developing CPR & S/R : Real-time projection of next-session CPR, R1, and S1 with separate visibility controls.
⦿ Session High/Low Tracking : Plot Previous-Session High (PH) & Low (PL) with optional labels and prices.
⦿ Look-Back Flexibility : Display any number of historical CPR/pivot periods.
⦿ Styling Precision : Choose line width, style (solid, dashed, dotted), and individual colors.
⦿ Optional Fills : Visualize the CPR zone or CPR–R1/S1 bands with semi-transparent shading.
⦿ Optimized Performance : Efficient array-based drawing for smooth chart performance even with a long history.
Use Case
CPR analysis helps identify trend bias, volatility contraction/expansion, and key support-resistance zones. This indicator is ideal for intraday indices traders who need a structured yet customizable price-action framework.
Disclaimer
This script is for educational and technical analysis purposes only. It does not constitute financial advice or a recommendation. Always perform independent analysis and manage risk appropriately before placing trades.
