Cari skrip untuk "pivot"

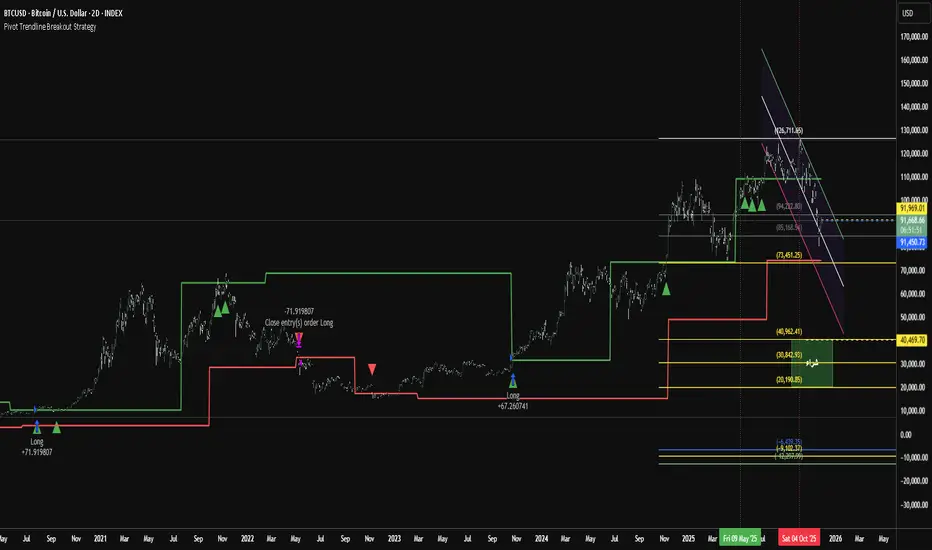
Pivot Trendline Breakout StrategyHow it works:
Long entry: triggered immediately when price closes above the green upper pivot trendline.
Exit (go flat): triggered immediately when price closes below the red lower pivot trendline.
Uses 100% of equity per trade (you can change default_qty_value if you prefer fixed size or risk %).
Works on any timeframe.
PIVOT BACKGROUND AND TABLE BY PRANOJIT DEYThis shows pivot trend in relation with the day open line. it makes the day bias easily understandable.

Weekly Fibonacci Pivot Signals (4H) - S1/R1 & S3/R3 rulesThis Indicator used weekly price range to calculate the pivot R1,R3,S1 and S3 ,when price crossed and closed below R3 in 4H timeframe the indicator gives sell signal, when the price crossed and close above the S3 the indicator gives buy signal. This indicator can give approximately 50% win Rate .

Daily Pivot Points LEVELS S-RThis indicator plots daily pivot points based on the previous day’s high, low, and close. It displays the main pivot line, as well as the first levels of support (S1) and resistance (R1), with optional second levels (R2, S2) for additional reference. Ideal for
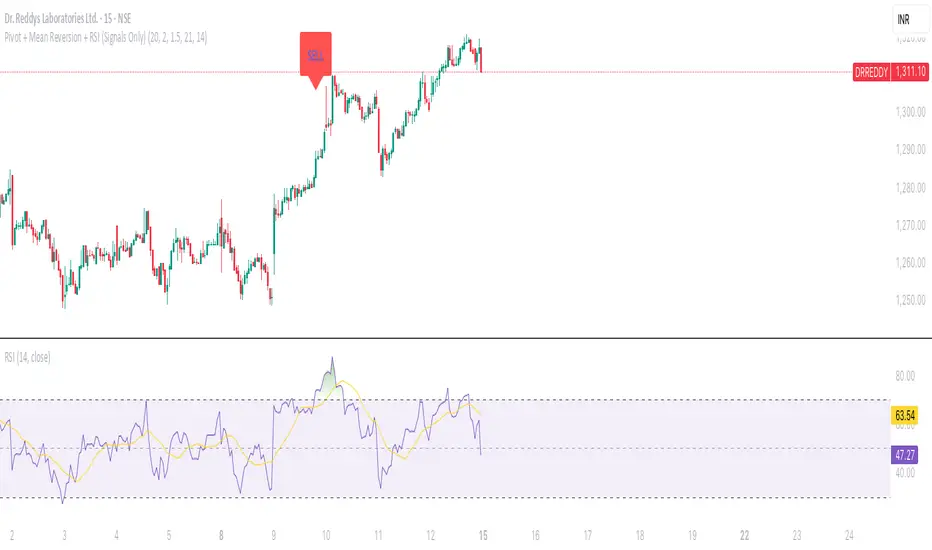
Pivot + Mean Reversion + RSI (Signals Only) by Shashwat KhuranaShow BUY labels below bars when a bullish reversal is detected.
Show SELL labels above bars when a bearish reversal is detected.
Uses pivot levels, mean reversion, big candle, RSI, and volume filters.
Pivot Distance Strategy# Multi-Timeframe Pivot Distance Strategy
## Core Innovation & Originality
This strategy revolutionizes moving average crossover trading by applying MA logic to **pivot distance relationships** instead of raw price data. Unlike traditional MA crossovers that react to price changes, this system reacts to **structural momentum changes** in how current price relates to recent significant pivot levels, creating earlier signals with fewer false positives.
## Methodology & Mathematical Foundation
### Pivot Distance Oscillator
The strategy calculates:
- **High Pivot Percentage**: (Current Close / Last Pivot High) × 100
- **Low Pivot Percentage**: (Last Pivot Low / Current Close) × 100
- **Pivot Distance**: High Pivot Percentage - Low Pivot Percentage
This creates a standardized oscillator measuring market structure compression/expansion regardless of asset price or volatility.
### Multi-Timeframe Filter
Higher timeframe analysis provides directional bias:
- **HTF Long** → Allow long entries, force short exits
- **HTF Short** → Allow short entries, force long exits
- **HTF Squeeze** → Block all entries, force all exits
## Signal Generation Methods
### Method 1: Dual MA Crossover (Primary/Default)
**Fast MA (14 EMA)** and **Slow MA (50 SMA)** applied to pivot distance values:
- **Long Signal**: Fast MA crosses above Slow MA (accelerating bullish pivot momentum)
- **Short Signal**: Fast MA crosses below Slow MA (accelerating bearish pivot momentum)
**Key Advantage**:
- Traditional: Fast MA(price) crosses Slow MA(price) - reacts to price changes
- This Strategy: Fast MA(pivot distance) crosses Slow MA(pivot distance) - reacts to structural changes
- Result: Earlier signals, better trend identification, fewer ranging market whipsaws
### Method 2: MA Cross Zero
- **Long**: Pivot Distance MA crosses above zero
- **Short**: Pivot Distance MA crosses below zero
### Method 3: Pivot Distance Breakout (Squeeze-Based)
Uses dynamic threshold envelopes to detect compression/expansion cycles:
- **Long**: Distance breaks above dynamic breakout threshold after squeeze
- **Short**: Distance breaks below negative breakout threshold after squeeze
**Note**: Only the Breakout method uses threshold envelopes; MA Cross modes operate without them for cleaner signals.
## Risk Management Integration
- **ATR-Based Stops**: Entry ± (ATR × Multiplier) for stops/targets
- **Trailing Stops**: Dynamic adjustment based on profit thresholds
- **Cooldown System**: Prevents overtrading after stop-loss exits
## How to Use
### Setup (Default: MA Cross MA)
1. **Strategy Logic**: "MA Cross MA" for structural momentum signals
2. **MA Settings**: 14 EMA (fast) / 50 SMA (slow) - both adjustable
3. **Multi-Timeframe**: Enable HTF for trend alignment
4. **Risk Management**: ATR stop loss, ATR take profit
### Signal Interpretation
- **Blue/Purple lines**: Fast/Slow MAs of pivot distance
- **Green/Red histogram**: Positive/negative pivot distance
- **Triangle markers**: MA crossover entry signals
- **HTF display**: Shows higher timeframe bias (top-left)
### Trade Management
- **Entry**: Clean MA crossover with HTF alignment
- **Exit**: Opposite crossover, HTF change, or risk management triggers
## Unique Advantages
1. **Structural vs Price Momentum**: Captures market structure changes rather than just price movement, naturally filtering noise
2. **Multi-Modal Flexibility**: Three signal methods for different market conditions or strategies
3. **Timeframe Alignment**: HTF filtering improves win rates by preventing counter-trend trades

Daily Pivot Points + R1 S1 R2 S2 with PricesThis indicator automatically plots daily pivot points (PP) along with the first and second resistance (R1, R2) and support (S1, S2) levels on your chart. Each level is clearly labeled with its price, making it easy to identify key areas for potential reversals or breakouts. Perfect for day traders and swing traders looking for reliable intraday support and resistance zones.

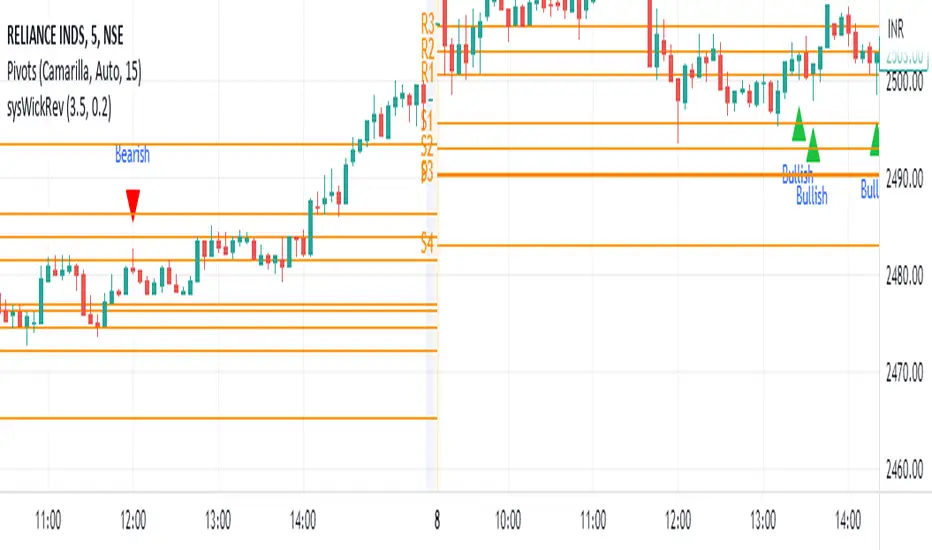
Wick Reversal Indicator - Aligned with "Secrets of a Pivot Boss"The Wick Reversal Indicator is a powerful technical tool developed in accordance with the pseudocode outlined in the book "Secrets of a Pivot Boss" by Franklin O. Ochoa, Jr. This indicator assists traders in identifying potential market reversal points with enhanced precision.
By closely following the principles discussed in the book, the Wick Reversal Indicator evaluates key factors such as candlestick body size, wick length, and the relationship between close and open prices. It provides clear bullish and bearish reversal signals, visualized through triangular markers on the price chart.
Traders can fine-tune the sensitivity of the indicator by adjusting the Wick Multiplier and Body Percentage parameters to match their trading preferences and timeframes. This customization feature ensures adaptability to different market conditions and trading strategies.
With the Wick Reversal Indicator, traders gain an automated and objective tool for identifying potential market reversals, backed by the time-tested methodology presented in "Secrets of a Pivot Boss." It serves as a valuable addition to traders' analysis, aiding in informed decision-making and enhancing trading outcomes.
Pivot Trendlines with Breaks [HG]🧾 Pivot Trendlines and Breaks
A script meant to debut and provide an example usage of the Simple Trendlines library using Pine Script's built-in pivot system.
In under 50 lines of code, with inputs, plots, styling, and alerts included we're able to create trendlines with a breakout system.
▶️ How it works
Calculating pivot points helps traders identify moments at which the market's attitude can shift from bullish to bearish. In the background, the script tracks pivot events for trendlines and uses a system that prevents any leakage between the trendlines before they are drawn.
⚫️ Settings
Pivot Length
Color Adjustments
⚫️ Alerts

Shotoki Pivot Resistance SupportHi,
here is a script I wrote based on Pivot points. It detects HH, HL, LL, LH
the yellow resistances/supports are from a higher timeframe
the fuchsia ones are supports for the current timeframe, it resets when the past Low is too old or it detects a new one
the blue ones are resistances for the current timeframe, it resets when the past High is too old or it detects a new one
Shotoki

Pivot Points (Channel | Fib | Support/Resistances)auto pivot point channel, channel fibonacci and support/resistance lines

CPR with Developing Pivot RangeThis Developing Pivot Range(DPR) made by Saravanan_Ragavan based on Pivot Boss Developing Pivot Range Concept. This indicator will show how the CPR is developing during the day. Also it shows how trend developing. range fills with green and widening in up trend, wise versa range fills with red and widening in down trend.
Pivot Boss described as following about this indicator:
The Developing Pivot Range (DPR) indicator dynamically calculates the central pivot range in real time as new data enters the market bar by bar. Essentially, this indicator allows you to see the “meat of the market” as the day’s trading activity is taking place. More importantly, however, the closing values for the indicator tell you where the central pivot range will be located for the following session, which paves the way for analyzing extremely important two-day pivot range relationships and key width characteristics. Having this information in advance allows us to prepare properly for the
upcoming session.
Note: Today Session end DPR become Tomorrow's CPR.
Hope this Helps you!

TWS Pivot PointsStandard Pivot Points
This Script includes the Mid Pivot Points
R1-R5,
S1 - S5
What is a Pivot Point?
A pivot point is a technical analysis indicator, or calculations, used to determine the overall trend of the market over different time frames. The pivot point itself is simply the average of the high, low and closing prices from the previous trading day. On the subsequent day, trading above the pivot point is thought to indicate ongoing bullish sentiment, while trading below the pivot point indicates bearish sentiment.
The pivot point is the basis for the indicator, but it also includes other support and resistance levels that are projected based on the pivot point calculation. All these levels help traders see where the price could experience support or resistance. Similarly, if the price moves through these levels it lets the trader know the price is trending in that direction.
When the price of an asset is trading above the pivot point , it indicates the day is bullish or positive.
When the price of an asset is trading below the pivot point , it indicates the day is bearish or negative.
The indicator typically includes four additional levels: S1, S2, R1, and R2. These stand for support one and two, and resistance one and two.
Support and resistance one and two may cause reversals, but they may also be used to confirm the trend. For example, if the price is falling and moves below S1, it helps confirm the downtrend and indicate a possible continuation to S2.

AG FX - Pivot PointsPivot Points High Low
Definition
The Pivot Points High Low indicator is used to determine and anticipate potential changes in market price and reversals. The Highs referred to in the title are created based on the number of bars that exhibit lower highs on either side of a Pivot Point High, whereas the Lows are created based on the number of bars that exhibit higher lows on either side of a Pivot Point Low.
Calculations
As mentioned above, Pivot Point Highs are calculated by the number of bars with lower highs on either side of a Pivot Point High calculation. Similarly, Pivot Point Lows are calculated by the number of bars with higher lows on either side of a Pivot Point Low calculation.
Takeaways and what to look for
A Pivot Point is more significant or noteworthy if the trend is extended or longer than average. This can mean if a trader selects a higher period for before and after the Pivot Point, the trend could be longer and therefore prove the Pivot Point itself more notable.
Additionally, Pivot Points can help a trader assess where would be best to draw. By analyzing price changes and reversals, a trader has more of an ability to determine and predict price patterns and general price trends.
Summary
The Pivot Points High Low indicator can predict and determine price changes and potential reversals in the market. Pivot Points can also help traders identify price patterns and trends, depending on the period and significance of the Pivot Point value.

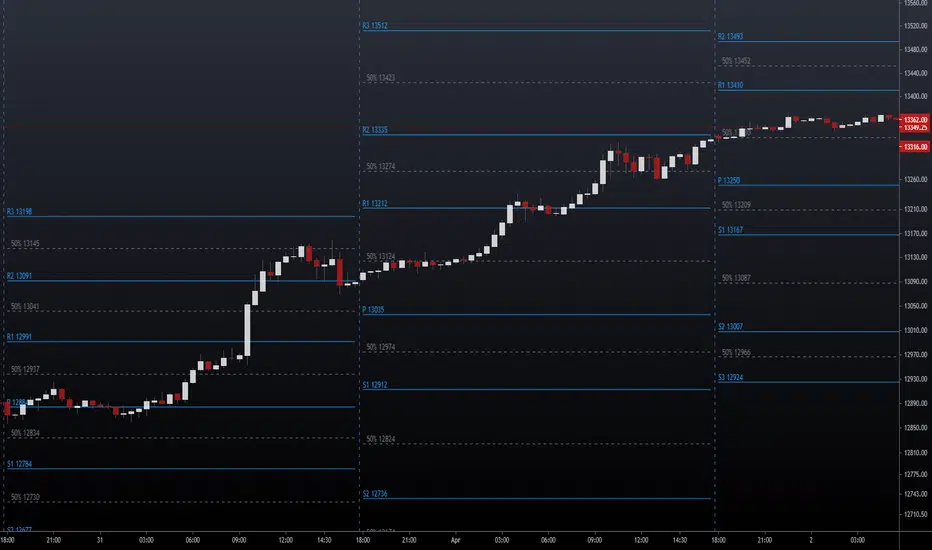
TWP Higher Timeframe Pivot Points█ OVERVIEW
This script displays the nearest support and resistance fibonacci pivot point levels from the higher reference timeframes -- weekly, monthly, and yearly levels. When trading it is always been helpful for me to be aware of significant price levels of the players participating on larger timeframes. HTF pivot points are a great tool for finding confluence and/or gaining extra conviction on your trades. This is a companion tool to be used in conjunction with the Standard Fibonacci Pivot Points .
█ CONCEPTS
Pivot points are a technical indicator / calculation that can be used to determine the overall trend of the market or determine the level that price may face support or resistance. At the same time it can lead to confirmation of the overall trend when price travels through support or resistance lines continuously.
The pivot point is the average of the high, low, and closing price of the previous time window - Day, Week, Month, Year.
The going belief is that if price is trading above the pivot point (P) then there is a bullish sentiment and trading below the pivot point (P) is a bearish sentiment.
Pivot points can be calculated a multitude of ways but the way I am using it here is using the fibonacci method. See the calculations below.
Note: Tooltips are added for each lines label that display the calculation used.
Default Ratios + Matching Labels:
pivot point = (high + low + close) / 3
support lines = pivot - (prevhigh - prevlow) * 0.236
resistance lines = pivot - (prevhigh - prevlow) * 0.236
38.2% - S1/R1
61.8% - S2/R2
100% - S3/R3
Additional (Mid) Ratios + Matching Labels:
23.6% - SA/RA
50% - SB /RB
76.4% - SC / RC
127.2% - S4/R4
141.4% - S5/R5
161.8% - S6/R6
200% - S7/R7
█ FEATURES
1 — Line Extension - Left, Right, Both, None
2 — Pivot Levels for Week, Month, and Year Pivot Points
• Show line
• Show label
• Line color
• Line style
█ HOW TO USE
• As mentioned earlier it best used along with the Standard Fibonacci Pivot Points to find levels of potential confluence where you believe may be key support, resistance, or a potential inflection point in price action.
█ LIMITATIONS
• Depending on the chart and the amount of data it naturally pulls back, the yearly fibonacci pivot point levels may not show
• Pivot points may be found useful for some and not for others
• There is no assurance that price will stop at, reverse, or reach a specific pivot level

NSDT Pivot Points PlusThis script uses the Traditional Pivot Points but includes the price levels and the 50% line between levels. We added the ability to change the line color of the major levels and the minor levels independently, for better clarity. Added alerts - used code from QuantNomad.
Pivot Points description from TradingView default indicator:
Pivot Point analysis is a technique of determining key levels that price may react to. Pivot points tend to function as support or resistance and can be turning points. This technique is commonly used by day traders, though the concepts are valid on various timeframes. There are several methods of identifying the exact points. Common types of pivot points are Traditional, Fibonacci, Woodie, Classic, Camarilla and DM and each type has its own calculation method.
Most use a variation of significant prices such as established highs, lows, opening and closing prices and then apply a calculation to determine these points. They all calculate additional support and resistance levels alongside the pivot points. They can be used to determine when to enter or exit trades or to determine the range of a market. Conservative traders look for additional confirmation before entering a trade. Whether pivot points are used alone or in combination with other techniques, they are a useful tool in a technical trader's toolbox.
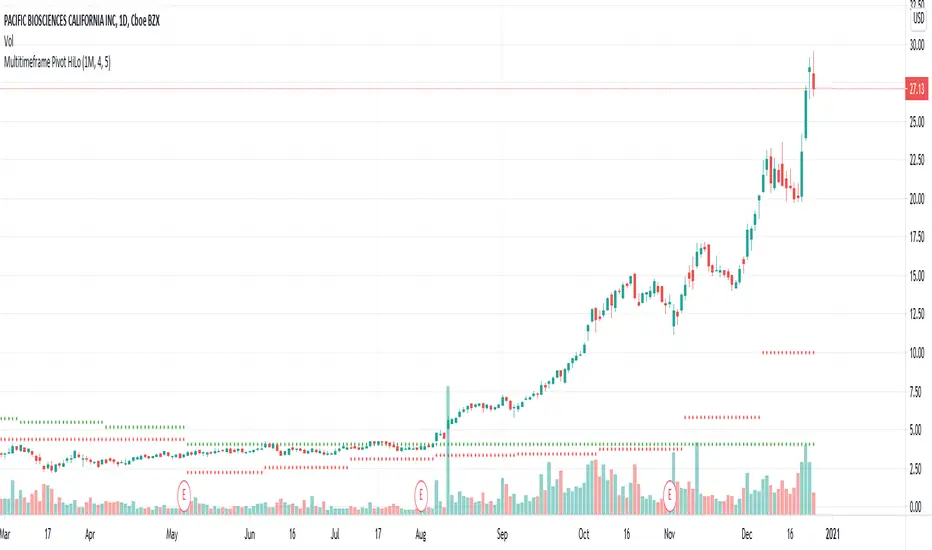
Multitimeframe Pivot HiLoPivot High/Low for multi timeframes.
Could be great entry filter to include multi time frame pivots in trend trading strategies.
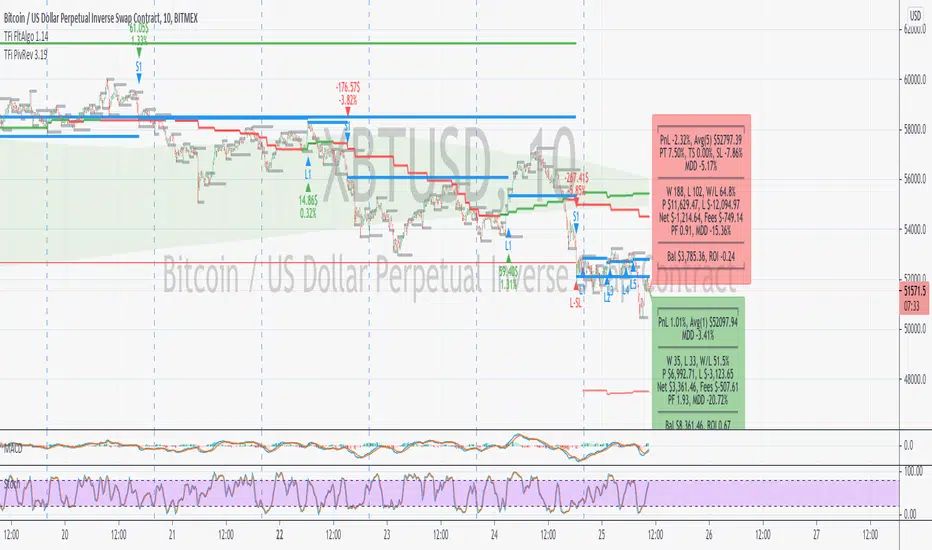
TFi Pivot Reversal V3The Pivot Reversal Study uses pivot points to create a support and resistance level; based on this levels the script creates virtual stop-market orders to catch the trend if the price is crossing the pivot lines.
A "Pyramiding" input allows to configure up to 3 entries; the script enters an additional position if the price falls by a configurable percentage amount (long), the reverse to short orders.
A configurable profit-target and stop-loss is being used to exit an open position.
An optional Moving Average filter can be used to enable only long or short positions.
The script renders a status box at the last bar, which shows the current position status and result of the built-in trading simulation results.
It shows the following statistic values:
current position PnL - also background turns green if position is in profit and red if in loss
the percentage distance to the profit-target and stop-loss level
the overall number of wins and losses and the win/loss ratio
the overall profit and loss amount (assuming a quantity of 1)
the net-profit and profit-ratio
For the correct simulation of entry/exit prices, the script contains inputs for a percentage entry and exit slippage.
The study also creates configurable alerts, which follow the exact position of the entry/exit markers. The default alert messages contain trading instruction to execute orders via Alertatron; but the message content can be replaced if configuring the alert in the Tradingview environment.
The script was mainly backtested with crypto-coins, e.g. XBTUSD at 15min timeframe. But the script also works with any other type of security and timeframe.
How to access
This strategy is a "Invite Only" script. You can can subscribe or purchase the strategy; please use the link below or send me a message via Tradingview to obtain access to the strategy and study script.
For enabling the script in your Tradingview chart window, click on "Indicators" and select "Invite-Only Scripts".
Full list of alerts
'Alertatron Exit' ... Exit all open positions.
'Alertatron Enter Long' ... Enter long position, w/o stop-loss being used.
'Alertatron Enter Short' ... Enter short position, w/o stop-loss being used.
'Alertatron Enter Long SL' ... Enter long position, w/ stop-loss being used.
'Alertatron Enter Short SL' ... Enter short position, w/ stop-loss being used.
Full list of parameters
"Pivot Left Bars" ... Number of bars on the left of the pivot point - used for pivot /peak detection.
"Pivot Right Bars" ... Number of bars on the right of the pivot point - used for pivot /peak detection.
"MA Filter Fast" ... Moving Average filter fast period.
"MA Filter Slow" ... Moving Average filter slow period.
"Profit Target Option" ... Configure the profit-target either as a fix percentage value or an ATR.
"Profit Target " ... Fix percentage profit-target.
"Profit ATR Period" ... ATR profit-target period.
"Profit ATR Factor" ... ATR profit-target factor/multiplier.
"Stop Loss Option" ... Configure the stop-loss either as a fix percentage value or disable the stop-loss completely.
"Stop Loss " ... Fix percentage stop-loss.
"Rebuy Loss " ... Percentage loss of the initial position before script enter a nw position in the same direction.
"Pyramiding" ... Maximum number of positions.
"Show MA Plots" ... Show/hide Moving average plots.
"Slippage Entry " ... Percentage slippage for entering a position.
"Slippage Exit " ... Percentage slippage for exiting a position.
"Statistic Label" ... Defines the position of the statistic label relatively to the last bar in the chart.
"Backtest Start" ... Backtest start time; area outside this timeframe will be grayed out.
"Backtest Stop" ... Backtest stop time; area outside this timeframe will be grayed out.
"Backtest Mode" ... Closes the currently opened position if chart switches to last bar; please only enable if backtesting, otherwise it leads to unwanted alerts.
Pivot STRTGY_V1This Strategy operates on a Daily Time Frame and decisions are made based on monthly Pivot Points.
Choosing different time frames and pivot periods influences trading decisions and is not recommended
The script contains the following calculations:
-Pivot Points,
-Short and long term moving averages (sma, ema, getting),
-Bollinger bands,
-Trend following
The strategy aims to keep the asset profitable for as long as possible by predicting the turning points of the price.
Therefore, it is not suitable for day-trade.
Average holding period of assets is 15-20 days.
The script makes decisions to buy or sell when the price is above or below the determined averages and pivot points.
In this way, it follows the trend and aims for maximum profit.
It continuously makes calculations for the distortion conditions of the trend and generates orders to exit the position when the necessary conditions are met to stop the loss.

ASFX EMAs, ADR, Asian Range, and Pivot PointsThis indicator combines the essential indicators that ASFX traders use, including the EMAs (8, 21, 50, 200, 800), the Average Daily Range, the Asian Range, and the Pivot Points.
The EMAs should be used as dynamic supports and resistances. We could use it to find entries like when there is a bullish engulfing coming off the 21 EMA.
The Average Daily Range tells us the how many pips the pair moves on average. We could use it to measure risk/reward ratios or see it as another resistance.
The Asian Range is displayed as two lines indicating the Asian Session's High and Low. This could help us to determine whether the pair is ready for a breakout. We might avoid setups that are still in the Asian Range as the pair might still be indecisive.
The Pivot Points are also another form of support and resistance which are calculated using the previous day's data. The Pivot Points displayed in this indicator only include the Pivot, R1, R2, R3, S1, S2, S3. (R4, R5, S4, S5 are not included)
All of these indicators should give us a read of the trend. If the EMAs are beautifully fanned out with the 8 EMA on the top and the 800 EMA on the bottom and the price is above the Asian Range and the Pivot, we might keep an eye for a long entry.

Pivot Support & Resistance multi timeframe [LM]Hello guys,
I would like to introduce you pivot support and resistance horizontals. It draws line horizontals on high and low high pivot candles . You can select lines on this timeframe and/or another one.
The colors are dynamic depending whether price is below or above the line:
for the current timeframe green is used for support and blue for resistance
for the other timeframe by default 4h orange is used for support and violet for resistance
There are various sections in setting:
current timeframe pivot setting
show and hide section of the current timeframe
other timeframe pivot setting
show and hide other timeframe horizontals
I'm mainly looking smaller timeframe and trading higher timeframe from level to level
Any suggestions are welcome

Hancock - Pivot RangeShows central pivot point and developing central pivot point and colors both pivot ranges based on pivot criteria without using security function calls.
Green - Indicates up trend
Red - Indicates down trend
Orange - Indicates pivot point territory
Happy trading
Hancock
