CPR with inside candle, Pivot Points and 4EMA The CPR trading strategy is a technical analysis approach that combines multiple indicators to determine potential price levels and trading opportunities. The strategy uses three main components: Inside Candles, Pivot Points, and the 4EMA.
Inside Candles: The Inside Candle pattern is a candlestick pattern where the current candle has a lower high and a higher low than the previous candle. This pattern can indicate a period of consolidation or indecision in the market and can signal a potential reversal or continuation of the trend.
Pivot Points: Pivot Points are technical indicators that use the previous day's price data to calculate key levels of support and resistance for the current trading day. These levels can act as potential areas of buying or selling pressure and can help traders identify potential entry and exit points.
4EMA: The 4EMA is a short-term Exponential Moving Average that tracks the average price of an asset over the previous four periods. This indicator is used to help identify short-term trends in the market and can signal potential buying or selling opportunities.
To apply the CPR strategy, traders first look for Inside Candles on their chart, indicating a period of consolidation or indecision in the market. Next, they identify the Pivot Points for the current trading day, which can act as potential areas of support or resistance. Finally, traders use the 4EMA to confirm the direction of the trend and potential entry or exit points.
For example, if an Inside Candle forms at a Pivot Point level and the 4EMA is indicating an uptrend, this could be a potential buying opportunity. Conversely, if an Inside Candle forms at a Pivot Point level and the 4EMA is indicating a downtrend, this could be a potential selling opportunity.
Cari skrip untuk "pivot"

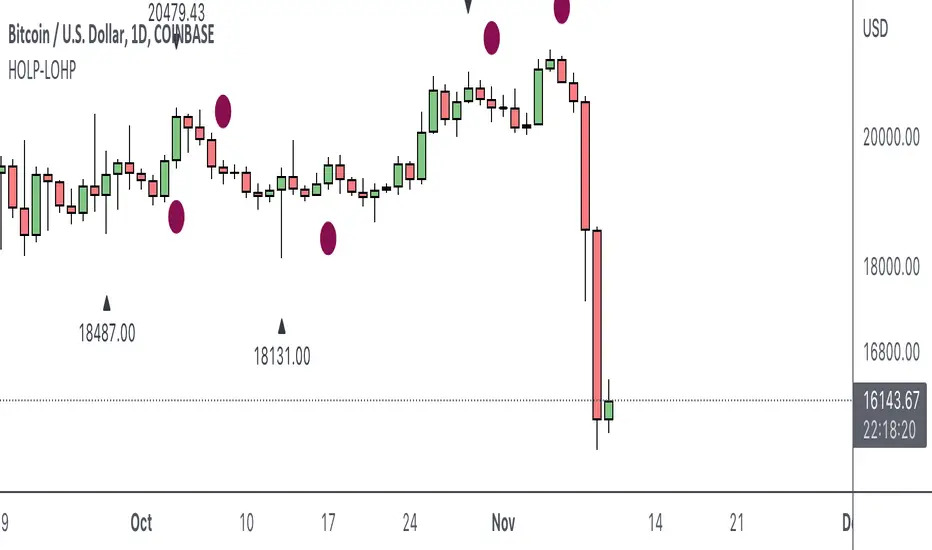
HOLP LOHP PivotCOINBASE:BTCUSD
HOLP and LOHP based on John Carter's Mastering the Trade.
HOLP stands for High Of the Low Period
LOHP stands for Low Of the High Period
This indicator is based on John Carter’s HOLP and LOHP from Mastering the Trade. The basic idea is to identify the session high and mark the low of the session high for a short entry, and vice versa for a long entry.
The default look back period is set to 10 here, albeit John Carter didn’t specify a hard coded number but rather the use of experience and common sense.
Option to turn on labels of the highs and lows of the pivots.
Moving Averages & PivotsOptional MA and Pivots which can be changed as per your needs.
Moreover you can opt to see all and none at all or some.

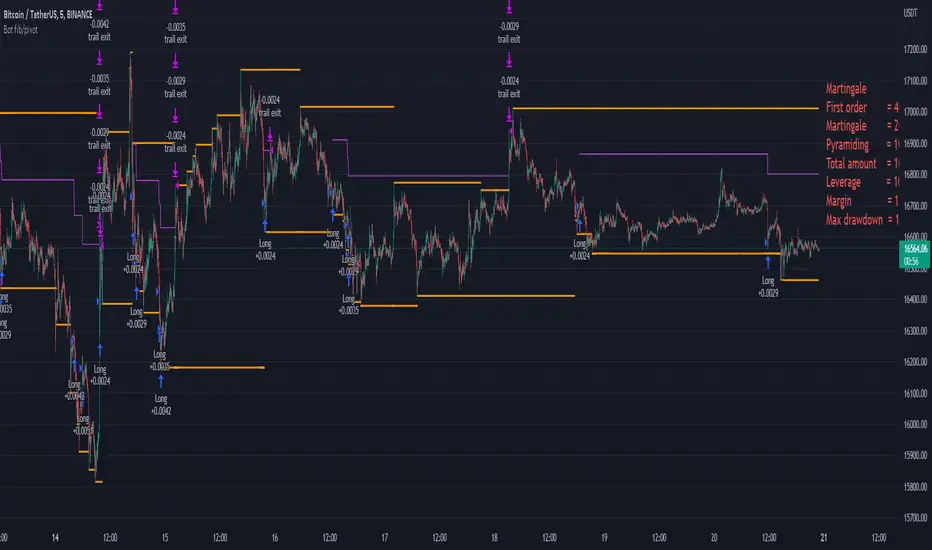
Bot fib/pivot Hello, friends!
This strategy is based on the fibonacci level you choose in the setup and possible pivot points under the control of Williams’ Percent Range.
Williams' Percent Range is a dynamic indicator that detects overbought/oversold conditions.
When the possible reversal points coincide with the fibonacci level, and the high or low points according to Williams also coincide, then an entry occurs.
One of the oldest and most reliable trading tools are widely used support and resistance levels.
In this strategy, we are trying to find these reversal levels based on fibonacci.
//LOGIC ENTRY SETTINGS
Deviation-deviation from the pivot point, the lower this figure, the more entries. The yellow lines on the chart are pivot points.
Fibonacci lvl-fibonacci level, from which the entry will occur, provided that other conditions match
Highest lookback-The setting, which refers to Williams' Percent Range , looks at how many candles ago, was high or low. The smaller the number, the larger, but less accurate inputs.
//AMOUNT(USDT) FIRST ORDER AND > % NEXT
-Martingale first order (the amount of the entrance to the usdt) / next order (Increase of each subsequent order as a percentage)
//EXIT SETTINGS (%, RSI)
-Use RSI for close position? (the position will not be closed if it is in the red, even if the RSI conditions worked)
-Use % for exit? Exit immediately upon reaching the specified percentage
-Use trailing? When the checkbox is checked, the position will be exited by trailing.
Activation trail,after?- When the specified percentage is reached, trailing is activated!
Stop_trail,%- if the last candle falls from the high (after the trailing is activated), the position will be exited.
For example:
We entered the purchase at 100 per asset, activation costs 10, and stop is 2.
the price reached 110, there was an activation, after that it went up to 120, and from the high of the last candle, a 2% drop occurs and the trade is exited.
PS:The default value is 1%, what does this give us? if there is a sharp increase, then we take away all the movement
Use only long?
Allow long?- Only long trades will be displayed
Allow short? Only short trades will be displayed
Allo reverse? Upon receipt of a return signal, the opposite position will be closed.
//MARTINGALE GRID
If there is a check mark in the line "Use martingale and grid?"
then the grid will be active
If there is a check mark in the "Limit each next entry,%?" then, even if the entry from the bot logic is triggered, and the price does not fall by the specified percentage, then there will be no entry!
If there is a check mark in the "Grid,%" column, then purchases with martingale support will be added with a decrease by the specified percentage!
PS: "Grid" always starts anew, as the input from logic triggered!
//FILTER SETTINGS
1) Use filter oscillator? (The filter uses 7 averaged oscillators)
Period-the period for which you will be billing
Upper line-Short entry border.
(if 40, then there will be no entry until it reaches)
Lower line-Long entry border.
(20 until below 20 no entry)
2)Use filter range?
Filter type-moving average selection
Bars back-offset speed based on number of last bars
Period-period to calculate
3)Use filter supertrend?
Supertrend filter with multitimeframe
// How do filters work 2 and 3?
Filters can work either one by one or together.
A trade is entered when conditions from the logic and filters in the red zone are triggered, when there are no entries in the green zone.
//DATA RANGE:
-Testing results for any period of time
//PIRAMIDING
-Also in the settings there is a pyramid of order, keep this in mind. Make a deal for a small part of the deposit, and not for all the money at once!
PS: to use martingale, you need to write in the hook messages:
"amount": "{{strategy.order.contracts}}" (purchases will be in the amount of coins equivalent to USDT)
The default settings for TF are 1 minute, 10 inputs.
You can choose your settings for any TF, but look at different coins to make sure you have good statistics
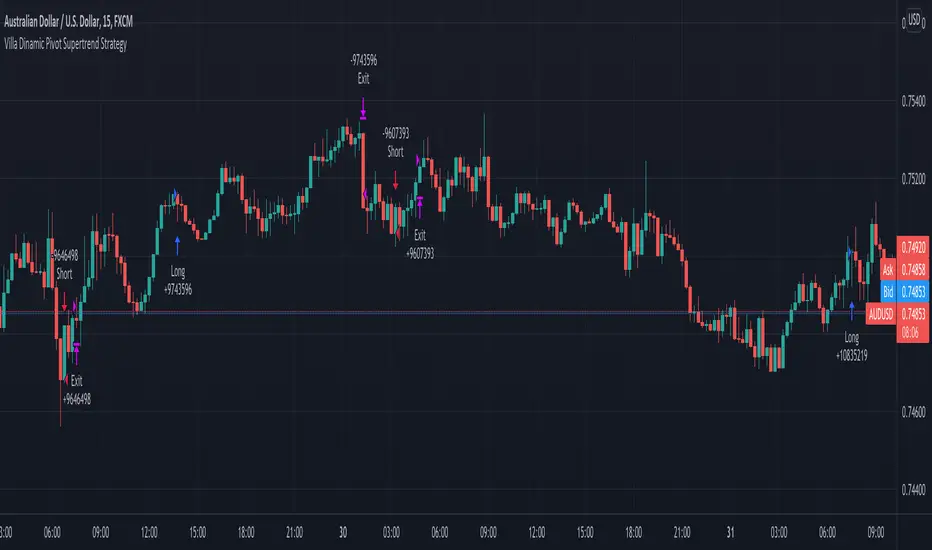
Villa Dinamic Pivot Supertrend StrategyThis strategy works better on AUD/USD in the 15 min timeframe. It uses the Pivot Supertrend to enter trades based on different filters such as:
- Simple EMA filter: that the 3 EMAs should be in order
- DEMA angle: you can choose the DEMA Angle threshold and the look back to check the angle to just trade trades with DEMA at a certain angle
- Simple DEMA filter: just check if close is above or below DEMA
- Take Every Supertrend Signal: this means to take every normal supertrend signal to not just wait for a pivot supertrend signal to enter a trade (specially on long pivot supertrend periods)
- Stop Loss at Supertrend: this means that the stop loss will be at the Normal Supertrend, if false the stop loss will be placed at the ATR level selected.
- 2 Steps Take Profit: this means if you want to close a percentage of position as soon as the normal supertrend crosses the entry price, you can select the % on the "2 Steps TP qty" input
- Stop Loss ATR Multiplier: if Stop Loss at Supertrend is off this will be the stoploss based on the atr
- Take Profit ATR Multiplier: if Stop Loss at Supertrend is off this will be the takeprofit based on the atr (you have to keep in mind that the ratio between this two will make the Risk to reward ratio of the take profit when the Stop Loss at Supertrend)
- Testing: to avoid overfitting, you can select date ranges for backtesting and forwardtesting and select which testing you wanna do
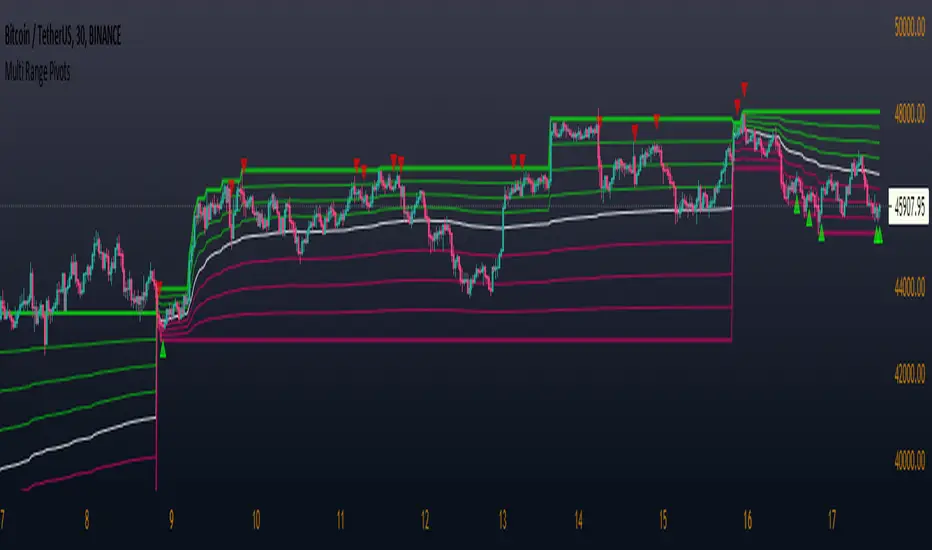
Multi Range Pivots
Multi Range Pivots works by recognizing the high and low of the timeframe selected and plotting range high to MEAN averages and range low to MEAN averages.
This is essentially the VWAP pivots updated to include not only VWAP as a MEAN, but also SMA, EMA, VWMA, DEMA, TEMA, TRIMA, KAMA, MAMA, T3, H/L basis and Donchian basis.
Also, with high and low no longer repainting, I was able to add true reliable signals.
Enjoy
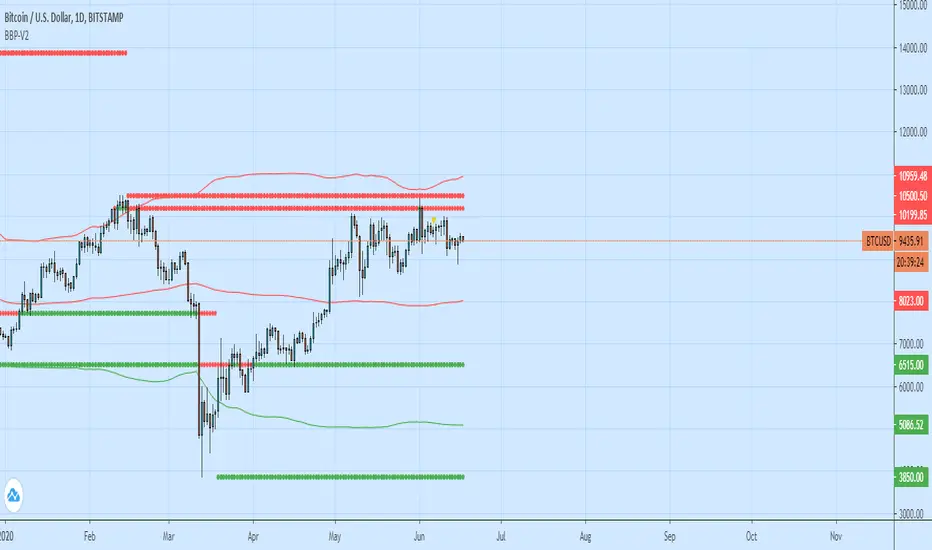
Bollinger Bands + Pivots - V2It drawes a higest or lowest pivot when price intersects with bollinger bands.
[Daveatt] BEST Trade Manager Pivots 1.0Hello BEST traders
The BEST Trade Manager got upgraded with many more features
This version allows setting automatically the TP levels on either Fibonacci/Traditional/Camarilla/Woodie pivots
I. 💎 SCRIPTS ACCESS 💎
1. Available only with one-time payment on my website.
2. My website URL is in this script signature at the very bottom (you'll have to scroll down a bit and going past the long description) and in my profile status available here: Daveatt
3. Many video tutorials explaining clearly how all our indicators work are available on your website > guides section.
4. You may also contact me directly for more information
II. 🔎 What is the BEST Trade Manager?🔎
2.1 Concept
The BEST Trade Manager is compatible with any indicator.
Once connected, it adds another layer of good stuff with real-time user custom defined stop loss (8 available options), take profits (4 possible options) + alerts compatible for trading automation.
2.2 How hard is it to update your indicator?
We'll send to our customers, a comprehensive and easy tutorial, to make any indicator compatible.
I guarantee you, it should take no more than 2 minutes per indicator. We made it easy, fun, and awesome. #bolder #statement
III. The amazing benefits of our Plug&Play system
I hope you're ready to be impressed. Because, what I'm about to introduce, is my best-seller feature - and available across many of my indicators.
The BEST Trade manager can be connected to any external indicator
Let's assume you want to connect your RSI divergence to your Trade Manager.
I mentioned an RSI divergence but you may connect any oscillator ( MACD, On balance volume, stochastic RSI, True Strenght index, and many more..) or non-oscillator (divergence, trendline break, higher highs/lower lows, candlesticks pattern, price action, harmonic patterns, ...) indicators.
THE SKY IS (or more likely your imagination) is the limit :)
We go in-depth on our website why the Plug&Play is an untapped opportunity for many traders out there - URL available on my profile status and signature
IV. 🧰 Features 🧰
Candles can be colored to highlight the trend direction better [/b [
4.1 Stop-Loss Management
For what's following, let's assume that 2 is the stop-loss value you inserted in the indicator, and the Algorithm Builder gives a BUY signal.
This is NOT a recommendation at all, only an example to explain how this feature works.
- %Trailing: The Stop-Loss starts 2% away from the entry price - and will move up (because we're on a BUY trade as per our example) every time your trade will gain 2% profit
- Pips Trailing: Same as above but using a distance in pips/USD value
- Percentage: The Stop-Loss stays static 2% away from the entry price. There is no trailing here
- TP Trailing: Trail your stop-loss every time a Take Profit level is hit
- Supertrend: embedded supertrend use as a trailing stop
- Fixed: Set the Stop-Loss at a fixed position (value should be in currency/units)
- ATR multiple: Set the Stop-loss at a multiple of ATR
- External connector: Let's say your indicator already contains embedded stop-loss levels, you can add them in the Trade Manager
4.2 Take Profits Management
You can manage up to 3 take profit levels defined as a percentage or price value or ATR multiple.
The expected input is in percentage value (for instance, setting the % target of TP1 to 2% will set the TP1 level 2% away from the entry price
This version allows setting automatically the TP levels on either Fibonacci/Traditional/Camarilla/Woodie pivots
4.3 Built-in Risk-to-Reward Panel with real-time analytics
The good stuff doesn't stop here.
You'll notice that this sometimes green (when in a LONG), sometimes red (when in a SHORT) panel at the right of your chart.
- Entry Price: the price when the Algorithm Builder will give a signal.
- The Trade PnL in percentage.
- Entry Stop Loss: Distance (in currency/units) between the selected stop-loss algorithm (percent, trailing, TP trailing, etc.) and the entry price.
- Entry TP1/TP2/TP3: Distance (in currency/units) between the entry price and the first take profit
- Risk/Reward TP1/TP2/TP3: Using the Stop-loss distance at entry, and Take Profit 1/2/3 at the entry to compute the risk-to-reward ratio.
- Max drawdown and Max opportunity (value and percentage): respectively the maximum loss and maximum win per trade
For more details, please check the guides section of my website. Links are in my signature and profile status.
V. 🔔 Alerts 🔔
We enabled the alerts on the:
1. Stop-Loss hit
2. Take Profit 1/2/3 hit
3. custom hard exits based on either MACD / RSI divergence/ MM cross
5.1 🤖 Compatible with trading bots? 🤖
It's compatible with all third-parties out there capturing alerts and forwarding them to the brokers.
We enabled TradingConnector and ProfitView alert templates so far.
If you have any doubts or questions, please hit me up directly or ask in the comments section of this script.
BEST regards,
Dave

Hakimi - Ichi Based Pivot Time Prediction - V.2This indicator is based on multitime ichimoku and can be used to predict some of pivots .
How to use:
1- Select the arbitrary chart (Candles, Heikin Ashi, Line and Renko) and time frame.
2. Set the “Offset” value. Default value is -1.
3. Set the “Time Coefficient 1” to “Time Coefficient 4”. Default values are 2, 3, 4 and 5.

[VIP] Multi Timeframe Pivot Support Resistance (MTPSR)MTPSR provides 6 boards to watch pivots, supports, and resistances in cross timeframes. By default, timeframes are 15m, 30m, 1hr, 2hr, 4hr, and 1D with the current ticker, but they are changeable on indicator setting.
The Pivot, Support, and Resistances have 2 algorithms; Fibonacci or Classic. Default is Classic, but you can change on indicator setting.
MTPSR has 2 additional boards with BitMex Long and Short Liquidation algorithm, this logic can be used for any ticker especially if you want to have tight control with margin liquidation.
MTPSR provides KDJ charts in cross timeframes with the last 3 candles for every board. The default does not appear, but you can enable it on indicator setting. If Greenline crossover Redline, that is a good position to the long or indicating uptrend. But if Greenline crossunder Redline, that is good position to the short or indicating downtrend.
MTPSR has DI/ADX for every board, DI is a difference between DI+ and DI-, if the value is negative means downtrend, if the value is positive means uptrend.
HOW TO USE
Long Trading
The Support will be a good position to entry
The Resistance will be a good position to take profit
If in lower time frames, the candle keeps cross over the resistances, that means uptrend rally is happening.
Short Trading
The Support will be a good position to take profit
The Resistance will be a good position to entry
If in lower time frames, the candle keeps cross over the resistances, that means uptrend rally is happening, it is not good for short
Scalping Advice
If you scalp in day trading, it is recommended to watch Pivot/Support/Resistance on Timeframes 1D, 4D, and 1W
If the chart is sideways on the 1D pivot and the direction from support to pivot, that means the market wants to have a correction to closer support
If the chart is sideways on the 1D pivot and the direction from resistance to pivot, that means the market wants to have retest to closer resistance before another drop or breakout to continue the rally
Use can scalp on TF 15m or TF30m, the Pivot/Support/Resistance in lower timeframes can be so dynamic, so you have to pay more attention on trading strategy, you can use 2H and 4H Pivot/Support/Resistance as the target
You can also use Liquidation Long/Short boards for scalping trading strategy to take profit or cut lost
ALERTS
Every pivot board has alert which condition: if candle cross over or under support, resistance or pivot even KDJ cross over or under
Every liquidation board has alert which condition: if candle cross over or under every margin level
Example alert title for every board when candle cross over: Over Support TF 1, Over Resistance TF 1, Over Pivot TF 1, KDJ Up TF1
Example alert title for every board when candle cross under: Under Support TF 1, Under Resistance TF 1, Under Pivot TF 1, KDJ Down TF1
Feedback
Please drop a comment or send a direct message for any bugs or request new feature
I dont sell source codes, please not DM me about it

Stochastic Delta PivotsBased on stochastics converging and diverging, identifying pivot points to detect early momentum changes.

Pocket Pivot IndicatorFrom Gil Morales and Chris Kacher (O'Neil's disciples). Designed to find buy points in bases and continuation buy points in an uptrend. The volume today must be greater then the maximum down volume of the past 10 trading days. Recommended to use in conjunction with the 10 day and/or 50 day moving average.
Typical use :
Scan for pocket pivots.
Is stock strong fundamentally? i.e- leader in it's sector
Has the stock developed a base ?(see O'Neil's work for base discussion)
Is the stock breaking through or bouncing off the 10 period sma? (can use 50 sma too)
If so.. a possible buy.
Cheers
David

Extended Fibonacci PivotEditable Fibonacci Pivots. 0.236, 0.382, 0.618, 0.786, 1.000. Easy to extend further if needed. Can be used with intervals from 1 minute to 1 Day.
A Few Recommended timeframes:
1 minute chart - 15 Minute Pivot Timeframe
3 minute chart - 1 Hour Timeframe or Daily Timeframe
15 Minutes to < 60 Minutes - Daily Timeframe
1 Hour to 4 Hour - Weekly Timeframe
Daily - Monthly Timeframe
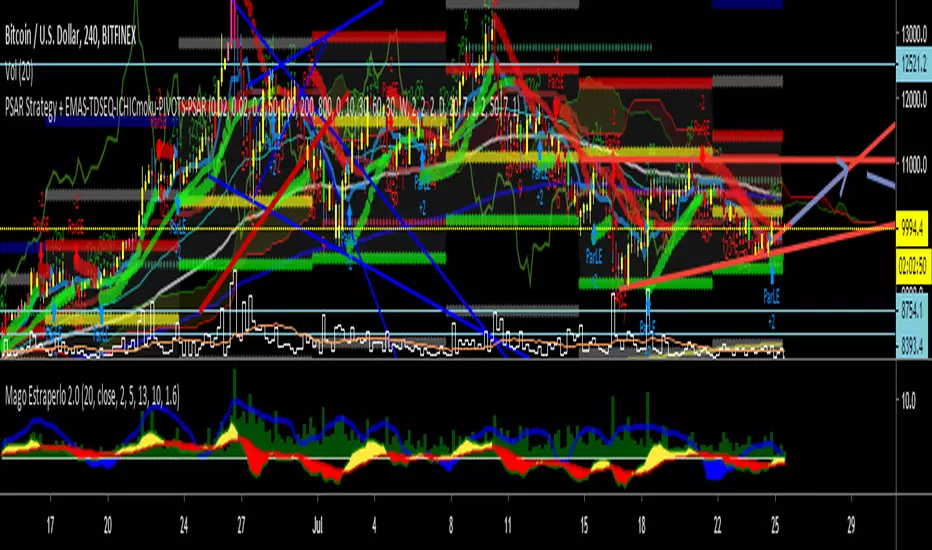
PSAR Strategy + EMAS-TDSEQ-ICHICmoku-PIVOTS-PSARPSAR Strategy + EMAS-TDSEQ-ICHICmoku-PIVOTS-PSAR
In this script you have a good strategy, called Parabollic PSAR and this indicators:
4 EMAS --> 50, 100, 200 and 800
TD Secuential
Ichimoku indicator
Pivots
Parabolic PSAR.
Scalping Grid at Pivot Point FibonacciThis strategy sets a grid of stop orders once price touch one Fibonacci weekly pivots.
This works very well for scalping as the price touch a pivot level.
Take care when you work with grids because drawdown could be very high.
Study with alarms is available at request.
Please use comment section for any feedback.
Next improvement (only to whom is interested to this script and follows me): study with alerts on multiple tickers all at one. Leave a comment if you want to have access to study.
********************************** IMPORTANT*******************************
I have developed an expert advisor for metatrader4 (MT4) and for jforex platform: results of expert advisor form 2015-01-01 to 2018-11-25 are very good with low drawdown and good profit.
********************************************************************************

Flunki Spelgubbs Pivot Palava Custom POC pivots with broad transgression detection ; non-standard tweak-able parameters for fine tuning - keeping private for now as the calls are good but could be better with some trend based options - catch me on Onex discord discord.gg - come chill trade and learn.

True Rolling Pivot Range IndicatorHere is the actual 3 day rolling pivot range indicator as detailed in Mark Fisher's book The Logical Trader.
N Day Pivot Moving Avg (WONTON GRP)This is a tool used by Fisher style traders. It allows the trader to set the pivot period (3 Days is default) and the moving averages of that pivot.
Provided by the Wonton Group.

RTD-Nifty Pivot, Targets, Vix range and Trend AnalyzerRTD-Nifty Pivot, Targets, Vix range and Trend Analyzer

LL-HL PivotThis indicator scans for the bullish structure known as a Higher Low (HL) across multiple lengths simultaneously, automatically selects the most suitable pattern, and plots it on the chart.
Below is a detailed explanation of how it works.
1. Basic Calculation Method (Definition of LL and HL)
This indicator is built on TradingView’s ta.pivotlow function.
Detecting Pivot Lows
For a given length, a Pivot Low is identified as the lowest point among the candles within the specified range to the left and right.
LL and HL Determination
LL (Lowest Low): The most recent Pivot Low is treated as the previous low.
HL (Higher Low): When a new Pivot Low forms above the previous LL, it is recognized as an HL, and the setup is considered “complete.”
Identifying the Pivot Line
During the LL–HL structure, the highest high between them is identified and used as the breakout level (Pivot Line / resistance), where a horizontal line is drawn.
2. Multi-Length Scanning
Unlike standard indicators that use only one length (e.g., Length = 5), this indicator evaluates a full range of lengths.
Min Length to Max Length
Example: Min = 2, Max = 10
Internally, it functions as if nine separate indicators (Length 2, 3, 4 … 10) are running simultaneously.
This allows the indicator to capture:
Small waves (short-term pullbacks)
Larger waves (broader structural moves)
3. Priority Mode System
Because multiple lengths are calculated at the same time, different LL–HL patterns may appear simultaneously.Priority Mode determines which setup is selected and displayed.
A. Lowest LH
Selects the pattern with the lowest pivot line (intermediate high).
Advantages:
Produces the lowest possible entry price
B. Longest Length
Selects the pattern with the longest length.
Advantages:
Focuses on larger structures and broader waves
Filters out noise
C. Shortest Length
Selects the pattern with the shortest length.
Advantages:
Reacts quickly to small moves
Useful for scalping or fast trend-following
Captures very short-term pullbacks
4. Additional Behavior and Features
Real-Time Invalidation
If price breaks below the confirmed HL, the structure is immediately considered invalid.
All previously drawn lines and labels are removed instantly, preventing outdated structures from remaining on the chart.
Pivot Line Extension
As long as the HL remains intact, the Pivot Line (breakout level) continues extending to the right.
Alerts
An alert can be triggered the moment price breaks above the Pivot Line on a closing basis.

Tomo's Pivots // last W, last M, last Q, last30d, last90d.These are pivots that you can use to look back at various time periods to find magnetic Price points of support and resistance. There are: weekly, last 30 days, last month, last 90 days, and last quarter. You can change the color and style of every indicator and its label. So if it happens to be November 29 today, you will see the last 90 days representing 90 days before November 29. But you will also see last quarter which represents from July 1 to September 30. These values are fair value equilibrium price point by averaging the high low and close of that time period. Weekly is great for intraday trading and the last 30 is great for momentum. Consider using the monthly for swing trading. Stay in the green.

Sz Pivot Dz Aj.New live&noon updateMulti-session pivot zones (Noon / Live / Aj.New) for gold (XAUUSD), based on 22–27 Oct 2025 configuration.
default
Session 1 27/10/68 Noon 11.00 waiting
Session 2 24 Live24/10/68
Session 3 24 Noon 11.00
Session 5 23 Noon 11.00
Session 6 22 Live 22/10/68
Credit to AJ. New
Coding by Line ID : b-sure.engineering
B-sure engineering and supply co.,ltd. Chiang rai Thailand

Shashwat Khurana's Pivot + Mean Reversion + RSI (Signals Only)Show BUY labels below bars when a bullish reversal is detected.
Show SELL labels above bars when a bearish reversal is detected.
Uses pivot levels, mean reversion, big candle, RSI, and volume filters.
