Magic Volume - Projected [MW]Magic Volume – Projected
This lower-pane volume tool estimates the full-bar volume before the bar closes by measuring the current bar’s elapsed time and the rate of incoming volume. It then contrasts that “expected volume” against typical activity and recent momentum to spotlight potential burst conditions (breakout/acceleration), color-codes the live volume stream, and annotates when the projected surge is likely bullish or bearish based on bar structure and recent highs/lows.
Settings
Projected / Expected Volume
Moving Average: EMA length used for volume baseline comparisons. (Default: 14)
Minimum Volume: Hard floor the bar’s raw volume must exceed to qualify as notable. (Default: 10,000)
Consecutive Volume Above 14 EMA: Count required for “sustained” high-volume context. (Default: 3)
Stochastic Volume Burst
Stochastic Length: Window for the Stochastic calculation on volume. (Default: 8)
Smoothing: Smoothing applied to Stochastic volume and its signal. (Default: 3)
Stochastic Volume Breakout Threshold: Level above which Stochastic volume is considered a breakout. (Default: 20)
Volume Bar Increase Amount: Multiplier the current bar’s volume must exceed vs. prior bar to be considered a “burst.” (Default: 1.618)
Plotted Items
Expected Volume (columns): Magenta columns projecting the full-bar volume from intrabar rate. Turns lime when a high expected-volume condition aligns with bullish bar structure; turns red under analogous bearish conditions.
Actual Volume (columns): Live volume columns, color-coded by state:
• Blue = baseline;
• Orange = “burst” (volume rising fast above prior × factor and above baseline);
• Yellow = “burst at breakout” (burst + Stochastic volume breakout);
• Light Blue = Stochastic breakout only.
Volume EMA (line): Yellow EMA for baseline comparison (default 14).
Calculations
Compute elapsed time in the current bar (ms → seconds) and convert the current bar’s accumulated volume into a rate (volume per second).
Project full-bar Expected Volume = (volume so far / seconds elapsed) × bar-seconds.
Compute Volume EMA (default 14) for baseline; derive Stochastic(volume, length) and smoothed signal for momentum.
Define “Burst” conditions:
• Volume > prior volume × Volume Bar Increase Amount;
• Volume > Minimum Volume;
• Volume > Volume EMA;
• Stochastic(volume) rising and/or above threshold.
Classify “Burst at Breakout” when Burst aligns with Stochastic crossover above the Breakout Threshold.
Classify Bullish/Bearish Expected Volume: if Expected Volume is ≥ 1.618 × prior bar volume and prior volume > Volume EMA, then:
• Bullish if bar is green with a rising low;
• Bearish if bar is red with a falling high.
Color-map actual volume columns by state; overlay Expected Volume columns (magenta) and paint conditional overlays (lime/red) when directional context is detected.
How to Use
Spot the Surge Early
When Expected Volume spikes well above typical (and especially above ~1.618× the prior bar) before the bar closes, it often precedes a volatile move. Use this to prepare entries with tight, structure-based risk (e.g., just beyond the current bar’s wick) and asymmetric targets.
Confirm with Momentum
Yellow/orange volume columns indicate burst/breakout behavior in the live tape. When this aligns with a lime (bullish) or red (bearish) Expected Volume column, the probability of follow-through improves—particularly if aligned with prevailing trend or key levels.
Context Matters
Combine with your preferred S/R or structure tools (e.g., order blocks, channels, VWAP) to avoid chasing into obvious supply/demand. The projected surge can mark both continuations and sharp reversals depending on location and broader context.
Alerts
High Expected Volume – Bullish: When projected volume surges and the price action meets bullish conditions (green body with rising low).
High Expected Volume – Bearish: When projected volume surges and the price action meets bearish conditions (red body with falling high).
Other Usage Notes and Limitations
Projected volume depends on intrabar pace; abrupt pauses/flushes can change the projection quickly, especially on very small timeframes.
Minimum Volume and EMA baselines help filter thin markets; adjust upward on illiquid symbols to reduce noise.
A rising projection does not pick direction on its own—directional coloring (lime/red) requires price-action confirmation; otherwise treat magenta projections as “heads-up” only.
As with any single indicator, use within a broader plan (risk management, structure, confluence) to mitigate false positives and improve selectivity.
Inputs (Quick Reference)
Moving Average (int, default 14)
Stochastic Length (int, default 8)
Smoothing (int, default 3)
Stochastic Volume Breakout Threshold (int, default 20)
Volume Bar Increase Amount (float, default 1.618)
Minimum Volume (int, default 10,000)
Consecutive Volume Above 14 EMA (int, default 3)
Forecasting

FVG Scanner ProFVG Scanner Pro — Smart Fair Value Gap Detector (with HTF context & proximity alerts)
What it does
FVG Scanner Pro automatically finds Fair Value Gaps (FVGs) on your current chart and (optionally) on a higher timeframe (HTF), draws them as color-coded zones, and notifies you when price comes close to a gap boundary using an ADR-based proximity trigger and (optional) volume confirmation. It’s designed for ICT-style gap trading, confluence building, and clean visual execution.
How it works:
FVG definition
* Bullish FVG (gap up): low > high (the current candle’s low is above the high 2 bars ago).
* Bearish FVG (gap down): high < low (the current candle’s high is below the low 2 bars ago).
* Gaps smaller than your Min FVG Size (%) are ignored. (Gap size = (top-bottom)/bottom * 100.)
Higher-timeframe logic (auto-selected)
The script auto picks a sensible HTF:
1–5m → 15m, 15m → 1H, 1H → 4H, 4H → 1D, 1D → 1W, 1W → 1M, small 1M → 3M, big ≥3M → 12M.
You can display HTF FVGs and even filter so current-TF FVGs only show when they overlap an HTF gap.
Proximity alerts (ADR-based)
The script computes ADR on the current chart timeframe over a user-set lookback (default 20 bars).
An alert fires when price moves toward the closest actionable boundary and comes within ADR × Multiplier:
Bullish: price moving down, within distance of the bottom of a bullish FVG.
Bearish: price moving up, within distance of the top of a bearish FVG.
Yellow ▲/▼ markers show where a proximity alert triggered.
Volume filter (optional)
Require volume to be greater than SMA(20) × multiplier to accept a newly formed FVG.
Lifecycle
Each gap remains active for Extend FVG Box (Bars) bars.
You can delete the box after fill, or keep filled gaps visible as gray zones, or hide them.
Color legend
Current-TF Bullish: Pink/Magenta box
Current-TF Bearish: Cyan/Turquoise box
HTF Bullish: Gold box
HTF Bearish: Orange box
Filled (if shown): Gray box
Alert markers: Yellow ▲ (bullish), Yellow ▼ (bearish)
Inputs (what to tweak)
Show FVGs: Bullish / Bearish / Both
Max Bars Back to Find FVG: collection window & cleanup guard
Extend FVG Box (Bars): how long a zone stays tradable/active
Min FVG Size (%): ignore micro gaps
Delete Box After Fill & Show Filled FVGs: choose how you want completed gaps handled
Show Alert Markers: show/hide the yellow proximity arrows
Show Higher Timeframe FVG: overlay HTF gaps (auto TF)
HTF Filter: only display current-TF gaps that overlap an HTF gap
ADR Lookback & Proximity Multiplier: tune alert sensitivity to your market & timeframe
Volume Filter & Volume > MA Multiple: require above-average volume for new gaps
Built-in alerts (ready to use)
Create alerts in TradingView (⚠️ “Once per bar” or “Once per bar close”, your choice) and select from:
🟢 Bullish FVG Proximity — price approaching a bullish gap bottom
🔴 Bearish FVG Proximity — price approaching a bearish gap top
✅ New Bullish FVG Formed
⚠️ New Bearish FVG Formed
The alert messages include the symbol and price; proximity markers are also plotted on chart.
Tips & best practices
Use FVGs with market structure (break of structure, swing points), order blocks, or liquidity pools for confluence.
On very low timeframes, raise Min FVG Size and/or lower Max Bars Back to reduce noise and keep things fast.
Extend FVG Box controls how long a zone is considered valid; align it with your holding horizon (scalp vs swing).
Information panel (top-right)
Shows your mode, current HTF, number of gaps in memory, active bull/bear counts, and current-TF ADR.

MACD cross over Buy/SellThis Indicator is purely on buying and selling the Script based on the MACD crossover Signals, which can be used for Scalping and finding the trend of the script for short and long term. When the MACD Line crosses the Signal line upwards, the script will move towards higher, and will move towards Lower when it crosses downwards. It's simple. Particularly, when the MACD line Crosses above the zero line after crossing the Signal line, the momentum will be high. Whereas when the MACD line Crosses below the zero line after crossing the Signal line downward, the momentum of falling will be high.

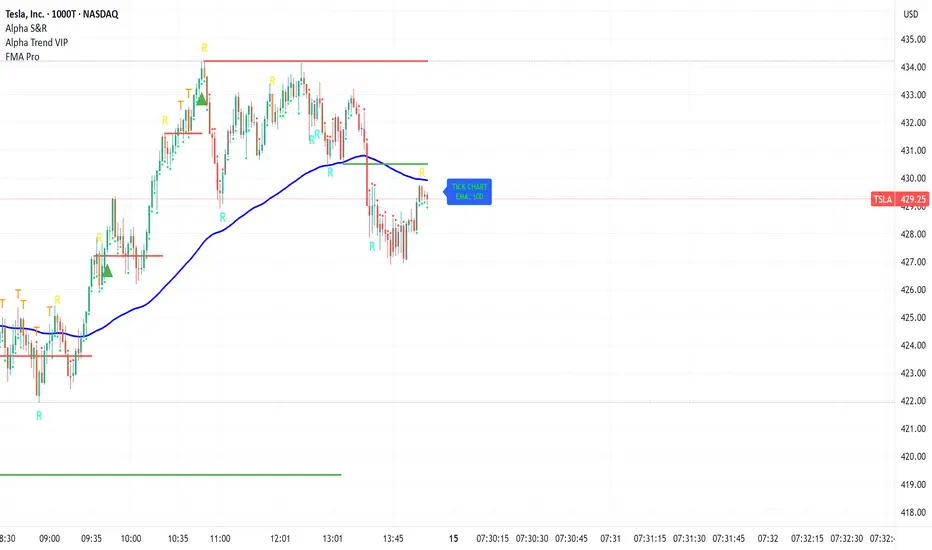
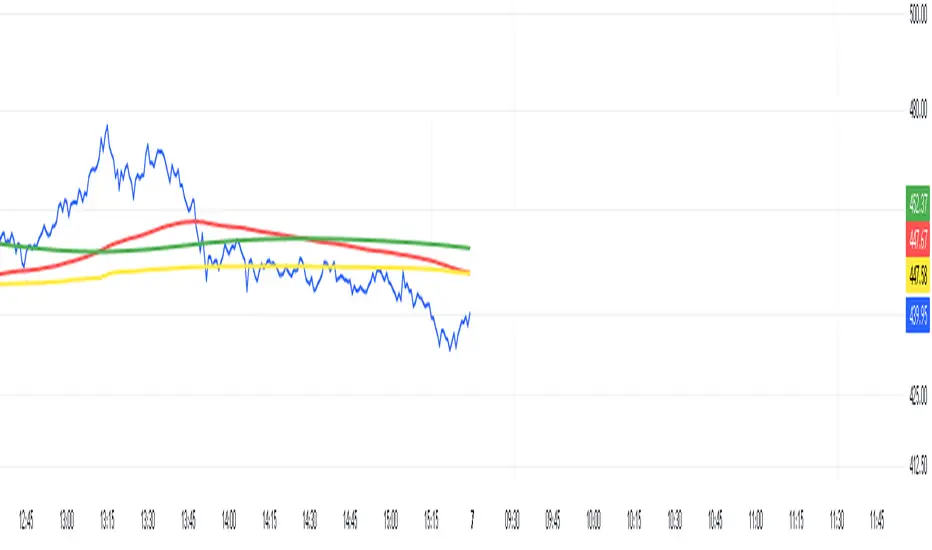
FMA Pro v1.0Foxbrady Moving Average Pro - uses EMA for tick based charts and SMA for time based charts, automatically.
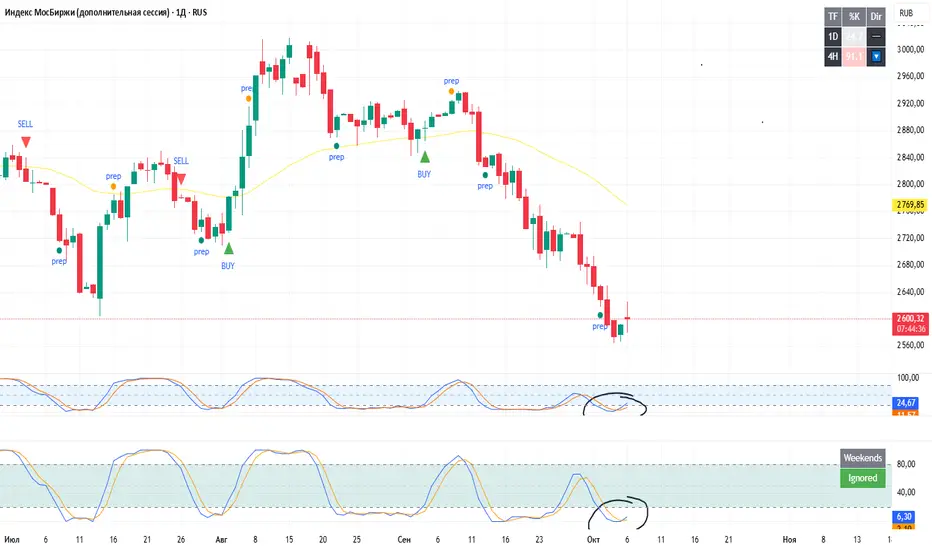
Stochastic RSI (Weekend option) — stableStochastic RSI (Weekend option)
This is a regular Stochastic RSI oscillator, the only difference is that it now allows you to exclude weekends from the calculation (you can enable or disable this feature in the settings).
Please note.
Trading days on weekends are different due to the lack of volumes and movements. The flatness that occurs on weekends negatively affects the calculations of indicators (especially when determining overbought or oversold conditions).
ARJ@combo This indicator tracks the combined premium of a Call and Put option (straddle) and overlays technical signals to help traders analyze option market behavior more effectively.
It is especially useful for BANKkNIFTY / NIFTY options, but you can apply it to any instrument by simply selecting the strike price symbols.

ARJ@ Combined Option Premium with EMA & VWAPThis indicator tracks the combined premium of a Call and Put option (straddle) and overlays technical signals to help traders analyze option market behavior more effectively.
It is especially useful for Banknifty / nifty options, but you can apply it to any instrument by simply selecting the strike price symbols.
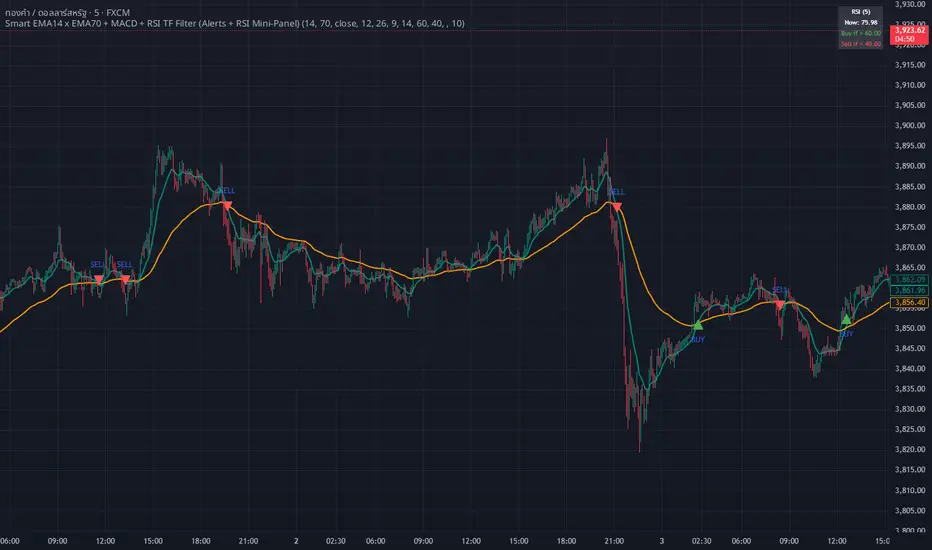
whang master trend🔥 Smart EMA + MACD + RSI Trend Filter
Catch real trends — avoid false signals!
Looking for clean and reliable trade alerts?
This script combines the power of EMA crossover, MACD momentum, and RSI trend strength — all in one simple tool.
📈 Buy Signal: EMA14 crosses above EMA70, MACD > 0, and RSI > 60
📉 Sell Signal: EMA14 crosses below EMA70, MACD < 0, and RSI < 40
✅ Both EMAs must slope in the same direction — no more sideways traps!
💡 Why traders love it:
Easy setup — plug & play
Directional EMA filter removes noise
Custom RSI timeframe filter for higher accuracy
Real-time alerts via Any alert() function call
Built-in RSI mini panel for quick reference
Perfect for traders who want to ride the trend, stay out of choppy markets,
and receive clear alerts at the right time.
✨ Add it to your chart today — let smart filters guide your trades 🚀
Liquidity StatusKey Points
The Liquidity Status (LS) indicator is designed to directly monitor liquidity conditions and determine if they are Bullish or Bearish.
If conditions are bullish, the candle is painted green (or whichever color is chosen by you to represent bullish liquidity) and the expected price action is up.
If conditions are bearish, the candle is painted red (or whichever color is chosen by you to represent bearish liquidity) and the expected price action is down.
LS allows you to monitor for when traders are absorbing or supplying liquidity and in which direction the liquidity is flowing.
LS works on equities, cryptocurrencies, forex, options data, and futures.
Summary
The Liquidity Status (LS) indicator measures liquidity directly without relying on bid/ask spreads, order-book information, or any other traditional means. The benefit of this non-traditional approach is a novel and unique way to interpret and analyze liquidity in the market.
LS is designed to be as straightforward as possible: when conditions are bullish then the outlook is bullish and the candles are painted the bullish color (default: green), and when conditions are bearish then the outlook is bearish and the candles are painted the bearish color (default: red).
This means the candles are not colored based on their price movements but rather based on their liquidity status.
Additionally, LS indicates Liquidity Flow (LF) as well. LF indicates where the source of liquidity is or is moving towards: either towards the Ask (if the Bid is requiring liquidity then the liquidity source becomes the Ask), or towards the Bid (if the Ask is requiring liquidity then the liquidity source becomes the Bid). This can be helpful in early identification of trend changes.
The default settings are designed to be streamlined but the Settings section below outlines how to add additional information and detail to your charts if desired.
Examples
An example of LS on default setting:
With Full and Declarative reporting:
ES Futures:
Details
In the default settings, LS indicates if conditions are:
Bullish : meaning that current liquidity is bullish and so too are outlooks, or
Bearish: meaning that current liquidity is bearish and so too are outlooks.
There are additional data that are provided via LS, if toggled on (as described below). They include:
Aggressive Bid / Ask : This indicates that there is an aggressive trader present. Aggressive traders are large liquidity absorbers and are defined as having a sense of urgency in their trading that will cause them to go where-ever (whichever price) they can in order to transact. A classic Aggressive Bid, for instance, is a short-seller currently being squeezed.
Eager Bid / Ask : This indicates that there is an eager trader present. Eager traders are defined by their willingness to “cross the isle” in order to transact. For example, an eager bid will move to the ask in order to transact whereas an organic bid would not.
Organic Bid / Ask : This indicates that transactions are occurring at the organic traders. Organic traders are defined as having a large time-horizon and are value-seekers. For instance, an organic ask will likely move price up in order to sell high (the second part of buy low, sell high).
Additionally, LS indicates LF by specifying which party has the demand for liquidity and which has the supply for liquidity.
Flow to Ask : This indicates that the demand to transact is flowing to the ask (i.e.: the bid needs to transact more than the ask) and thus the ask is becoming the liquidity supplier.
Flow to Bid : This indicates that the demand to transact is flowing to the bid (i.e.: the ask needs to transact more than the bid) and thus the bid is becoming the liquidity supplier.
Neutral : No discernable difference in liquidity demand.
In combination, these signals can produce powerful measurements of underlying liquidity activity. For instance:
If LS indicates “At Organic Ask” and LF indicates “Flow to Ask” then this means that (1) transactions are predominantly occurring at or near the organic ask and (2) the organic ask is the dominate liquidity supplier. The consequence is likely substantial price appreciation (remember: the organic ask wants to sell high and now they are setting the terms and conditions of transacting!).
Example - How it started: transactions started to occur at the Organic Ask with Flow to Ask:
Example - How it ended:
Conversely, “At Organic Bid” and “Flow to Bid” indicates that transactions are predominantly occurring at or near the organic bid (who wants to buy low) and they the ones fulfilling the demand to transact coming from the ask. The expected outlook? Price depreciation as the organic bid lowers their orders to average down!
Example - How it started: transactions started to occur at Organic Bid with Flow to Bid:
Example - How it ended:
Lastly, LS (in combination with Liquidity Triggers) can identify moments of high-risk for bull and bear traps (see FAQ for details on how traps are found).
Example: Bear-Trap (with LT displayed)
Example: Bull-Trap (with LT displayed)
Customization
LS has many customization options available.
Sensitivity Mode
LS comes in a variety of sensitivities (for the nerds: adjusting the Sensitivity vs. Specificity), outlined below:
Aggressive : The Aggressive sensitivity mode puts LS in a state of hyper-awareness for anything that might indicate a change in overall liquidity status (i.e.: Bullish to Bearish or Bearish to Bullish) is underway. The benefit of the Aggressive mode is that it does not take much for LS to change its mind about current conditions. The trade-off, however, is increase in false alarms.
Balance : The balanced setting works to balance specificity (how right LS is) with sensitivity (how much chang it takes to convince LS to change its mind).
Conservative : The conservative setting is prone to change slower than both Aggressive and Balance but is intended to be more “certain” of the changes when they are indicated. This can lower the sensitivity (early entrances to trend-changes might be delayed slightly) in exchange for greater confidence in the future.
Diamond : This is the most specific and least sensitive option. Designed for when you only want LS to indicate a change with the strictest of criteria met.
Examples:
Aggressive LS:
Balanced LS:
Conservative LS:
Diamond LS:
LS Detail Amount
Controls how much detail and information you want displayed.
Simplified : Keeps messaging straightforward: Bearish or Bullish.
Full : Parsing the data for greater detail about if conditions are Strong or Weak. Produces candles and text output.
LS Reporting Style
Interpretive : Text output from LS is kept as either Bullish or Bearish.
Declarative : Additional information regarding if the transactions are being performed by an Aggressive, Eager or Organic trader.
LS Candle Replacement
In order to have LS produce candles colored by liquidity, the `LS Candle Replacement` option must be selected, along with deselecting the charts candle-making by going to Settings -> Symbol and de-selecting `Body`, `Border`, and `Wick`.
Otherwise, LS’ colors will be over-ridden by the chart.
Alerts
LS comes with several alerts to help keep track of changing liquidity conditions in the market. They include:
Is Bullish / Bearish : fires at the start of the candle if conditions are bullish/bearish.
Has Become Bullish / Bearish : Fires at the end of the candle if conditions have swapped (as compared to the previous candle).
Flow is to Ask / Bid : Fires at the start of the candle to indicate which direction liquidity is flowing via LF.
Flow Switch to Bid / Ask : Fires if there is a change in the LF from one to the other.
Suspected Bear Trap : Fires if a bear trap is detected.
Suspected Bear Trap Ended : Fires if an on-going bear-trap has ended.
Suspected Bull Trap : Fires if a bull trap is detected.
Suspected Bull Trap Ended : Fires if an on-going bull-trap has ended.
Frequently Asked Questions
How can I get access to LS?
Please see the Author’s Instructions for more information.
Where can I get more information on LS?
Please see the Author’s Instructions for more information.
I tried to add LS to my chart but nothing is showing.
That’s no good! Be sure that the indicator hasn’t errored out (if there is a small red dot next to its name then it has errored out). If it has, then try re-applying the indicator to your chart.
If there is no error indicated, and you still do not see anything it may be likely that the requested symbol either:
Doesn’t have sufficient data to calculate LS on, or
Lacks the data for LS to be calculated completed.
To check, try using LS on a smaller interval. If LS starts to populate, it is likely that the needed data is present but just not enough for the timeframe you were interested in. If there is no LS even when moving to lower intervals, then it may be that the specified underlying lacks the required data.
How come LS is saying things are Bearish but price is going up?
Sometimes that can happen! But until LS indicates bullish liquidity, the expectation is that price will fall back down.
How come LS is saying things are Bullish but price is going down?
Sometimes that can happen! But until LS indicates bearish liquidity, the expectation is that price will recover and continue moving on upwards.
How do you locate Bear and Bull traps?
LS has LT (Liquidity Triggers) baked into it for alerts and uses LT to compare expected conditions with real conditions. If LS and LT are mismatched then a trap is detected. The LT conditions checked are:
If LT is in a bull-stack : that means LT(144) > LT(377) > LT(610), or
If LT is in a bear-stack : that means LT(610) < LT(377) < LT(144)
Then once the stack is determined, if LS disagrees:
LS is indicating Bullish while LT is in a bear-stack, or
LS is indicating Bearish while LT is in a bull-stack
Then the alert is triggered (based off of LT’s orientation). This means:
If conditions are Bullish but LT is showing a Bearish stack, then a Bull Trap is detected, and
If conditions are Bearish but LT is showing a Bullish Stack, then a Bear Trap is detected.
I have questions and maybe a bug!
Please reach out and report! Please refer to the Author’s Instructions for more information on how to reach out.
Does LS get updates?
Yup! Improvements come relatively frequently and if you have any suggestions for improvements, please don’t hesitate to reach out.

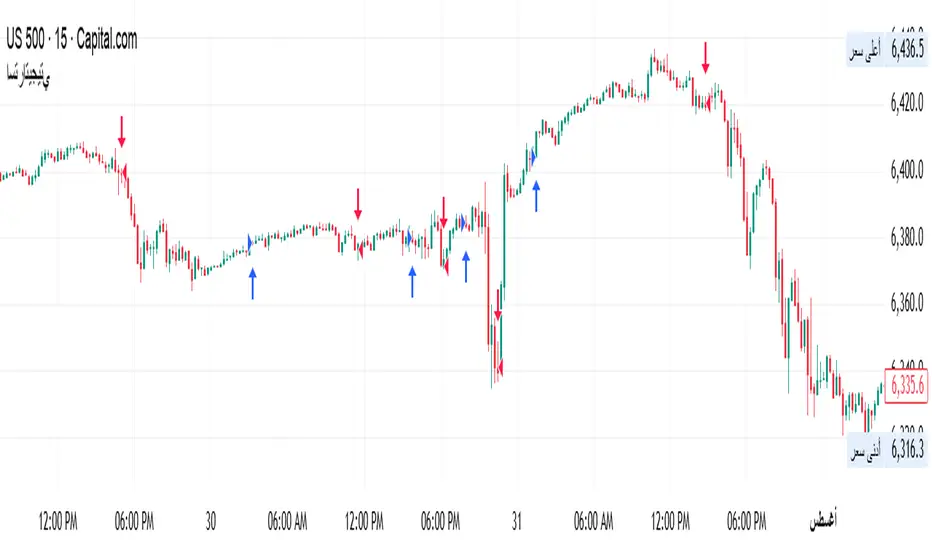
NS ND - EVR - Daily Bias - TRFxVolume & Price Action Signals
What It Does
Combines three proven trading methodologies: Effort vs Result (EVR), No Supply/No Demand (NS/ND), and Daily Bias tracking for intraday traders.
Features
Effort vs Result (EVR)
- **Bullish**: Green triangle below bar when price sweeps previous low with high volume and significant wick
- **Bearish**: Red triangle above bar when price sweeps previous high with high volume and significant wick
- Identifies potential reversals where volume doesn't match price movement
No Supply / No Demand (NS/ND)
- **No Demand (Red dot)**: Up-candle with declining volume - buyers weakening
- **No Supply (Green dot)**: Down-candle with declining volume - sellers weakening
- Grey dots = unconfirmed, colored dots = confirmed within lookahead period
- Based on Volume Spread Analysis (VSA) principles
Daily Bias Label
Top-right corner shows market direction:
- **BULLISH ↑** - Closed above Previous Day High
- **BEARISH ↓** - Closed below Previous Day Low
- **BULLISH/BEARISH REV** - Swept level but closed back inside
- **RANGE ↔** - Trading between PDH/PDL
## Settings
- **EVR**: Toggle on/off, volume multiplier, wick %, inside bars, transparency
- **NS/ND**: Toggle on/off, lookahead bars (default: 10)
- **Daily Bias**: Toggle label display
## Best For
✓ Intraday trading (1m-1h timeframes)
✓ Reversal setups
✓ Volume analysis
✓ Confluence trading (all signals align)
How to Use
1. Enable components you want (all can be toggled independently)
2. Trade EVR signals in direction of Daily Bias
3. Look for NS/ND confirmation at key levels
4. Wait for colored dots (confirmed signals) over grey (unconfirmed)
**Note**: Works on intraday timeframes only. NS/ND signals may repaint during confirmation period.

Customizable Dashboard (SIMPLE)This is a custom table where you can track any ticker and it's daily change. color coded to make things easy.

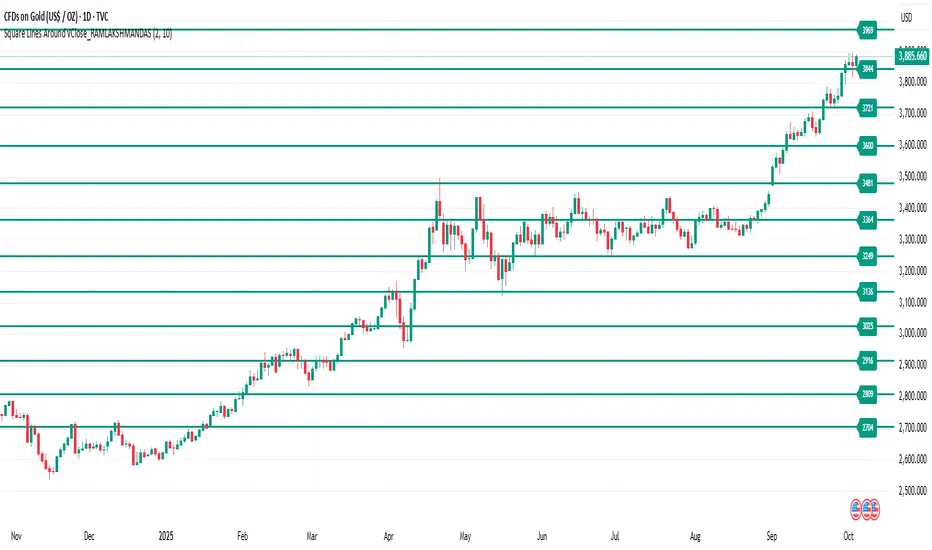
Square of natural number_RAMLAKSHMANDASThis indicator draws horizontal lines at square-number price levels around the square root of the current closing price. Inspired by Gann’s geometric approach, these lines serve as potential support and resistance levels. Each line is labeled with its price for easy identification. Traders can use it to visualize mathematically significant zones, identify reversal points, and enhance numerical trading strategies.
Pine Script Indicator: Odd Square Levels
This Pine Script indicator, designed for TradingView v6, plots dynamic horizontal support and resistance levels on the chart based on the square root of the current close price. It adheres to the specific principles of Gann theory, focusing exclusively on odd square numbers.
How it Works:
The indicator first calculates a base number by taking the square root of the current bar's close price and rounding it. This base number acts as the center of a user-defined range. The script then iterates through all the natural numbers within this range.
For each number in the range, it performs a check:
If the number is odd, the script calculates its square and plots a horizontal line at that price level.
If the number is even, the script adds 1 to the number before squaring it and plotting the line. This ensures that only levels corresponding to odd squares are ever drawn.
Key Features:
Dynamic Levels: The levels automatically adjust as the market price changes, providing real-time support and resistance zones.
Customizable Range: The user can specify an offset (e.g., ±10) around the square root of the price to control the number of levels displayed.
Visual Customization: Users can modify the color and width of the lines to suit their preference.
On-Chart Labels: The indicator can be configured to display a label next to each line, showing the number squared and the resulting price level (e.g., 3² = 9).
Performance Optimization: The indicator is designed to run efficiently by deleting old drawings on each new bar, preventing chart clutter and ensuring a smooth experience.
Ideal Usage:
This indicator is a powerful tool for traders who follow Gann theory or are looking for unconventional support and resistance levels. The levels are particularly useful for identifying potential trend reversals or areas of strong confluence with other trading strategies. It is recommended to use the indicator on volatile asset classes where price movements are significant, such as cryptocurrencies, as these assets tend to follow these types of mathematical relationships.
Katana_Fox RSI Pro - Advanced Momentum Indicator with Clear BUOverview:
Connors RSI Pro is a sophisticated enhancement of the classic Connors RSI indicator, designed for traders who demand professional-grade tools. This premium version combines multiple momentum components with intelligent signaling and beautiful visualization to give you an edge in the markets.
Key Features:
🎯 Clear BUY/SELL Signal System
BUY signals in green when CRSI crosses above oversold level
SELL signals in red when CRSI crosses below overbought level
Clean, professional labels that are easy to read
Customizable overbought/oversold levels (70/30 default)
🎨 Professional Visualization
Modern color scheme that adapts to market conditions
Customizable background fills for better readability
Smooth, easy-to-read line plotting
⚡ Enhanced Calculations
Triple-component momentum analysis (RSI, UpDown RSI, Percent Rank)
EMA smoothing for reduced noise and false signals
Configurable lengths for each component
🔔 Advanced Alert System
4 distinct alert conditions for various market scenarios
Compatible with TradingView's native alert system
Perfect for automated trading strategies
Input Parameters:
RSI Length (3): Period for standard RSI calculation
UpDown Length (2): Period for UpDown RSI component
ROC Length (100): Period for Rate of Change percentile ranking
Signal Alerts: Toggle BUY/SELL signals on/off
Custom Colors: Choose between classic and modern color schemes
Trading Signals:
BUY (Green Label): Bullish signal when CRSI crosses above oversold level
SELL (Red Label): Bearish signal when CRSI crosses below overbought level
Background Colors: Visual zones indicating momentum strength
Ideal For:
Swing traders seeking momentum reversals
Day traders looking for overbought/oversold conditions
Algorithmic traders needing reliable signals
Technical analysts wanting multi-timeframe confirmation
How to Use:
Oversold Bounce: Enter long when CRSI shows BUY signal above 30
Overbought Rejection: Enter short when CRSI shows SELL signal below 70
Trend Confirmation: Use the 50-level crossover for trend direction
Divergence Trading: Look for price/indicator divergences at extremes
Upgrade your trading arsenal with Connors RSI Pro - where professional analytics meet clear trading signals!

Position Size CalculatorPosition Size CalculatorRisk Management Made Simple – Size Your Trades Like a Pro!Tired of guessing position sizes and blowing up your account on oversized trades? This Pine Script indicator automates position sizing based on your risk tolerance, ensuring every trade risks only what you've predefined. Perfect for stocks, forex, crypto, or futures—works for long or short setups. Overlay it on your candlestick chart and watch the math do the work.Key Features:Smart Risk Control: Input your account size (e.g., $70k) and risk % (e.g., 1%). It caps your max loss per trade automatically.
Dynamic Entry & Stop: Use live chart close as entry, or click to set a manual entry level (green solid line). For stops, toggle manual placement (red broken line) or use a % distance—auto-calculates the effective % for precision.
Visual Markers: Green line for entry price, red dashed line for stop loss—spans your chart for easy spotting.
Customizable Table: Floating info panel shows Account Size, Risk Amount, Stop Distance %, and Position Size (shares/lots). Drag its position via settings (top-right default).
No More Guesswork: Formula: Position Size = (Account × Risk %) ÷ Stop Distance. Handles edge cases like tiny distances to avoid div-by-zero.
How to Use:Add to your chart via Pine Editor.
In settings: Set account size/risk %. Toggle "Use Manual Entry Price" and click chart to place green line. Do the same for stop (red line) or use % input.
Table updates live—grab the position size and execute!
Pro Tip: For shorts/longs, the abs distance keeps risk symmetric. Test on demo first.
Built for v6—clean, lightweight, and 100% customizable. Share your tweaks in comments! Remember, this is a tool, not advice—trade responsibly. (Inspired by classic Kelly Criterion vibes, but simplified for daily grinders.)

ATR Horizontal Lines from EMA and SMA with TableHow it works:
The script calculates ATR levels (of your choosing)
Instead of plotting curves, it creates horizontal lines
The lines are deleted and recreated on each bar to show current levels
Lines extend to the right or can be limited to a certain width
Customization options:
Line width (1-10 pixels)
Individual colors for each of the 4 lines
All the original parameters (EMA/SMA lengths, ATR length, multipliers)
The horizontal lines will now show the current ATR-based support/resistance levels and move dynamically as the EMAs, SMA, and ATR values change with new price data.

OPR 4 ZonesThe OPR 4-Zone Boxes indicator visualizes four distinct market sessions on your chart by automatically drawing boxed ranges (high / low) and dotted midlines for each session. Each session box is created using time-based timestamps (timezone-aware) and updates in real time during the session. When the session closes, the box is locked to the session end, while an optional extension can display the session range for a configurable period afterward — useful for spotting retests, breakouts, and bias zones.
Designed for traders who rely on session structure and price-action, OPR 4-Zone provides clear, non-intrusive visuals and is fully configurable: enable or disable individual sessions, set start/end and extension times per session, choose colors and transparency for both the primary box and the extension, and display dotted midlines to quickly gauge session control. Objects are cleaned up at the start of each new day to prevent clutter and ensure reliable behavior when scrolling or changing timeframes.
Key features :
- Four independent session boxes (Morning, Afternoon, Evening, Night) with separate enable switches
- Timezone-aware timestamping so boxes align with the session times you want
- Locked session ranges at session close and optional extension period after close
- Dotted midline for quick reference to the session midpoint
- Customizable colors and background transparency for both base and extended boxes
- Automatic cleanup of session objects on new trading day to avoid frozen or stray boxes
- Lightweight and overlay-friendly with sensible defaults for fast setup
Suggested usage :
Use the indicator to mark session ranges for intraday support/resistance, identify where price is trading relative to session midpoint, and watch for breakout or rejection setups near session highs/lows. Combine with volume-based or momentum indicators to confirm breakouts through the session box.

3/4-Bar GRG / RGR Pattern (Conditional 4th Candle)This indicator can be used to identify the Green-Red-Green or Red-Green-Red pattern.
It is a price action indicator where a price action which identifies the defeat of buyers and sellers.
If the buyers comprehensively defeat the sellers then the price moves up and if the sellers defeat the buyers then the price moves down.
In my trading experience this is what defines the price movement.
It is a 3 or 4 candle pattern, beyond that i.e, 5 or more candles could mean a very sideways market and unnecessary signal generation.
How does it work?
Upside/Green signal
Say candle 1 is Green, which means buyers stepped in, then candle 2 is Red or a Doji, that means sellers brought the price down. Then if candle 3 is forming to be Green and breaks the closing of the 1st candle and opening of the 2nd candle, then a green arrow will appear and that is the place where you want to take your trade.
Here the buyers defeated the sellers.
Sometimes candle 3 falls short but candle 4 breaks candle 1's closing and candle 2's opening price. We can enter on candle 4.
Important - We need to enter the trade as soon as the price moves above the candle 1 and 2's body and should not wait for the 3rd or 4th candle to close. Ignore wicks.
I have restricted it to 4 candles and that is all that is needed. More than that is a longer sideways market.
I call it the +-+ or GRG pattern.
Stop loss can be candle 2's mid for safe traders (that includes me) or candle 2's body low for risky traders.
Back testing suggests that body low will be useless and result in more points in loss because for the bigger move this point will not be touched, so why not get out faster.
Downside/Red signal
Say candle 1 is Red, which means sellers stepped in, then candle 2 is Green or a Doji, that means buyers took the price up. Then if candle 3 is forming to be Red and breaks the closing of the 1st candle and opening of the 2nd candle then a Red arrow will appear and that is the place where you want to take your trade.
Sometimes candle 3 falls short but candle 4 breaks candle 1's closing and candle 2's opening price. We can enter on candle 4.
We need to enter the trade as soon as the price moves below the candle 1 and 2's body and should not wait for the 3rd or 4th candle to close.
I have restricted it to 4 candles and that is all that is needed. More than that is a longer sideways market.
I call it the -+- or RGR pattern.
Stop loss can be candle 2's mid for safe traders ( that includes me) or candle 2's body high for risky traders.
Back testing suggests that body high will be useless and result in more points in loss because for the bigger move this point will not be touched, so why not get out faster.
Important Settings
You can enable or disable the 4th candle signal to avoid the noise, but at times I have noticed that the 4th candle gives a very strong signal or I can say that the strong signal falls on the 4th candle. This is mostly a coincidence.
You can also configure how many previous bars should the signal be generated for. 10 to 30 is good enough. To backtest increase it to 2000 or 5000 for example.
Rest are self explanatory.
Pointers
If after taking the trade, the next candle moves in your direction and closes strong bullish or bearish, then move SL to break even and after that you can trail it.
If a upside trade hits SL and immediately a down side trade signal is generated on the next candle then take it. Vice versa is true.
Trades need to be taken on previous 2 candle's body high or low combined and not the wicks.
The most losses a trader takes is on a sideways day and because in our strategy the stop loss is so small that even on a sideways day we'll get out with a little profit or worst break even.
Hold targets for longer targets and don't panic.
If last 3-4 days have been sideways then there is a good probability that day will be trending so we can hold our trade for longer targets. Target to hold the trade for whole day and not exit till the day closes.
In general avoid trading in the middle of the day for index and stocks. Divide the day into 3 parts and avoid the middle.
Use Support/Resistance, 10, 20, 50, 200 EMA/SMA, Gaps, Whole/Round numbers(very imp) for identifying targets.
Trail your SL.
For indexes I would use 5 min and 15 min timeframe.
For commodities and crypto we can use higher timeframe as well. Look for signals during volatile time durations and avoid trading the whole day. Signal usually gives good targets on those times.
If a GRG or RGR pattern appears on a daily timeframe then this is our time to go big.
Minimum Risk to Reward should be 1:2 and for longer targets can be 1:4 to 1:10.
Trade with small lot size. Money management will happen automatically.
With small lot size and correct Risk-Re ward we can be very profitable. Don't trade with big lot size.
Stay in the market for longer and collect points not money.
Very imp - Watch market and learn to generate a market view.
Very imp - Only 4 candles are needed in trading - strong bullish, strong bearish, hammer, inverse hammer and doji.
Go big on bearish days for option traders. Puts are better bought and Calls are better sold.
Cluster of green signals can lead to bigger move on the upside and vice versa for red signals.
Most of this is what I learned from successful traders (from the top 2%) only the indicator is mine.

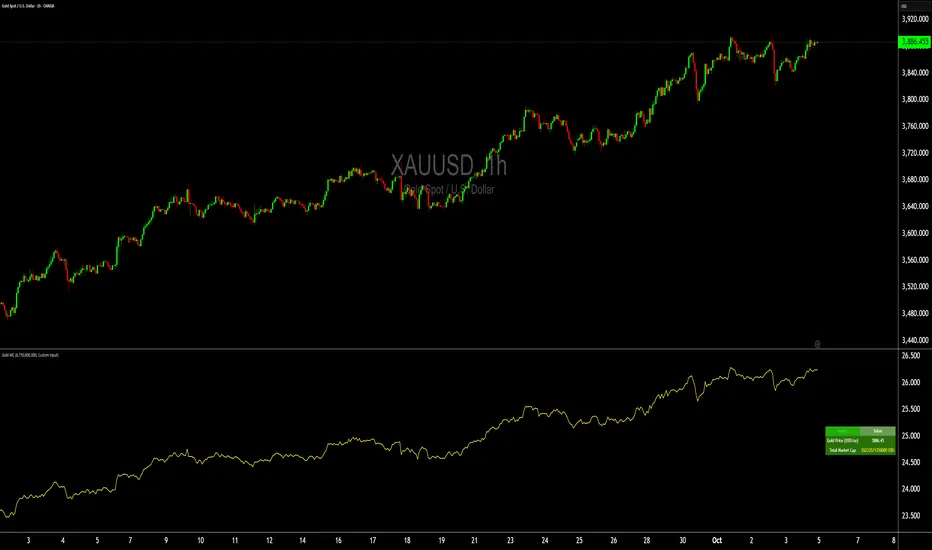
Gold Total Market Cap By Wave Trader Gold Total Market Cap (Updated 2025)
Overview
This indicator calculates and visualizes the total market capitalization of gold in real-time, based on the current XAUUSD spot price and the estimated above-ground gold supply. It transforms the raw gold price into a scaled "market cap" view (in trillions USD), helping traders contextualize gold's global value—often compared to stocks, crypto, or fiat reserves. As of October 2025, gold's cap hovers around $26–27T, underscoring its status as a premier safe-haven asset.
How It Works
Core Formula: Market Cap = Gold Price (USD/oz) × Total Supply (troy oz), scaled to trillions for chart readability.
Supply Data: Defaults to the World Gold Council (WGC) mid-2025 estimate of ~218,000 metric tonnes (~7.01B troy oz), but customizable for scenarios like historical or projected figures.
Plotted as a smooth yellow line below the price pane, mirroring gold's price movements but in cap terms.
Key Features
Dynamic Label: A real-time label on the yellow line displays the exact market cap (e.g., "26.8") for instant reference, styled like popular TradingView cap indicators.
Reference Line: Horizontal dashed line at 25T USD to highlight key thresholds (e.g., surpassing Bitcoin's cap).
Info Table: Top-right panel shows current gold price and full market cap (e.g., "26.8T USD") for quick stats.
Overlay-Free: Designed for a separate pane to avoid cluttering your main XAUUSD chart.
Data Sources & Customization
Relies on live XAUUSD close prices from TradingView.
Supply input: Switch between "WGC Mid-2025" (default) or custom values—ideal for sensitivity analysis (e.g., adding future mining output).
No external API calls; fully self-contained for fast performance.
Usage Tips
For Gold Traders: Spot divergences between price momentum and cap growth to gauge overbought/oversold conditions.
Portfolio Context: Compare to S&P 500 cap (~$50T) or BTC (~$2T) by adding multi-symbol alerts.
Timeframes: Best on daily/weekly for long-term trends; works on 1H+ for intraday macro views.
Alerts: Set notifications for cap milestones (e.g., "Gold Cap > 28T") via TradingView's alert system.
Track gold's "infinite market cap" evolution—because unlike stocks, gold's supply grows slowly, amplifying price impact. Updated for 2025 data; feedback welcome! 🚀
ATT Numbers Header (Movable)For anybody that trades with ATT (Advanced Time Technique) And can't remember the numbers and want's to have them on their chart at all time with full customizability as well this indicator is for you.

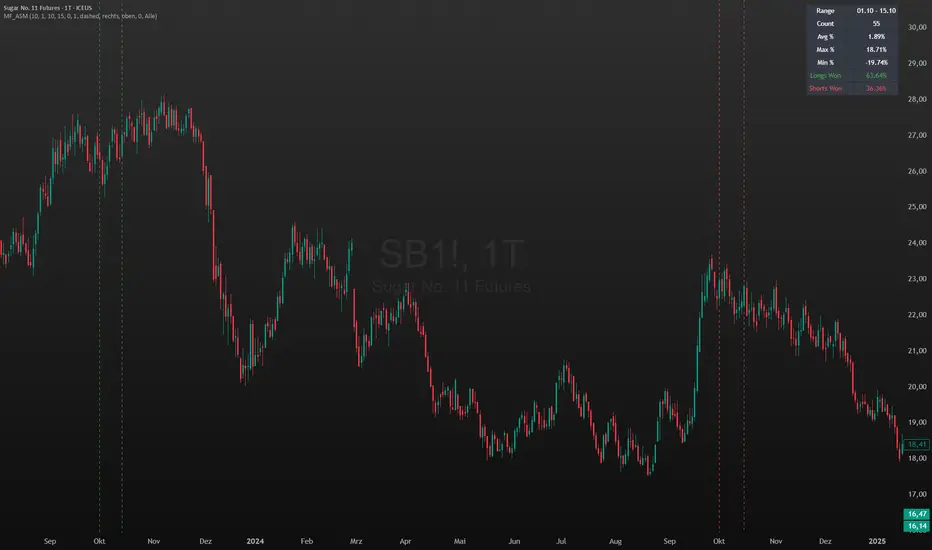
MF_Average_Seasonal_MovementYou can chose a date range and see the average, min and max movement within that time.
n addition it shows how many longs or shorts would have won in that time frame.
To quikly look at the time periods in the past it markes the chosen dates each year with two horizontal lines.
You can utilize the election year cycle and look only at post election years for example
TRADER PERFORMANCEAn exclusive tool for scalping, day trading, swing trading, and position trading, designed to maximize your success rate and reduce input noise. Recognized for its high accuracy, it's the ideal indicator for those seeking consistency and solid market results.
my_strategy_2.0Overview:
This is a high-speed scalping strategy optimized for volatile crypto assets (BTC, ETH, etc.) on timeframes 1m–5m. It combines trend-following SuperTrend with confirmations from MACD, RSI, Bollinger Bands, and volume spikes for precise entries. Focus on quick profits (1–3 ATR) with strict risk control: partial take-profits, stop-loss, and trailing breakeven after the first TP.
Key Signals:
Long: SuperTrend flip up + MACD crossover up + RSI >50 + BB Upper breakout + volume spike + volatility filter (ATR >0.5%).
Short: Similar but downward.
Exits and Risks:
TP: 33% at +1 ATR, 33% at +2 ATR, 34% at +3 ATR (customizable).
SL: Initial at -1 ATR, after TP1 — to breakeven with trailing on BB midline (optional).
Filters: Minimum ATR to avoid flat markets; realistic commissions in backtests.
Recommendations:
Test on 2020–2025 data (out-of-sample 2024+). Expected Win Rate ~55%, Profit Factor >1.8, Drawdown <10%. Ideal for 1–2% risk per trade. Not for beginners — use paper trading.
Disclaimer: Past results do not guarantee future performance. Trade at your own risk.
(Pine v6 code, ready for publication. Author: gopog777 with expert fixes.)
