Global M2 Money Supply (100+ countries, USD, Offset)Global M2 Money Supply:
-potentially 100+ countries - countries can be added in Script,
-USD, Offset
-offset in months can be manually adjusted to account for the time that i takes for liquidity to hit the market
Forecasting

Trend Line Methods (TLM)Trend Line Methods (TLM)
Overview
Trend Line Methods (TLM) is a visual study designed to help traders explore trend structure using two complementary, auto-drawn trend channels. The script focuses on how price interacts with rising or falling boundaries over time. It does not generate trade signals or manage risk; its purpose is to support discretionary chart analysis.
Method 1 – Pivot Span Trendline
The Pivot Span Trendline method builds a dynamic channel from major swing points detected by pivot highs and pivot lows.
• The script tracks a configurable number of recent pivot highs and lows.
• From the oldest and most recent stored pivot highs, it draws an upper trend line.
• From the oldest and most recent stored pivot lows, it draws a lower trend line.
• An optional filled area can be drawn between the two lines to highlight the active trend span.
As new pivots form, the lines are recalculated so that the channel evolves with market structure. This method is useful for visualising how price respects a trend corridor defined directly by swing points.
Method 2 – 5-Point Straight Channel
The 5-Point Straight Channel method approximates a straight trend channel using five key points extracted from a fixed lookback window.
Within the selected window:
• The window is divided into five segments of similar length.
• In each segment, the highest high is used as a representative high point.
• In each segment, the lowest low is used as a representative low point.
• A straight regression-style line is fitted through the five high points to form the upper boundary.
• A second straight line is fitted through the five low points to form the lower boundary.
The result is a pair of straight lines that describe the overall directional channel of price over the chosen window. Compared to Method 1, this approach is less focused on the very latest swings and more on the broader slope of the market.
Inputs & Menus
Pivot Span Trendline group (Method 1)
• Enable Pivot Span Trendline – Turns Method 1 on or off.
• High trend line color / Low trend line color – Colors of the upper and lower trend lines.
• Fill color between trend lines – Base color used to shade the area between the two lines. Transparency is controlled internally.
• Trend line thickness – Line width for both high and low trend lines.
• Trend line style – Line style (solid, dashed, or dotted).
• Pivot Left / Pivot Right – Number of bars to the left and right used to confirm pivot highs and lows. Larger values produce fewer but more significant swing points.
• Pivot Count – How many historical pivot points are kept for constructing the trend lines.
• Lookback Length – Number of bars used to keep pivots in range and to extend the trend lines across the chart.
5-Point Straight Channel group (Method 2)
• Enable 5-Point Straight Channel – Turns Method 2 on or off.
• High channel line color / Low channel line color – Colors of the upper and lower channel lines.
• Channel line thickness – Line width for both channel lines.
• Channel line style – Line style (solid, dashed, or dotted).
• Channel Length (bars) – Lookback window used to divide price into five segments and build the straight high/low channel.
Using Both Methods Together
Both methods are designed to visualise the same underlying idea: price tends to move inside rising or falling channels. Method 1 emphasises the most recent swing structure via pivot points, while Method 2 summarises the broader channel over a fixed window.
When the Pivot Span Trendline corridor and the 5-Point Straight Channel boundaries align or intersect, they can highlight zones where multiple ways of drawing trend lines point to similar support or resistance areas. Traders can use these confluence zones as a visual reference when planning their own entries, exits, or risk levels, according to their personal trading plan.
Notes
• This script is meant as an educational and analytical tool for studying trend lines and channels.
• It does not generate trading signals and does not replace independent analysis or risk management.
• The behaviour of both methods is timeframe- and symbol-agnostic; they will adapt to whichever chart you apply them to.

CRT / ORB Signals [Yosiet]What is the CRT Pattern?
The Counter-Retracement Pattern is a classic three-candle setup that reveals moments of market structure weakness and potential reversal. It occurs when a strong move is temporarily rejected, signaling a possible continuation.
Several names for the same candlestick pattern: CRT, ORB, Morning Star, Evening Star, and others, but I'm not going to talk about it.
Here’s the anatomy of a Bullish CRT:
Candle 1 (C1: The Signal Candle): A significant momentum candle in a downtrend.
Candle 2 (C2: The Retracement/Sweep Candle): This is the critical candle. It must sweep the low of C1 (liquidity grab / sweep) but then close with its body inside the range of C1 .
Candle 3 (C3: The Confirmation/Entry Candle): A bullish candle that closes above C2's close, confirming the pattern.
Here’s the anatomy of a Bearish CRT:
The bearish pattern is the exact inverse, sweeping the high of Candle 1.
Why This Indicator?
Clarity and Precision. This script is built for accuracy and minimalism.
No Repainting: The logic is calculated on the closed historical bars. The signal is only plotted on the entry candle (Candle 3) after it has closed.
Clean Visuals: Instead of cluttering every candle, it shows you only what you need:
Green Up Arrow: Signals a confirmed Bullish CRT, suggesting a Long entry.
Red Down Arrow: Signals a confirmed Bearish CRT, suggesting a Short entry.
Faint Circles: Subtle white circles mark the high/low of Candle 1 and Candle 2, helping you visually trace the pattern structure without obstruction.

Aspects of Mars-Saturn by BTThis script displays the most commonly used aspects between Mars and Saturn. It uses a +/-2 degree orb (deviation), meaning the script shows the dates when the calculated distance between Mars and Saturn is within a 2 degree deviation of a major aspect.
Most of the astrological applications uses 3 degree or more for orb however this will cause chart overload. So please keep in mind to consider a couple of dates before or after if you want to use bigger orb.
The script includes an option to plot only the start date of sequential aspect events to reduce visual clutter and improve chart clarity. It currently covers dates from 2020 to 2030, but more will be added soon.
Currently available aspects:
Conjunction - 0 Degree
Opposition - 180 Degree
Trine - 120 Degree
Square - 90 Degree
Sextile - 60 Degree
Inconjunction - 150 Degree
Semi-Sextile - 30 Degree
Semi-Square - 45 Degree
Sesquiquadrate - 135 Degree

Screener: Multi-Timeframe CRT / ORB [Yosiet]Are you tired of manually scanning dozens of charts across different timeframes, searching for that perfect reversal setup? What if you could have a system that does the heavy lifting for you, pinpointing high-probability reversal patterns across the entire market in real-time?
Several names for the same candlestick pattern: CRT, ORB, Morning Star, Evening Star, and others, but I'm not going to talk about it.
What is a Candle Retracement (CRT) Pattern?
For those who may be unfamiliar, the Candle Retracement pattern is a robust 3-candle setup that signals the potential exhaustion of a trend and the start of a reversal.
Bullish CRT:
Candle 1 (Signal): A significant bearish candle.
Candle 2 (Retracement): A candle that sweeps the lows of Candle 1 but closes within its body. This shows the sellers are overextended and losing momentum.
Candle 3 (Confirmation): A bullish candle that closes above Candle 2's close, confirming the reversal.
Bearish CRT:
Candle 1 (Signal): A significant bullish candle.
Candle 2 (Retracement): A candle that sweeps the highs of Candle 1 but closes within its body.
Candle 3 (Confirmation): A bearish candle that closes below Candle 2's close.
How This Screener Supercharges Your Trading
Manually finding these setups is time-consuming. This indicator automates the entire process, scanning up to four symbols across nine different timeframes—from the fast-paced 5-minute chart to the strategic weekly view.
Key Features:
Multi-Symbol, Multi-Timeframe Matrix: Get an instant, bird's-eye view of all CRT signals in a clean, easy-to-read table.
Customizable Logic: Fine-tune the pattern detection to your liking:
Lookback Period: How many bars back to search for patterns.
Min Candle %: The minimum body size of Candle 1, ensuring you only get significant signals.
Sweep %: The minimum required wick sweep of Candle 2, filtering for meaningful false breaks.
Visual & Alert System:
Clear Visuals: Green circles (🟢) for Bullish CRT and red circles (🔴) for Bearish CRT.
Proactive Alerts: Receive real-time pop-up and push notifications the moment a new pattern is confirmed on any timeframe.
Final Thoughts & Risk Management
The Multi-Timeframe CRT Screener is designed to be a cornerstone of your trading strategy, helping you find high-quality setups with efficiency. However, no indicator is infallible.
Always use confluence: Use the signals from this screener in conjunction with other factors like key support/resistance levels, volume, or momentum indicators.
Manage your risk: Always use a stop-loss. A good initial stop for a CRT pattern can be placed just beyond the extreme of Candle 1 (the low for bullish, high for bearish).
I hope you find this tool as invaluable in your trading as I have. I'm constantly working on improvements, so please feel free to leave your suggestions, comments, and questions below. If you find it useful, give it a like and share it with your trading community!
Happy Trading,
Yosiet

Reversal Correlation Pressure [OmegaTools]Reversal Correlation Pressure is a quantitative regime-detection and signal-filtering framework designed to enhance both reversal timing and breakout validation across intraday and multi-session markets.
It is built for discretionary and systematic traders who require a statistically grounded filter capable of adapting to changing market conditions in real time.
1. Purpose and Overview
Market conditions constantly rotate through phases of expansion, contraction, trend persistence, and noise-driven mean reversion. Many strategies break down not because the signal is wrong, but because the regime is unsuitable.
This indicator solves that structural problem.
The tool measures the evolving correlation relationship between highs and lows — a robust proxy for how “organized” or “fragmented” price discovery currently is — and transforms it into a regime pressure reading. This reading is then used as the core variable to validate or filter reversal and breakout opportunities.
Combined with an internal performance-based filter that learns from its past signals, the indicator becomes a dynamic decision engine: it highlights only the signals that statistically perform best under the current market regime.
2. Core Components
2.1 Correlation-Based Regime Mapping
The relationship between highs and lows contains valuable information about market structure:
High correlation generally corresponds to coherent, directional markets where momentum and breakouts tend to prevail.
Low or unstable correlation often appears in overlapping, rotational phases where price oscillates and mean-reversion behavior dominates.
The indicator continuously evaluates this correlation, normalizes it statistically, and displays it as a pressure histogram:
Higher values indicate regimes favorable to trend continuation or momentum breakouts.
Lower values indicate regimes where reversals, pullbacks, and fade setups historically perform better.
This regime mapping is the foundation upon which the adaptive filter operates.
2.2 Reversal Stress & Breakout Stress Signaling
Raw directional opportunities are identified using statistically significant deviations from short-term equilibrium (overbought/oversold dynamics).
However, unlike traditional mean-reversion or breakout tools, signals here are not automatically taken. They must first be validated by the regime framework and then compared against the performance of similar past setups.
This dual evaluation sharply reduces the noise associated with reversal attempts during strong trends, while also preventing breakout attempts during choppy, anti-directional conditions.
2.3 Adaptive Regime-Selection Backtester
A key innovation of this indicator is its embedded micro-backtester, which continuously tracks how reversal or breakout signals have performed under each correlation regime.
The system evaluates two competing hypotheses:
Signals perform better during high-correlation regimes.
Signals perform better during low-correlation or neutral regimes.
For each new trigger, the indicator looks back at a rolling sample of past setups and measures short-term performance under both regimes. It then automatically selects the regime that currently demonstrates the superior historical edge.
In other words, the indicator:
Learns from recent market behavior
Determines which regime supports reversals
Determines which regime supports breakouts
Applies the optimal filter in real time
Highlights only the signals that historically outperformed under similar conditions
This creates a dynamic, statistically supervised approach to signal filtering — a substantial improvement over static or fixed-threshold systems.
2.4 Visual Components
To support rapid decision-making:
Correlation Pressure Histogram:
Encodes regime strength through a gradient-based color system, transitioning from neutral contexts into strong structural phases.
Directional Markers:
Visual arrows appear when a signal passes all filters and conditions.
Bar Coloring:
Bars can optionally be recolored to reflect active bullish or bearish bias after the adaptive filter approves a signal.
These components integrate seamlessly to give the trader a concise but complete view of the underlying conditions.
3. How to Use This Indicator
3.1 Identifying Regimes
The histogram is the anchor:
High, brightly colored columns suggest trend-friendly behavior where breakout alignment and directional follow-through have historically been stronger.
Low or muted columns suggest mean-reversion contexts where counter-trend opportunities and reversal setups gain reliability.
3.2 Filtering Signals
The indicator automatically decides whether a reversal or breakout trigger should be respected based on:
the current correlation regime,
the learned performance of recent signals under similar conditions, and
the directional stress detected in price.
The user does not need to adjust anything manually.
3.3 Integration with Other Tools
This indicator works best when combined with:
VWAP or session levels
Market internals and breadth metrics
Volume, order flow, or delta-based tools
Local structural frameworks (support/resistance, liquidity highs and lows)
Its strength is in telling you when your other signals matter and when they should be ignored.
4. Strengths of the Framework
Automatically adapts to changing micro-regimes
Reduces false reversals during strong trends
Avoids false breakouts in overlapping, rotational markets
Learns from recent historical performance
Provides a statistically driven confirmation layer
Works on all liquid assets and timeframes
Suitable for both discretionary and automated environments
5. Disclaimer
This indicator is provided strictly for educational and analytical purposes.
It does not constitute trading advice, investment guidance, or a recommendation to buy or sell any financial instrument.
Past performance of any statistical filter or adaptive method does not guarantee future results.
All trading involves significant risk, and users are responsible for their own decisions and risk management.
By using this indicator, you acknowledge that you are fully responsible for your trading activity.

FLD 3DFLD 3D - Future Lines of Demarcation Indicator
═══════════════════════════════════════════════════
THEORETICAL FOUNDATION
═══════════════════════════════════════════════════
This indicator implements Future Lines of Demarcation (FLD), a key concept from J.M. Hurst's cyclic analysis theory. FLDs are price-based lines displaced forward in time by half the wavelength of a dominant cycle, creating a predictive framework for price movement analysis.
The core principle: when price crosses an FLD line, it indicates a potential change in the current cycle phase. FLDs act as dynamic support/resistance levels that "anticipate" where price should be based on the dominant cycle's rhythm.
═══════════════════════════════════════════════════
CALCULATION METHODOLOGY
═══════════════════════════════════════════════════
The indicator calculates three FLD lines:
1. FLD HIGH: Takes the bar's high price and shifts it forward by offset bars
2. FLD LOW: Takes the bar's low price and shifts it forward by offset bars
3. FLD MEDIAN: Calculates a median price using the selected method, then shifts forward
The offset is calculated as: offset = Period / 2
This displacement represents the half-cycle concept: if a cycle has a period of 48 bars, the FLD will be displaced 24 bars into the future. This creates a "lead" indicator that shows where price should theoretically be based on the cycle's wave pattern.
PRICE METHODS AVAILABLE:
- HL2: (High + Low) / 2 - Simple midpoint
- HLC3: (High + Low + Close) / 3 - Weighted with close
- HLCC4: (High + Low + Close + Close) / 4 - Close has double weight
- OHLC4: (Open + High + Low + Close) / 4 - Full bar average
- VWAP-like: Volume-weighted high/low average
- True Range: Uses previous close for range calculation
═══════════════════════════════════════════════════
AUTO-PERIOD ADJUSTMENT FEATURE
═══════════════════════════════════════════════════
The indicator includes multi-timeframe adaptation logic. When "Auto Period" is enabled:
1. Detects current chart timeframe (minutes, hours, days, weeks)
2. Compares it to the reference timeframe setting
3. Calculates adjustment ratio: Reference TF / Current TF
4. Applies ratio to base period: Adjusted Period = Base Period × Ratio
Example: If Base Period = 48, Reference TF = 60min, Current chart = 15min
→ Ratio = 60/15 = 4
→ Adjusted Period = 48 × 4 = 192 bars
This ensures the indicator tracks the same real-time cycle length across different chart timeframes, maintaining consistency in cycle analysis.
═══════════════════════════════════════════════════
VISUAL COMPONENTS
═══════════════════════════════════════════════════
- RED LINE: FLD High (upper boundary)
- BLUE LINE: FLD Low (lower boundary)
- ORANGE LINE: FLD Median (centerline)
- GRAY AREA: Fills between High and Low FLDs
- RIGHT LABEL: Shows FLD identifier and period used (asterisk indicates auto-adjustment)
All lines extend into the future by the calculated offset, creating a "projection zone" ahead of current price.
═══════════════════════════════════════════════════
ACKNOWLEDGMENTS
═══════════════════════════════════════════════════
This work is inspired by the Italian cyclic analysis community and dedicated educators. Due to TradingView's House Rules on promotional content, I cannot mention specific names or groups, but my gratitude goes to those who know they contributed to this development through their teaching and guidance. Thank Emiliano!

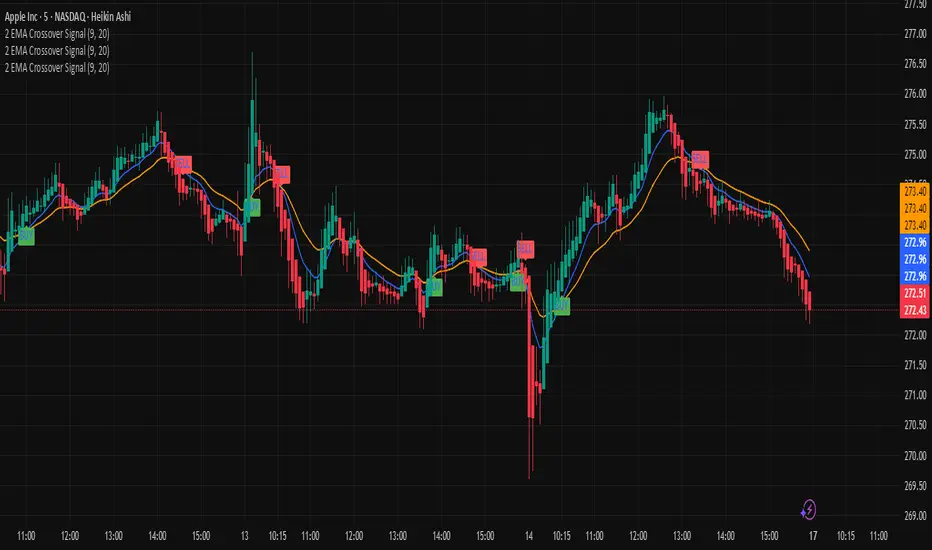
Market Type ClassifierMARKET TYPE CLASSIFIER
Overview
The Market Type Classifier analyzes overnight session behavior to predict daily market character. It classifies each trading day as either TRENDING (bullish or bearish) or CONTRADICTING based on how price interacts with established overnight ranges during specific time windows.
Core Methodology
Time-Based Session Analysis:
The indicator divides the overnight period into fixed and variable phases for both Asia and London sessions.
Asia Session:
Fixed Phase (18:00-19:30 EST): Establishes the initial range high and low - visualized with a customizable gray box
Variable Phase (19:30-02:30 EST): Tests the fixed range to determine direction and validity
London Session:
Fixed Phase (02:30-03:30 EST): Establishes the initial range high and low - visualized with a customizable gray box
Variable Phase (03:30-07:30 EST): Tests the fixed range to determine direction and validity
Direction Logic:
The FIRST break during the variable phase determines the session direction:
Long: First break is above the fixed range high
Short: First break is below the fixed range low
Validity Logic:
Session validity depends on whether price breaks one or both sides:
True Session: Breaks only one side of the fixed range (directional conviction)
False Session: Breaks both sides of the fixed range (lack of conviction)
Visual Components
Fixed Range Boxes:
Light gray shaded boxes mark the high-to-low ranges established during the fixed periods. These boxes help you visualize:
The exact price levels being tested during variable sessions
Where the critical breakout/breakdown levels are located
The size of the overnight consolidation ranges
Box color is fully customizable in settings and can be toggled on/off.
Classification Table:
A compact table displays:
Asia/London Direction (Long/Short) with color coding
Asia/London Session validity (True/False) with color coding
Final Market Type classification
Trading guidance based on classification
Market Type Classification
The indicator combines Asia and London session characteristics into 16 possible combinations, classified as:
Bullish TRENDING (4 combinations) - Green:
Long True + Long True
Long True + Short False
Short False + Short False
Short False + Long True
Bearish TRENDING (4 combinations) - Red:
Short True + Short True
Short True + Long False
Long False + Long False
Long False + Short True
CONTRADICTING (8 combinations) - Orange:
All remaining combinations indicate conflicting overnight behavior
Interpretation & Usage
TRENDING Markets (Green = Bullish, Red = Bearish):
When both overnight sessions show aligned conviction, the daily high/low is often created during overnight hours. The fixed range boxes will show you where these key levels formed. Expect continuation or reversion strategies to work best.
CONTRADICTING Markets (Orange):
When overnight sessions show conflicting signals, expect the daily high/low to be created during Regular Trading Hours (RTH). Opening Range (OR) breakouts and intraday range expansion strategies tend to perform better.
Color Coding System
Direction & Session Rows:
Green text: Bullish combinations (Long True or Short False)
Red text: Bearish combinations (Short True or Long False)
Gray text: N/A or incomplete sessions
Market Type:
Green "TRENDING": Bullish trending day
Red "TRENDING": Bearish trending day
Orange "CONTRADICTING": Contradicting market conditions
Settings & Customization
Table Display:
Position: 9 placement options
Size: Tiny, Small, Normal, or Large
Fixed Range Boxes:
Toggle boxes on/off
Customize box background color and transparency
Boxes automatically appear only during fixed session periods
Unique Features
First-Break Direction: Unlike typical range breakout indicators, this uses the FIRST break to establish directional bias, not the final direction
Dual Session Analysis: Combines both Asia and London sessions for comprehensive overnight market characterization
Validity Framework: The True/False session concept quantifies overnight conviction levels
Visual Range Display: Fixed range boxes show exactly what levels the indicator is monitoring
Daily Reset: Automatically resets at 18:00 EST for the new trading day
Best Practices
Instrument: Designed for NQ (NASDAQ 100 E-mini futures)
Timeframe: Works best on 15-minute charts or lower
Timing: Check the classification before RTH open (09:30 EST)
Integration: Use as a market filter with your existing trading methodology
Strategy: TRENDING days favor overnight high/low holding; CONTRADICTING days favor intraday breakouts
Development Note
This indicator is the result of extensive backtesting on 15+ years of NQ data. The specific time windows and classification combinations have been optimized through historical analysis revealing that markets split nearly 50/50 between Trending (48.92%) and Contradicting (51.08%) conditions, with distinct performance characteristics for each market type.

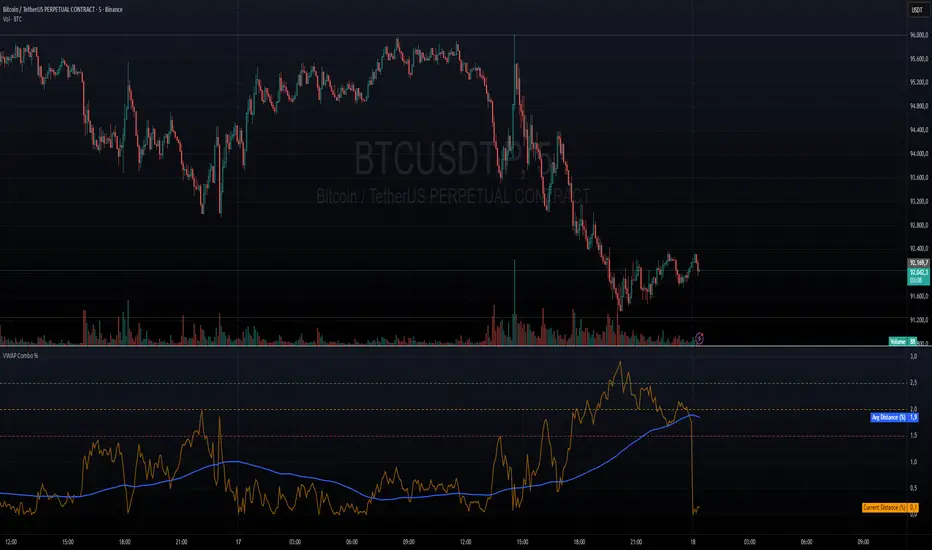
VWAP + VWAP Distance Avg + Alert Lines (%)VWAP Distance & Average Distance Indicator – Detailed Description
The VWAP + VWAP Distance Avg + Alert Lines (%) indicator is designed to measure the distance of the current price from the VWAP (Volume Weighted Average Price), as well as the average distance over a specified period. This tool is particularly useful for traders who use the VWAP as a magnet for price, helping to identify potential trend changes and areas where price may revert toward the VWAP.
Key Features
Current Distance (%)
Calculates the absolute percentage difference between the current price and the VWAP
This line shows how far the price has moved away from the VWAP at any given moment.
Average Distance (%)
Calculates a simple moving average (SMA) of the distance over a specified lookback period.
This provides a reference for typical price deviations from the VWAP, helping traders assess whether the current distance is unusually high or low.
Alert Lines (%)
Allows up to three customizable horizontal alert lines, which can be turned on or off individually.
Each line can be configured with:
Value in percent.
Color.
Line thickness.
These lines serve as visual thresholds, helping traders detect extreme deviations from the VWAP that may precede trend reversals.
Use Case – Detecting Potential Trend Changes
Traders often treat the VWAP as a price magnet, where price tends to revert after significant deviations.
When the current distance exceeds typical average levels or crosses an alert line, it can signal that the price may revert toward the VWAP, potentially indicating a shift in trend or a high-probability mean-reversion scenario.
Disclaimer
This indicator is provided for educational and analytical purposes only. It does not constitute financial advice, and trading decisions are always the sole responsibility of the individual trader. Users should carefully evaluate market conditions and their own risk tolerance before taking any trade.
Better used with VWAP on chart , and be careful around the end of session, for now this works just for session...
still improving on this....
Argentina Price per m² (USD) — (1999–2025)Overview
This indicator plots the historical USD price per square meter of apartments in CABA (Buenos Aires City), Argentina, combining annual data (1999–2011) from Maure Real Estate Market Reports with monthly data (2012–2025) from UCEMA and private market sources.
All values were manually digitized, cleaned, and consolidated to reconstruct the most complete long-term pricing series publicly available.
The script also includes SMA20, SMA50, and SMA100 over the custom dataset to support long-term trend analysis, cycle detection, and macro technical structure.
Data Sources
1999–2011 (Annual): Maure Real Estate Market Reports
2012–2020 (Monthly): UCEMA Real Estate Index
2020–2025 (Monthly): RE/MAX – UCEMA Market Monitor
How to Use This Indicator
This tool allows investors, developers, and analysts to:
Identify multiyear trend shifts
Compare cycles vs. Argentine macro environments
Map long-term support/resistance zones in real estate
Detect early signs of market recovery or contraction
Combine real estate fundamentals with technical analysis
The SMAs help visualize structural trends normally hidden in real estate data.
About This Work
This series was fully reconstructed and coded by engineer Francisco Michelich (@esFranMiche on X), combining market research, statistical consolidation, and technical analysis.
It is intended as an analytical tool, not an official financial index.
If you find this useful, feel free to follow and connect — feedback and collaboration are welcome.
Linkedin
X

IMS 4H Structural Framework (MA / Pivot / MTF Levels)IMS 4H Structural Framework (MA / Pivot / MTF Levels)
✅ SHORT, COMPLIANT DESCRIPTION (Invite-Only Safe)
Description:
This tool visualizes a 4H Institutional Market Structure (IMS) framework by combining three workflow components into a single structural map—MA-based bias shifts, pivot-derived 4H trendlines, and multi-timeframe (1H/45m) structural levels.
It does not generate signals or performance claims.
The framework is designed purely for visual, discretionary analysis of structural flow, risk context, and higher-timeframe alignment.
Core Components:
• 4H Bias Shift (MA): Highlights directional bias transitions.
• 4H Trendlines (Pivot-Based): Shows structural slopes and reaction zones.
• MTF Levels (1H & 45m): Adds micro-structure inside the 4H box for refinement.
• Caution Zones: Marks potential reaction areas near support/resistance or trendlines.
• Dashboard: Displays bias context and educational guidance only.
Intended Use:
For traders who analyze 4H structural flow and wish to visualize bias, context, and multi-timeframe alignment—not for automation or signals.
________________________________________
✅ SHORT, SAFE DISCLAIMER (Invite-Only Approved)
Disclaimer:
This tool is for educational and informational purposes only.
It does not provide trading signals, financial advice, or performance guarantees.
All decisions remain solely with the user.

Wolfe Wave PatternHello All!
For a while now, some of my followers have been asking me to develop Wolfe Wave Pattern . Here it's at your service as open-source and public indicator.
How it works?
- On each bar/tick it checks zigzag waves by using base period and updates the array that is used to keep zigzag levels and locations. Base period in the settings is the minimum zigzag period
- Then it searches if there is new bullish/bearish Wolfe Wave pattern according to last wave direction
- Before searching the pattern it calculates all possible 1234 waves. So any wave in 12345 uses base period or higher. it means that it search all possible candidates. This algorithm is much better than using a few zigzag periods.
- After getting all possible candidates, it checks if any of the found candidates is suitable for Wolfe Wave pattern and keeps them in a matrix
- if there are suitable candidate(s) it shows the latest one and triggers the alert
- it also follows the targets and if the price hits any of the target it extends the line and trigger the alert
- it doesn't check if any of the patterns hits stop-loss.
Options:
Base Period: minimum period to create the zigzag
Error Rate: there are usually so few perfect patterns, so we better consider deviation. if error rate is low than it finds less pattern with more accuracy, if error rate is high than it finds more pattern with less accuracy
- The other options are used for coloring the patterns and lines
Some examples:
P.S. I didn't have enough time to test the indicator, so please drop a comment if you see any issue while using it
Enjoy!

كلاستر
Detailed Description – Fibonacci Cluster Zones + OB + FVG (AR34)
This script is an advanced multi-layer confluence system developed under the AR34 Trading Framework, designed to identify high-accuracy reversal zones, liquidity imbalances, institutional footprints, and trend direction using a unified analytic engine.
It combines Fibonacci mathematics, Smart Money Concepts, market structure, and smart trend signals to produce precise, reliable trading zones.
⸻
🔶 1 — Fibonacci Retracement Zones + Custom Smart Levels
The script calculates the highest and lowest prices over a selected lookback period to generate key Fibonacci retracement levels:
• 0.236
• 0.382
• 0.500
• 0.618
• 0.786
• 1.000
You can also add up to three custom Fibonacci levels (0.66, 0.707, 0.88 or any value you want).
✔ Each level is drawn as a horizontal line
✔ Optional label display for every level
✔ Color and activation fully customizable
These levels help identify pullback zones and potential turning points.
⸻
🔶 2 — True Fibonacci Cluster Detection
The script automatically identifies Cluster Zones, which occur when:
1. A Fibonacci level
2. An Order Block
3. A Fair Value Gap
all overlap in the same price range.
When all three conditions align, the script prints a CLUSTER marker in yellow.
These zones represent:
• High-probability reversal areas
• Strong institutional footprints
• Highly reactive price levels
⸻
🔶 3 — Automatic Order Block (OB) Detection
The indicator detects Order Blocks based on structural candle behavior:
• Bearish candle → followed by bullish
• Price interacts with a Fibonacci level
• Area aligns with institutional order flow
When detected, the OB is marked for easy visualization.
⸻
🔶 4 — Fair Value Gap (FVG) Mapping
The script scans for liquidity imbalances using the classic FVG logic:
• low > high
When an FVG exists, it draws a green liquidity box.
This highlights:
• Gaps left by institutional moves
• High-value return zones
• Efficient price retracement levels
⸻
🔶 5 — Fibonacci Extension Projections
The script calculates extension targets using:
• 1.272
• 1.618
• 2.000
These are drawn as dashed teal lines and help forecast:
• Breakout continuation targets
• Wave extension objectives
• Take-profit areas
⸻
🔶 6 — Smart Trend Signal (EMA-200 Engine)
Trend direction is determined using the EMA 200:
• Price above EMA → uptrend
• Price below EMA → downtrend
A green or red signal icon appears only when the trend flips, reducing noise and improving clarity.
This helps detect:
• Trend shifts early
• Cleaner entries and exits
• Trend-based filtering
⸻
🔶 7 — Four-EMA Multi-Trend System
The indicator includes optional visualization of four moving averages:
• EMA 20 → Short-term
• EMA 50 → Medium-term
• EMA 100 → Long-term
• EMA 200 → Major trend
All are fully customizable (length + color + visibility).
⸻
🔶 8 — Dynamic Negative Fibonacci Levels (Green Only)
When enabled, the script calculates deep retracement zones using:
• –0.23
• –0.75
• –1.20
These negative Fibonacci levels are drawn in green and help identify:
• Deep liquidity capture points
• Hidden structural supports
• Potential reversal bottoms
⸻
🔶 9 — Complete User Control
Users maintain full control over:
✔ Enabling/disabling OB detection
✔ Enabling/disabling FVG detection
✔ Activating custom Fibonacci levels
✔ Showing or hiding labels
✔ Selecting timeframe for Fib calculations
✔ Adjusting moving average parameters
✔ Activating dynamic Fibonacci
The script is designed to be flexible, scalable, and suitable for any trading style.
⸻
🎯 Summary
This indicator is a powerful all-in-one analytical system that merges:
✔ Fibonacci Mathematics
✔ Smart Money Concepts (OB + FVG)
✔ Trend-based filtering
✔ Institutional cluster detection
✔ Dynamic extensions + retracements
✔ Multi-EMA trend mapping
شرح السكربت بالتفصيل – Fibonacci Cluster Zones + OB + FVG (AR34)
هذا السكربت هو نظام تحليل احترافي متكامل من تطوير AR34 Framework يجمع بين أقوى أدوات التداول الحديثة في مؤشر واحد، ويهدف إلى كشف مناطق الانعكاس القوية، والتجميع الذكي، والاتجاه العام، باستخدام مزيج علمي من فيبوناتشي + السيولة + الاتجاه.
يعمل هذا المؤشر بأسلوب Confluence Trading بحيث يدمج عدة مدارس مختلفة في طبقة واحدة لتحديد مناطق الانعكاس والارتداد والاختراق بدقة عالية.
⸻
🔶 1 — مناطق فيبوناتشي (Retracement) + الكلاستر الذكي
يقوم المؤشر بحساب أعلى وأدنى سعر خلال عدد محدد من الشموع (Retracement Length) ثم يرسم مستويات فيبوناتشي الكلاسيكية:
• 0.236
• 0.382
• 0.500
• 0.618
• 0.786
• 1.000
مع إمكانية إضافة 3 مستويات خاصة من اختيارك (0.66 – 0.707 – 0.88 وغيرها).
✔️ كل مستوى يتم رسمه بخط مستقل
✔️ يظهر بجانبه رقم المستوى إذا تم تفعيل خيار Show Fib Labels
✔️ يمكن تغيير لونه، قيمته، وتفعيله حسب رغبتك
⸻
🔶 2 — كاشف الكلاستر الحقيقي (Cluster Detection)
الكلاستر يُعتبر أقوى مناطق الارتداد في التحليل الفني.
السكربت يحدد الكلاستر عندما تتداخل 3 عناصر مع مستوى فيبوناتشي:
1. مستوى فيبوناتشي مهم
2. Order Block
3. Fair Value Gap
إذا اجتمعت الثلاثة في نفس المنطقة، يتم رسمها باللون الأصفر وتظهر كلمة CLUSTER.
هذا يعطيك:
• أقوى منطقة انعكاس
• أعلى دقة في تحديد نقاط الدخول
• مناطق ذات سيولة مرتفعة
⸻
🔶 3 — دمج Order Blocks تلقائياً
يكتشف المؤشر الـ OB الحقيقي باستخدام شروط حركة الشموع:
• bearish candle → bullish candle
• السعر لمس مستوى فيبوناتشي
• منطقة محتملة لتجميع المؤسسات
إذا تحققت الشروط يظهر OB باللون الأحمر.
⸻
🔶 4 — دمج Fair Value Gaps (FVG)
يكتشف الفجوات السعرية بين الشمعتين الأولى والثالثة:
• low > high
ويقوم برسم بوكس أخضر حول الفجوة (FVG Zone).
يساعدك على معرفة:
• مناطق اختلال السيولة
• أهداف السعر القادمة
• مناطق “العودة” المحتملة
⸻
🔶 5 — امتدادات فيبوناتشي (Fibonacci Extensions)
يقوم بحساب الامتدادات من مستويات:
• 1.272
• 1.618
• 2.0
ويظهرها بخطوط متقطعة (Teal Color).
هذه المستويات مهمة لتوقع:
• أهداف اختراق
• مناطق TP
• امتداد موجات السعر
⸻
🔶 6 — إشارة الاتجاه الذكية (Smart Trend Engine – EMA200)
يعتمد على EMA 200 لتحديد الاتجاه العام:
• إذا السعر فوق EMA200 → اتجاه صاعد
• إذا السعر تحت EMA200 → اتجاه هابط
ويظهر المؤشر:
🟢 سهم أخضر عند تحول الاتجاه لصعود
🔴 سهم أحمر عند تحول الاتجاه لهبوط
ميزة التحول فقط عند تغيير الاتجاه (No Noise).
⸻
🔶 7 — أربع موفنقات احترافية (EMA 20 – 50 – 100 – 200)
المؤشر يعرض الموفنقات الأربعة الأساسية:
• EMA 20 → اتجاه قصير
• EMA 50 → متوسط
• EMA 100 → طويل
• EMA 200 → الاتجاه الرئيسي
مع إمكانية:
• تغيير اللون
• تغيير الطول
• إخفائها وإظهارها
⸻
🔶 8 — فيبوناتشي الديناميكي (Dynamic Green Fib)
ميزة قوية جداً تظهر فقط عند تفعيلها.
تحسب أعلى وأدنى سعر في Lookback Period ثم ترسم مستويات سلبية:
• –0.23
• –0.75
• –1.20
هذه المستويات تظهر كخطوط خضراء تحت السعر وتستخدم لـ:
• تحديد مناطق الانعكاس المخفية
• رصد الدعم الديناميكي
• اكتشاف القيعان المحتملة
⸻
🔶 9 — المرونة الكاملة للمستخدم
المؤشر يسمح لك التحكم بكل شيء:
✔️ تفعيل/إلغاء الـ OB
✔️ تفعيل/إلغاء الـ FVG
✔️ تفعيل/إلغاء مستويات فيبوناتشي
✔️ إضافة مستويات مخصصة
✔️ اختيار الفريم المستخدم
✔️ تغيير الألوان
✔️ التحكم في الاتجاه والموفنقات
⸻
🎯 الخلاصة
هذا السكربت يعمل كنظام تحليلي متكامل يجمع:
✔️ فيبوناتشي
✔️ السيولة المؤسسية (OB + FVG)
✔️ الاتجاه الذكي
✔️ الكلاستر الاحترافي
✔️ الموفنقات
✔️ فيبوناتشي الديناميكي

Range Oscillator with Alerts (Anson)Range Oscillator with Alerts (Anson)
From Range Oscillator (Zeiierman)
I made a little change and added an alert function.
The oscillator maps market movement as a heat zone, highlighting when the price approaches the upper or lower range boundaries and signaling potential breakout or mean-reversion conditions. Instead of relying on traditional overbought/oversold thresholds, it uses adaptive range detection and heatmap coloring to reveal where price is trading within a volatility-adjusted band.

Daily ATR vs Move (black & white) + PipsTop of Chart, Mid. Gives the user an idea of what trend is doing and how the current price compares to daily ATR.
Used on this example below to indicate we are within the bottom range for the day, and price has potential to move up without worry of exhaustion.

Bullish/Bearish Divergence DetectorUsuable on all time-frames
Indicates multiple divergences (up to 3) with the same start point/date of the divergence

20 Day Range High/Low (Turtle Soup)This indicator identifies the Highest High and Lowest Low of the last 20 periods (customizable) and projects horizontal support/resistance lines to the right.
Unlike standard Donchian Channels or other High/Low indicators that clutter the chart with historical "steps" or extend lines infinitely to the left, this script focuses on chart cleanliness.
Key Features:
Pivot-Point Start: The lines do not span the whole chart. They start exactly at the candle where the High or Low occurred.
Right Extension: Lines extend only to the future, providing a clear visual for potential breakouts or support levels.
No Historical Clutter: It does not draw the past movement of the High/Low, keeping your chart clean for price action analysis.
Dynamic: As new Highs or Lows are made, the lines instantly update to the new positions.
How to Use:
Trend Identification: Use the High line as a resistance/breakout level (similar to Turtle Trading strategies).
Stop Loss Placement: The Low line of the last 20 days often acts as a trailing stop location for long-term trends.
Timeframes: While designed for the classic "20-Day" lookback on the Daily chart, this script works on any timeframe (e.g., finding the 20-hour range on a 1H chart).
Settings:
Length: Default is 20 bars. You can change this in the settings to any lookback period you prefer (e.g., 50, 100).

DeltaFlow Matrix═════════════════─────────
DELTAFLOW MATRIX - COMPLETE GUIDE
For 1-Minute Scalping
═════════════════─────────
───────────────────────────────────────
📊 VISUAL ELEMENTS EXPLAINED (What You See on the Chart)
───────────────────────────────────────
🟦🟥 RED/GREEN BARS ON THE RIGHT = Delta Flow Direction
The horizontal bars extending right from your chart show WHO controlled the price at each level. Green = bulls won, Red = bears won. Longer bars = more volume traded at that price. Example: If BTC is at $100,000 and you see a massive green bar, that means buyers aggressively absorbed all sell orders at that exact price level.
📊 GRADIENT BACKGROUND (Heat Map) = Volume Intensity
The colored background behind the bars shows volume concentration. Darker/more opaque = heavy trading, lighter/transparent = light trading. Example: A dark background at $99,800 means that's where most traders are positioned - it's a "magnet price" where BTC keeps returning.
🟩 GREEN BOX WITH BORDER = POC (Point of Control)
This is THE most important price on your chart - where the absolute highest volume traded. This is where the majority of traders are stuck. Example: POC at $99,950 means most BTC holders bought/sold there. Price will be magnetically pulled back to test this level repeatedly.
⬜ WHITE DOTTED LINES = VA High and VA Low (Value Area)
These lines contain 70% of all trading volume. Think of them as "fair price boundaries." Example: VA High at $100,200, VA Low at $99,700 means BTC's "fair value range" is $99,700-$100,200. Breakouts above/below these lines are significant moves.
💜 MAGENTA BORDER ON BARS = MICRO-SR (Micro Support/Resistance)
These magenta-outlined bars mark high-frequency support/resistance zones where price repeatedly bounced. These are your scalping zones. Example: MICRO-SR at $99,975 means BTC touched this price multiple times in the last 100 bars - it's a critical battle line for 1-minute scalpers.
🟡 GOLD TEXT "BULL EXHAUST" / "BEAR EXHAUST" = Exhaustion Zones
When one side dominated the volume BUT the trend is dying. This is where the big money got tired. Example: "BULL EXHAUST" at $100,100 means buyers pushed hard but are running out of steam - expect a reversal or consolidation soon.
🔵 CYAN TEXT "FLOW SHIFT ↑" / "FLOW SHIFT ↓" = Institutional Reversal
This is the holy grail - when delta completely flipped from bearish to bullish (or vice versa) with increasing volume. This marks where institutions changed their position. Example: "FLOW SHIFT ↑" at $99,900 means selling pressure just turned into aggressive buying - the big players reversed direction.
🟠 ORANGE TEXT "FAILED SHIFT ↑" / "FAILED SHIFT ↓" = Failed Institutional Reversal
When a FLOW SHIFT appears but then gets rejected by the opposite side within 3-10 bars. This means institutions TRIED to reverse but couldn't - the other side is defending hard. Example: "FAILED SHIFT ↑" at $99,900 means bulls attempted to take control but bears defended and stopped the reversal - this is a bearish sign, price likely continues down.
🟢 GREEN "COILED" LABEL BELOW PRICE = Bullish Compression Setup
When price is compressed below VA Low with 5+ MICRO-SR resistance levels stacked overhead AND bullish momentum is building. This is a spring-loaded long setup - price is coiled under resistance ready to explode upward. Example: BTC at $99,700, VA Low at $100,000, 7 MICRO-SR levels stacked from $100,100-$100,400, and delta shows +45 with bullish flow → "COILED" appears. This means price is compressed like a spring with bullish pressure building - when it breaks, it will rip through all those overhead levels fast.
🔴 RED "COILED" LABEL ABOVE PRICE = Bearish Compression Setup
When price is extended above VA High with 5+ MICRO-SR support levels stacked below AND bearish momentum is building. This is a spring-loaded short setup - price is coiled above support ready to crash downward. Example: BTC at $100,500, VA High at $100,200, 6 MICRO-SR levels stacked from $100,000-$99,700, and delta shows -52 with bearish flow → "COILED" appears. This means price is compressed with bearish pressure building - when it breaks down, it will slice through all those support levels.
🔴🟢 "REJECT" LABEL = Failed Breakout / Rejection
When price enters a cluster zone (resistance or support) but shows opposite momentum - the breakout attempt failed. Example: Price pushed up into overhead resistance at $100,200 but delta turns bearish (-38) → "REJECT" appears in red above price. This means the breakout attempt was rejected, bulls who entered are trapped, expect reversal down.
⚠️ "WALL ↑" / "WALL ↓" = Resistance/Support Wall Alert
When 5+ MICRO-SR levels are stacked together creating a "wall" of resistance or support. These are significant barriers where price will likely stall or reverse. Example: "WALL ↑ 7x" means there are 7 MICRO-SR resistance levels stacked above current price - breaking through this will be very difficult without strong momentum and volume.
🔴🟢 "BULL ATTACK" / "BEAR ATTACK" = Aggressive Momentum
One side is attacking with both high delta AND increasing volume. This is active warfare. Example: "BEAR ATTACK" at $100,050 means sellers are aggressively dumping with rising volume - price is likely to drop fast.
🛡️ "BULL DEFENSE" / "BEAR DEFENSE" = Holding the Line
One side has high delta but volume is flat or decreasing - they're defending a level, not pushing. Example: "BULL DEFENSE" at $99,850 means buyers are absorbing sells to prevent BTC from dropping further, but they're not strong enough to push up yet.
⚖️ "EQUILIBRIUM" / "ROTATION" = Balanced Market
Bulls and bears are equally matched - perfect for range trading, terrible for breakout trades. Example: "EQUILIBRIUM" at $100,000 means the market is perfectly balanced here - trade the range, don't chase breakouts.
📈📉 "UP" / "DN" ARROWS = Volume Trend
Small green "UP" or red "DN" labels show if volume is increasing or decreasing at that price level over time. Example: "UP" at $99,900 means more traders are entering positions at this price compared to earlier - this level is becoming more important.
⇈⇊ DOUBLE ARROWS = Delta Momentum Acceleration
These show when delta is accelerating rapidly - not just strong, but GETTING STRONGER. Example: ⇈ at $100,050 means bullish delta isn't just high, it's accelerating - expect explosive upward movement.
🟢🔴 VELOCITY BANDS (Horizontal bars far right) = Volume Acceleration
Thin horizontal bars extending from the profile show how fast volume is building. Green = volume accelerating up, Red = volume accelerating down. Example: Green velocity band at $100,100 means volume is spiking at this level right now - action is heating up.
💜 "x3.8" LABEL ABOVE CANDLE = Volume Spike Signal
Magenta text showing volume multiplier. Example: "x3.2" above a BTC candle means this candle had 3.2 times the average volume - something big just happened (news, liquidation cascade, whale entry).
🟢🔴 THICK LINE AT VA HIGH/LOW = Breakout with Momentum
When BTC breaks the VA line, the line changes:
- Thin line (width 2) = Weak breakout (<30Δ momentum)
- Medium line (width 3) = Medium breakout (30-60Δ)
- Thick dashed line (width 4) = STRONG breakout (>60Δ) - THIS IS THE FLASH
The label also changes: "VA High 72Δ V✓ STRONG" = 72 delta momentum, volume confirmed, strong breakout.
🔵 CYAN DASHED LINE AT POC = POC Bounce Flash
A short cyan dashed line appears when BTC bounces off the POC with a bullish reversal candle. This is your highest-probability long entry - the POC "magnet" just pulled price back and bulls are responding.
───────────────────────────────────────────────
🧠 PATTERN COMBINATIONS = Market Psychology (What Traders Are Thinking)
───────────────────────────────────────────────
🚀 PATTERN 1: "The Nitro Boost" (Highest Win Rate)
WHAT YOU SEE: FLOW SHIFT ↑ appears below current price + only MICRO-SR (magenta) levels above + Volume Spike (x2.5+)
PSYCHOLOGY: Big money just reversed from selling to buying. Retail still thinks it's going down. All the nearby resistance levels are weak (just micro-levels). The explosion in volume means someone BIG just entered.
EXAMPLE: BTC at $99,900, FLOW SHIFT ↑ just appeared, above you see MICRO-SR at $100,000, $100,050, $100,100 with no major resistance. Volume spike shows x3.1. → Institutions flipped bullish and the path of least resistance is UP. These MICRO-SR levels will be blown through like paper.
TRADE: Long immediately, targets at each MICRO-SR level, stop below the FLOW SHIFT price.
💎 PATTERN 2: "The Wall" (Reversal Setup)
WHAT YOU SEE: BULL/BEAR EXHAUST at a price level + Price approaching POC from above/below + Delta momentum arrows (⇊) pointing opposite to price movement
PSYCHOLOGY: One side pushed too hard and ran out of gas right as they're approaching the most important price level (POC). Delta momentum is reversing. The "wall" of volume at POC will reject them.
EXAMPLE: BTC pushed from $99,800 to $100,200, now "BULL EXHAUST" appears at $100,200. POC is at $100,000. You see ⇊ (bearish delta acceleration). → Bulls exhausted themselves pushing up, POC will act as resistance, bears are accelerating. Price will get rejected back down.
TRADE: Short at current price, target is POC at $100,000, stop above the exhaust level.
⚔️ PATTERN 3: "The War Zone" (Stay Out)
WHAT YOU SEE: BULL ATTACK and BEAR ATTACK labels alternating rapidly + EQUILIBRIUM or ROTATION at current price + VA lines very close together
PSYCHOLOGY: Bulls and bears are in full battle mode, neither side is winning. The market is chopping violently in a tight range. This is where retail gets destroyed by whipsaw.
EXAMPLE: BTC bouncing between $99,900-$100,100. "BULL ATTACK" at $100,000, "BEAR ATTACK" at $100,050, "EQUILIBRIUM" at $100,025. VA High at $100,100, VA Low at $99,900. → Pure chaos. Both sides throwing punches, nobody winning.
TRADE: STAY OUT. Wait for exhaustion or flow shift. If you must trade, use very tight ranges (buy at VA Low, sell at VA High, 5-tick stops).
🎯 PATTERN 4: "The Breakout Confirmation" (High Confidence)
WHAT YOU SEE: VA breakout with STRONG label + Volume spike (x2.0+) + FLOW SHIFT in breakout direction + No major resistance for 50+ ticks
PSYCHOLOGY: Every signal is aligned. Price broke the fair value range WITH strong momentum, WITH volume confirmation, WITH institutional flow reversal. This is the "perfect storm" breakout.
EXAMPLE: BTC breaks VA High at $100,200. Label changes to "VA High 68Δ V✓ STRONG" (thick dashed line). Volume spike shows x2.8. FLOW SHIFT ↑ appears at $100,210. Next resistance is MICRO-SR at $100,400. → This is as good as it gets. Institutions are buying, retail FOMO is coming, momentum is strong.
TRADE: Long on the breakout, targets at +100 ticks ($100,300), +200 ticks ($100,400), trail stop below the breakout candle.
🛡️ PATTERN 5: "The Failed Breakout" (Fade Setup)
WHAT YOU SEE: VA breakout with WEAK label + No volume spike + DEFENSE label appears (opposite side) + Delta momentum arrows pointing back into VA
PSYCHOLOGY: Price tried to break out but without conviction. No volume = no big players interested. The defending side is holding the line. Breakout traders are about to get trapped.
EXAMPLE: BTC breaks VA High at $100,200. Label shows "VA High 23Δ WEAK" (thin line). No volume spike. "BEAR DEFENSE" appears at $100,220. You see ⇊ (bearish acceleration). → Weak breakout, bears defending, momentum reversing. Bull breakout traders are trapped.
TRADE: Short the failed breakout, target is back inside VA (POC at $100,000), stop above the high.
🧲 PATTERN 6: "The POC Magnet" (Mean Reversion)
WHAT YOU SEE: Price far from POC (100+ ticks away) + Volume decreasing (DN arrows) + No ATTACK or FLOW SHIFT labels + MICRO-SR levels between current price and POC
PSYCHOLOGY: Price overextended from the most important level. No new aggressive volume is coming in. Market is tired. Like a rubber band, price will snap back to POC where most traders are positioned.
EXAMPLE: BTC at $100,350, POC at $100,000 (350 ticks away). "DN" arrows showing volume declining. "ROTATION" at current price. MICRO-SR at $100,300, $100,200, $100,100. → Overextended, running out of steam, POC will pull it back.
TRADE: Short with targets at each MICRO-SR level on the way down to POC, final target at POC itself.
💥 PATTERN 7: "The Liquidation Cascade" (Momentum Continuation)
WHAT YOU SEE: Multiple consecutive candles with volume spikes (x2.5+) + ATTACK label same direction + Delta momentum arrows same direction (⇈ or ⇊) + Breaking through MICRO-SR levels without stopping
PSYCHOLOGY: Liquidations are triggering more liquidations. Stop losses are getting hit, triggering more stop losses. This is a cascade - it won't stop until hitting POC or VA boundary. Retail is getting destroyed, institutions are feasting.
EXAMPLE: BTC drops from $100,200. Candles show x2.7, x3.1, x2.9 volume spikes. "BEAR ATTACK" at every level. ⇊ arrows accelerating. MICRO-SR levels at $100,100, $100,000, $99,900 all getting destroyed. POC at $99,750. → Liquidation cascade in progress. Won't stop until POC.
TRADE: If you're in the direction, hold until POC. If not in, wait for POC to enter counter-trend. DO NOT try to catch this knife early.
🔄 PATTERN 8: "The Reversal Confirmation" (Highest Probability Entry)
WHAT YOU SEE: POC Bounce Flash (cyan dashed line) + FLOW SHIFT in new direction + Volume spike + Price bouncing off POC with bullish/bearish engulfing candle
PSYCHOLOGY: Price hit the most important level (POC) and institutions just reversed direction. This is THE signal. The magnet worked, price came back to POC, and big money is now pushing it the other way.
EXAMPLE: BTC drops to POC at $100,000. Cyan dashed POC bounce flash appears. Bullish engulfing candle. "FLOW SHIFT ↑" appears. Volume spike x2.6. → Perfect reversal setup at the most important price level with institutional confirmation.
TRADE: Long at POC, target next MICRO-SR or VA High, stop below POC. This is your highest win-rate setup.
🎪 PATTERN 9: "The Fake-Out Trap" (Avoid or Fade)
WHAT YOU SEE: FLOW SHIFT appears + No volume spike + EXHAUST label appears within 3-5 candles same direction + Delta momentum arrows reverse
PSYCHOLOGY: Someone tried to fake a reversal (maybe a whale painting the tape) but there's no real follow-through. The move exhausted immediately. Traders who followed the FLOW SHIFT are about to get trapped.
EXAMPLE: "FLOW SHIFT ↑" appears at $99,950. No volume spike. Within 3 candles, "BULL EXHAUST" appears at $100,000. ⇊ arrows appear. → False reversal, trap set, traders entering longs are getting baited.
TRADE: Fade it. Short when exhaust appears, target back below the fake FLOW SHIFT level.
🏆 PATTERN 10: "The Perfect Storm Long" (All Systems Go)
WHAT YOU SEE: Price above POC + FLOW SHIFT ↑ + VA Low breakout with STRONG + Volume spike + Only MICRO-SR resistance above + BULL ATTACK label + ⇈ acceleration
PSYCHOLOGY: Everything aligned bullish. Institutions buying, momentum strong, volume confirming, path clear. This is when retail FOMO kicks in and you get the biggest moves.
EXAMPLE: BTC at $100,100. POC at $100,000 (above POC ✓). "FLOW SHIFT ↑" at $100,050 ✓. "VA Low 71Δ V✓ STRONG" breakout ✓. Volume x3.4 ✓. MICRO-SR at $100,300, $100,500 (weak resistance) ✓. "BULL ATTACK" ✓. ⇈ arrows ✓. → Every single bullish signal firing. This is the setup you wait for all day.
TRADE: Long with size, targets at +200 ticks minimum, trail aggressively, stop only if FLOW SHIFT reverses.
🎯 PATTERN 11: "The Coiled Spring" (High Probability Breakout)
WHAT YOU SEE: "COILED" label appears + 5-8 MICRO-SR levels stacked in breakout direction + Delta +30 or higher (for long) / -30 or lower (for short) + Price compressed below VA Low (long) or above VA High (short)
PSYCHOLOGY: Price is compressed in a weak position with heavy resistance/support overhead, BUT institutions are building momentum in the direction of the breakout. When it breaks, all those clustered MICRO-SR levels will be blown through rapidly because the spring is loaded. This is the setup where you get 100-200 tick moves in minutes.
EXAMPLE: BTC at $99,650. VA Low at $100,000. "COILED" (green) appears below price. WALL ↑ 8x showing 8 MICRO-SR levels from $100,100-$100,800. Delta shows +47. FLOW SHIFT ↑ just appeared. → Price is coiled below massive resistance wall with strong bullish momentum building. When VA Low breaks, the spring releases and price will rip through all 8 resistance levels.
TRADE: Long when price breaks VA Low with volume confirmation, targets at each MICRO-SR cluster (+100, +200, +300 ticks), trail stop below breakout candle. This is your "moonshot" setup.
🛑 PATTERN 12: "The Failed Shift Trap" (Fade Setup)
WHAT YOU SEE: "FAILED SHIFT ↑" or "FAILED SHIFT ↓" appears + Strong opposite momentum (⇊ for failed bull shift, ⇈ for failed bear shift) + No volume spike + Price back in original range
PSYCHOLOGY: Institutions attempted a reversal but the other side defended hard and rejected it. Traders who followed the FLOW SHIFT are now trapped. The failed reversal confirms the original trend will continue - the defending side is in control.
EXAMPLE: BTC pushed from $100,200 to $99,900. "FLOW SHIFT ↓" appeared at $100,100 signaling bearish reversal. Within 5 bars, bulls defended at $99,850, pushing price back to $100,000. "FAILED SHIFT ↓" now appears at $100,100 with ⇈ (bullish acceleration). → Bears tried to reverse trend but failed. Bulls defended successfully. Original uptrend continues.
TRADE: Fade the failed shift. If "FAILED SHIFT ↓" appears, go long (bulls won the battle). If "FAILED SHIFT ↑" appears, go short (bears won). Target is back to the other side of the range.
⚠️ PATTERN 13: "The Wall Collision" (High Risk, High Reward)
WHAT YOU SEE: "WALL ↑" or "WALL ↓" with 6+ levels + Price approaching wall with strong momentum (ATTACK label) + Volume spike + Delta accelerating (⇈ or ⇊)
PSYCHOLOGY: Unstoppable force meeting immovable object. Price is charging at a massive wall of resistance/support with strong momentum. Either it breaks through explosively OR it gets rejected violently. This is binary - huge win or huge loss.
EXAMPLE: BTC at $100,050 with "BULL ATTACK" and ⇈ arrows. Volume x3.2. Approaching "WALL ↑ 9x" at $100,200-$100,600. POC at $100,300 (inside the wall). → Bulls charging at massive resistance wall with strong momentum. If they break through, it's explosive. If rejected, crash back down.
TRADE: ADVANCED ONLY. Wait for the collision. If price breaks through wall with FLOW SHIFT confirmation + volume spike, go long immediately with tight stop. If price gets REJECTED (bearish delta appears at wall), short immediately targeting POC. DO NOT enter before knowing the outcome.
🔄 PATTERN 14: "The Rejection Reversal" (Counter-Trend Entry)
WHAT YOU SEE: "REJECT" label appears + Price in cluster zone + Opposite side DEFENSE or ATTACK label appears + Delta momentum reverses (⇈ to ⇊ or vice versa)
PSYCHOLOGY: The breakout failed, trapped traders are exiting, and the opposite side is now attacking the weak hands. This creates fast moves back in the original direction.
EXAMPLE: BTC breaks VA High to $100,250. Weak volume, delta only +22. Enters overhead MICRO-SR cluster. "REJECT" appears in red. "BEAR DEFENSE" appears at $100,280. ⇊ arrows appear. → Breakout failed, bulls trapped, bears attacking. Price will reverse fast.
TRADE: Counter-trend entry in direction of REJECT. Short when "REJECT" appears with bearish confirmation, target is back to POC or VA Low. Stop above the rejection high. Fast scalp.
───────────────────────────────────────────────────────────────────────────────
⚡ QUICK REFERENCE CHEAT SHEET
───────────────────────────────────────────────────────────────────────────────
SAFEST ENTRIES (Highest Win Rate):
✅ POC Bounce Flash + FLOW SHIFT (Pattern 8)
✅ FLOW SHIFT + Only MICRO-SR above + Volume Spike (Pattern 1)
✅ Strong VA Breakout + Volume Spike + FLOW SHIFT (Pattern 4)
✅ COILED label + Multiple stacked MICRO-SR + Delta >30 (Pattern 11)
DANGER ZONES (Stay Out):
⛔ BULL ATTACK + BEAR ATTACK alternating (Pattern 3)
⛔ FLOW SHIFT + No volume + Quick exhaust (Pattern 9)
⛔ EQUILIBRIUM at current price with tight VA range
⛔ WALL collision without clear direction (Pattern 13 - wait for outcome)
FADE/REVERSAL SETUPS:
🔄 EXHAUST at price level + Approaching POC (Pattern 2)
🔄 Weak VA Breakout + DEFENSE opposite side (Pattern 5)
🔄 Price far from POC + Volume declining (Pattern 6)
🔄 FAILED SHIFT appears + Opposite momentum (Pattern 12)
🔄 REJECT label + Opposite ATTACK/DEFENSE (Pattern 14)
HOLD/MOMENTUM CONTINUATION:
🚀 Multiple volume spikes + ATTACK label + ⇈/⇊ arrows (Pattern 7)
🚀 All bullish/bearish signals aligned (Pattern 10)
🚀 COILED spring release through wall (Pattern 11)
═══════════════════════════════════════════════════════════
Remember: The indicator shows you WHERE the big money is (POC), WHAT they're doing (FLOW SHIFT), and HOW HARD they're doing it (volume spikes, momentum). Your job is to follow the big money, not fight them. When institutions shift, you shift. When they exhaust, you fade. When they're in a war, you stay out. Trade with the whales, not against them.
════════════════════════════════════════════════════════════
═══════════════════════════════════════════════════════════════════════════════
ENHANCED DELTA VOLUME PROFILE - TECHNICAL CALCULATIONS GUIDE
How Each Element is Actually Calculated
═══════════════════════════════════════════════════════════════════════════════
───────────────────────────────────────────────────────────────────────────────
🧮 CORE CALCULATIONS (The Math Behind What You See)
───────────────────────────────────────────────────────────────────────────────
📊 VOLUME BINS = Price range divided into 40 horizontal slices
The indicator takes the last 100 candles (configurable), finds the highest and lowest price touched, then divides that range into 40 equal "bins" (horizontal price levels). Each bin collects volume from candles that touched that price range. Example: BTC ranged from $99,500 to $100,500 in the last 100 bars. That's $1,000 range ÷ 40 bins = $25 per bin. Bin 1 = $99,500-$99,525, Bin 2 = $99,525-$99,550, etc.
🟦🟥 DELTA CALCULATION = (Bull Volume - Bear Volume) / Total Volume × 100
For each bin, the indicator separates bullish candles (close > open) from bearish candles (close < open). Delta = ((bull volume - bear volume) / total volume) × 100. This gives you a percentage from -100% (pure selling) to +100% (pure buying). Example: At $100,000, if 70 BTC was traded on green candles and 30 BTC on red candles, delta = ((70-30)/100) × 100 = 40% bullish.
🎨 GRADIENT COLOR = Delta converted to color spectrum
The delta percentage (-100 to +100) is mapped to a color gradient. -100% = pure bearish color (orange/red), 0% = neutral, +100% = pure bullish color (cyan/blue). The color you see on each bar directly represents the delta. Example: A bright cyan bar = high positive delta (strong buying), orange bar = high negative delta (strong selling), gray bar = balanced (delta near 0%).
🟩 POC (Point of Control) = Bin with the absolute highest total volume
The indicator sums up all volume in each of the 40 bins, then finds which bin has the most. That's your POC. Example: Bin 15 (around $100,000) collected 1,250 BTC of volume, which is more than any other bin. Bin 15 is your POC. This is where the most trading happened and where most traders are positioned.
⬜ VALUE AREA (VA) = The bins containing 70% of total volume, centered on POC
Starting from the POC, the indicator expands up and down, adding bins one at a time (choosing the bin with more volume each time) until it has captured 70% of all volume. The top of this range = VA High, bottom = VA Low. Example: POC at $100,000. Expanding out captures 70% of volume from $99,700 to $100,300. VA Low = $99,700, VA High = $100,300.
📈📉 VOLUME TREND = (Recent Volume - Old Volume) / Total Volume
The indicator splits your 100-bar lookback into three periods: Recent (last 15 bars), Mid (bars 15-30), and Older (last 15 bars of the 100). For each bin, it compares recent volume to older volume. If recent > older, trend is UP. If recent < older, trend is DOWN. Example: At $100,000, recent 15 bars had 80 BTC volume, older 15 bars had 40 BTC. Trend = (80-40)/(80+40) = 0.33 = UP. This shows volume is increasing at this level.
💜 MICRO-SR DETECTION = High volume (>60% of max) + High hits (>20% of max) + Active volume trend
A bin becomes MICRO-SR if: (1) Its volume is at least 60% of the highest-volume bin, (2) Price touched it frequently (at least 20% as many times as the most-touched bin), (3) Volume trend isn't flat (absolute trend > 0.05). Example: Bin at $99,975 has 750 BTC (75% of max), was hit 45 times (30% of max hits), volume trend = 0.08. = MICRO-SR (magenta border).
🟡 EXHAUSTION DETECTION = Extreme delta (>65%) + Declining volume trend (<-0.15) OR Extreme delta + Volume spike (>1.5× average)
Two ways to detect exhaustion: (1) One side dominated (delta > 65% or < -65%) BUT volume is decreasing (trend < -0.15), meaning participation is dropping. (2) Extreme delta WITH a huge volume spike (>1.5× average for that bin), meaning climactic volume. Example: At $100,200, delta = 72% bullish, but volume trend = -0.22 (declining). = BULL EXHAUST. Bulls won but are running out of steam.
🔵 FLOW SHIFT DETECTION = Delta changed sign (+ to - or - to +) + Delta change >40% + Volume trend increasing (>0.1)
Compares each bin's delta to the previous bin's delta. If delta flipped from negative to positive (or vice versa) by more than 40%, AND volume is increasing, = FLOW SHIFT. Example: Previous bin at $99,950 had -35% delta (bearish). Current bin at $100,000 has +45% delta (bullish). Change = 80% (flipped + exceeded 40%), volume trend = +0.15. = FLOW SHIFT ↑.
⇈⇊ DELTA MOMENTUM = Current delta - Average delta of last 3 bins
For each bin, the indicator looks at the previous 3 bins, calculates their average delta, then compares current delta to that average. If current delta is significantly higher/lower than the 3-bin average, momentum arrows appear. Example: Last 3 bins had deltas of 20%, 25%, 30% (average = 25%). Current bin delta = 55%. Momentum = 55 - 25 = +30 = ⇈ (strong bullish acceleration).
🟢🔴 VOLUME ACCELERATION = Rate of change of volume trend across three periods
Compares how volume changed from Old→Mid vs Mid→Recent. If Recent increased MORE than Mid did compared to Old, = positive acceleration. Formula: ((Recent-Mid) - (Mid-Old)) / |Mid-Old|. Example: Old=100, Mid=120, Recent=160. Mid increased by 20, Recent increased by 40. Acceleration = (40-20)/20 = 1.0 = strong acceleration (green velocity band).
⚖️ BALANCE SCORE = Combines volume balance, price range balance, and hit frequency
Three factors weighted equally: (1) How balanced is bull vs bear volume? (1 - |bull-bear|/total). (2) How tight is the price range? (1 - avgRange/maxRange). (3) How frequently was it hit? (hits/maxHits). Multiply these together. Score >0.7 = EQUILIBRIUM. Example: Volume is 55% bull / 45% bear = 0.9 balance. Range is tight = 0.8. Hit frequently = 0.85. Score = 0.9 × 0.8 × 0.85 = 0.61 = ROTATION.
📊 BULL/BEAR ATTACK/DEFENSE = Delta threshold (>60% or <-60%) + Volume trend direction
ATTACK = High delta (>60% either direction) + Volume trend increasing (>0.15). DEFENSE = High delta (>60% either direction) + Volume trend NOT increasing (≤0.15). Example: Delta = 68% bullish, volume trend = 0.22 = BULL ATTACK (buying with increasing volume). Delta = 68% bullish, volume trend = 0.05 = BULL DEFENSE (buying but volume not increasing).
───────────────────────────────────────────────────────────────────────────────
🎯 SIGNAL CALCULATIONS (The New Features)
───────────────────────────────────────────────────────────────────────────────
💜 VOLUME SPIKE = Current bar volume / 20-bar average volume
Takes the current candle's volume and divides it by the simple moving average of the last 20 candles' volume. If ratio >2.0 (configurable), spike detected. The label shows the exact multiplier. Example: Current candle = 450 BTC volume. 20-bar average = 140 BTC. Ratio = 450/140 = 3.21 = "x3.2" label appears in magenta above the candle.
🟢🔴 VA BREAKOUT MOMENTUM = POC bin's delta (absolute value)
When price breaks VA High or VA Low, the indicator looks at the POC bin's delta to measure momentum strength. Uses absolute value (ignore direction). <30 = WEAK, 30-60 = MED, >60 = STRONG. Line thickness and style change based on this. Example: BTC breaks VA High. POC bin delta = 72%. Momentum = 72 = STRONG. Line = width 4 (thick), dashed (flash effect), label shows "VA High 72Δ V✓ STRONG".
📊 BREAKOUT LINE THICKNESS = Momentum-based dynamic sizing
- Momentum <30: Line width = 2 (thin), solid line
- Momentum 30-60: Line width = 3 (medium), solid line
- Momentum >60: Line width = 4 (thick), dashed line (creates flash effect)
Example: Breakout with 45% momentum = width 3 solid line. Breakout with 75% momentum = width 4 dashed line (flashing).
✓ VOLUME CONFIRMATION = Current volume / 20-bar average >1.5
Checks if the breakout candle has strong volume. If current volume is at least 1.5× the 20-bar average, adds "V✓" to the label. Example: Breakout candle has 280 BTC volume, 20-bar average is 160 BTC. Ratio = 280/160 = 1.75 > 1.5 = "V✓" appears in label.
🔵 POC BOUNCE DETECTION = Price within 0.5 bin-step of POC + Bullish reversal candle + Previous candle was bearish
Three conditions must all be true: (1) Current close price is within half a bin's height from POC price. (2) Current candle is bullish (close > open). (3) Previous candle was bearish (close < open). If all true = POC bounce, cyan dashed flash line appears. Example: POC at $100,000, bin step = $25. Current close = $100,008 (within $12.50 of POC ✓). Current candle green ✓. Previous candle red ✓. = POC Bounce Flash.
───────────────────────────────────────────────────────────────────────────────
⚙️ TECHNICAL PARAMETERS (What You Can Adjust)
───────────────────────────────────────────────────────────────────────────────
🔢 LOOKBACK PERIOD (Default: 100 bars) = How much history to analyze
The number of candles backwards from current that get analyzed. More bars = more stable but slower to react. Fewer bars = more reactive but noisier. For 1-minute BTC scalping, 100 bars = last 100 minutes = 1 hour 40 minutes of data. Example: Setting to 50 bars makes it more reactive to recent action but less stable. Setting to 200 bars makes it smoother but slower to show new developments.
🎚️ NUMBER OF BINS (Default: 40) = Resolution of price levels
How many horizontal slices to divide the price range into. More bins = finer resolution but more noise. Fewer bins = smoother but less precise. 40 bins for 1-minute = good balance. Example: With $1,000 range, 40 bins = $25 per level. 20 bins would be $50 per level (less precise). 60 bins would be $16.67 per level (more precise but noisier).
📏 DISPLAY OFFSET (Default: 10 bars) = How far right the profile extends
How many bars to the right of current candle the volume profile displays. Purely visual - doesn't affect calculations. Example: Offset = 10 means the profile extends 10 bars to the right. Offset = 30 means it extends further right (more separation from candles).
📊 VOLUME TREND PERIOD (Default: 15 bars) = How many recent bars define "recent"
The number of bars considered "recent" vs "old" when calculating volume trends. Shorter = more sensitive to very recent changes. Longer = smoother trends. Example: 15 bars means "recent" = last 15 candles (last 15 minutes on 1m chart). Setting to 5 would make it hyper-reactive to the last 5 minutes. Setting to 30 would make it smoother.
🎯 EXHAUSTION THRESHOLD (Default: 65%) = How extreme delta must be for exhaustion
The minimum delta percentage to trigger exhaustion detection. Higher = more selective (only extreme cases). Lower = more signals but more false positives. Example: 65% means delta must be >65% or <-65% to qualify. Setting to 75% would only catch the most extreme exhaustion. Setting to 55% would catch more cases.
💜 MICRO-LEVEL THRESHOLD (Default: 60%) = How strong a level must be for MICRO-SR
The minimum volume percentage (relative to max) required for MICRO-SR detection. Higher = fewer, stronger levels. Lower = more levels but weaker. Example: 60% means bin must have at least 60% of the max bin's volume. Setting to 70% would show only the strongest levels. Setting to 50% would show more levels.
⚡ DELTA MOMENTUM PERIOD (Default: 3 bars) = How many bins to average for momentum
How many previous bins to average when calculating delta momentum. Shorter = more sensitive acceleration signals. Longer = smoother, less noisy. Example: 3 bins means compares current to average of last 3. Setting to 5 would smooth out momentum detection. Setting to 2 would make it more reactive.
🌊 FLOW SHIFT SENSITIVITY (Default: 40%) = Minimum delta change for flow shift
How much delta must change between consecutive bins to trigger FLOW SHIFT. Lower = more flow shift signals (more sensitive). Higher = fewer, stronger signals. Example: 40% means delta must flip by at least 40% (e.g., from -20% to +20% or from +10% to -30%). Setting to 60% would only catch major reversals. Setting to 25% would catch smaller shifts.
💥 VOLUME SPIKE THRESHOLD (Default: 2.0x) = Multiplier to trigger spike signal
How many times above average volume must be to show the spike label. Higher = fewer spikes shown (only extreme). Lower = more spikes shown. Example: 2.0× means current volume must be at least double the 20-bar average. Setting to 3.0× would only show massive spikes. Setting to 1.5× would show more moderate spikes.
🚀 BREAKOUT MOMENTUM MINIMUM (Default: 20%) = Minimum delta for breakout signal
How much delta momentum required at POC for VA breakout to trigger. Higher = fewer breakout signals (more selective). Lower = more signals but more false positives. Example: 20% means POC delta must be at least 20% (or -20%) when price breaks VA. Setting to 30% would only show strong breakouts. Setting to 10% would show weaker breakouts too.
───────────────────────────────────────────────────────────────────────────────
🔬 ADVANCED TECHNICAL DETAILS
───────────────────────────────────────────────────────────────────────────────
📐 BIN POSITIONING = Price-to-bin mapping formula
For any price P, its bin index = floor((P - MinPrice) / BinStep). BinStep = (MaxPrice - MinPrice) / NumBins. Example: Range $99,000-$100,000, 40 bins. BinStep = $1,000/40 = $25. Price $99,550 → Bin 22: (99,550 - 99,000) / 25 = 22.
📊 VOLUME DISTRIBUTION = Proportional allocation across bins
When a candle spans multiple bins, its volume is distributed proportionally based on how much of the candle's range overlapped each bin. Example: Candle from $99,950 to $100,050 (range = $100) with 50 BTC volume. Bin 1 ($99,950-$99,975) gets 25% of range = 12.5 BTC. Bin 2 ($99,975-$100,000) gets 25% = 12.5 BTC. Bin 3 ($100,000-$100,025) gets 25% = 12.5 BTC. Bin 4 ($100,025-$100,050) gets 25% = 12.5 BTC.
🎨 COLOR GRADIENT MAPPING = Delta to RGB conversion
Delta percentage is normalized to 0-1 scale (from -100/+100 range), then mapped to RGB gradient. -100% (0.0) = Full bearish color RGB. 0% (0.5) = Neutral gray. +100% (1.0) = Full bullish color RGB. Example: Delta = 60% → Normalized = 0.8 → 80% towards full bullish color (bright cyan).
⚖️ BALANCE SCORE FORMULA = Weighted geometric mean
BalanceScore = (VolumeBalance^w) × (PriceBalance^w) × (HitBalance^w), where w=weight (default 1.0). VolumeBalance = 1 - |BullVol - BearVol|/TotalVol. PriceBalance = 1 - AvgRange/MaxRange. HitBalance = Hits/MaxHits. Example: Vol=0.9, Price=0.8, Hit=0.7 → Score = 0.9 × 0.8 × 0.7 = 0.504.
🔄 DELTA HISTORY TRACKING = Rolling array per bin
Each bin maintains an array of its last N delta values (where N = delta momentum period). When calculating momentum, current delta is compared to the average of this array. Example: Bin's delta history = . Average = 25%. Current = 55%. Momentum = 55 - 25 = 30.
📈 VOLUME VELOCITY = Second derivative of volume
Measures acceleration of volume change. Recent change = (Recent - Mid). Old change = (Mid - Old). Acceleration = (Recent change - Old change) / |Old change|. Positive = accelerating. Negative = decelerating. Example: Old=100, Mid=150, Recent=220. Recent change = 70. Old change = 50. Accel = (70-50)/50 = 0.4 = 40% acceleration.
🎯 VA EXPANSION ALGORITHM = Greedy breadth-first from POC
Start at POC bin. While accumulated volume < 70% of total: Look at bin above and bin below POC boundary. Choose whichever has more volume. Add that bin to VA. Repeat. Example: POC at bin 20. Bin 21 (above) has 80 BTC, Bin 19 (below) has 95 BTC. Add bin 19. Now VA = bins 19-20. Next: Bin 21 has 80, Bin 18 has 70. Add bin 21. VA = bins 19-21. Continue until 70% captured.
⏱️ REAL-TIME UPDATES = Recalculates on every new bar close
The entire profile recalculates when barstate.islast = true (current bar). All 40 bins are cleared and rebuilt from scratch using the last N candles. This ensures the profile is always accurate to the current market state. Example: On 1-minute chart, the profile fully recalculates every 60 seconds when the new candle opens.
🎨 RENDERING OPTIMIZATION = 500-bar future limit management
TradingView limits drawing objects to 500 bars into the future. The indicator calculates safe offsets: maxFutureBar = bar_index + 499, then caps all box/line/label positions to stay under this limit. Example: Current bar_index = 1000. Max future = 1499. Display offset wanted = 200. Safe offset = min(200, 400 - 100) = min(200, 300) = 200 ✓ safe.
───────────────────────────────────────────────────────────────────────────────
💡 INTERPRETATION TIPS
───────────────────────────────────────────────────────────────────────────────
🔢 Understanding Percentages:
- Delta 0-30%: Weak bias, essentially balanced
- Delta 30-60%: Moderate bias, one side has control
- Delta 60-85%: Strong bias, one side dominated
- Delta 85-100%: Extreme bias, one-sided market (exhaustion likely)
📊 Volume Trend Interpretation:
- Trend -1.0 to -0.3: Strong decline in participation
- Trend -0.3 to -0.1: Moderate decline
- Trend -0.1 to +0.1: Stable/flat volume
- Trend +0.1 to +0.3: Moderate increase
- Trend +0.3 to +1.0: Strong increase in participation
🎯 Balance Score Ranges:
- 0.0-0.3: Heavily imbalanced, strong directional bias
- 0.3-0.5: Moderate imbalance, rotation forming
- 0.5-0.7: Balanced rotation zone
- 0.7-1.0: Perfect equilibrium, range-bound
⚡ Momentum Thresholds:
- <10: Negligible momentum change
- 10-20: Moderate acceleration
- 20-40: Strong acceleration (arrow appears)
- >40: Extreme acceleration (very rare, very significant)
═══════════════════════════════════════════════════════════════════════════════
Understanding these calculations helps you know WHY the indicator is showing what it's showing. When you see "FLOW SHIFT ↑", you now know it calculated a >40% delta flip with increasing volume. When you see MICRO-SR, you know that level has >60% of max volume, >20% of max hits, and active participation. When you see ⇈, you know delta jumped significantly above its 3-bin average. Use this knowledge to trust the signals and understand their strength.
═══════════════════════════════════════════════════════════════════════════════

Mean Reversion Signals (v6.4) – VWAP ±SD use with "support and resistence levels with breaks {lux algo} " at 5m tf for better results


HK Premarket RangeIndicates Highs and lows in the premarket for Hong Kong futures. Could be used for Chinese futures too.

Smart RSI Money Flow - Core Bands V1.01SMART RSI – Money Flow Bands (Technical Overview)
1. Background: RSI and Its Behavior on Lower Timeframes
The Relative Strength Index (RSI) originally is a momentum oscillator calculated from average gains and losses over a selected period. In its standard form, RSI is derived solely from price changes; it does not incorporate volume data or order-flow information in its formula.
Because RSI is price-based, its interpretation depends strongly on the timeframe:
• On higher timeframes, each bar aggregates more trading activity, and RSI tends to behave more smoothly.
• On lower timeframes (1-hour down to intraday scalping intervals), price fluctuations are quicker, and RSI becomes more sensitive to short-term noise.
This does not imply that RSI becomes invalid, but that its signals on fast charts can be more reactive and may benefit from additional context such as volume behavior or structural information.
2. Purpose of This Indicator
This indicator extends the classical RSI by adding information that RSI does not include:
• Mapping RSI values into price-based bands instead of the 0–100 oscillator space.
• Retrieving lower timeframe volume data and separating it into buy and sell components.
• Comparing the slope (angle) of price movement with the slope of buy and sell volume.
The goal is to provide a structural interpretation of where price sits relative to RSI conditions and how volume is behaving on a lower timeframe.
3. Technical Differences Compared to Classical RSI
A) Classical RSI
• Input: price only (usually close).
• Output: normalized oscillator between 0 and 100.
• Does not incorporate intra-bar volume distribution.
• Does not separate buy/sell volume.
B) SMART RSI – Money Flow Bands
1) RSI-to-Price Mapping
Converts RSI values into upper/lower price bands using recent price extremes.
2) Lower Timeframe Volume Decomposition
Retrieves LTF data and splits each bar’s volume into buy (close>open) and sell (close

2 EMA Crossover Signal. Paid Version2 EMA Crossover Signal. Indicator comes with alert and EMA can be changed by user. Default EMA is 9/20
The 2 EMA Crossover Signal is a powerful, easy-to-use technical indicator designed to help traders identify potential trend reversals and momentum shifts with precision. By combining two Exponential Moving Averages (EMAs) of different lengths, this indicator highlights moments when the market may be transitioning from bearish to bullish conditions—or vice versa. These crossover points often signal the beginning of new trends, making them highly valuable for traders looking to enter or exit positions with confidence.
This tool continuously monitors the relationship between the fast EMA and the slow EMA. When the fast EMA crosses above the slow EMA, it generates a bullish signal, suggesting upward momentum and a potential buying opportunity. Conversely, when the fast EMA crosses below the slow EMA, it issues a bearish signal, indicating downward pressure and a possible selling or shorting opportunity.
The 2 EMA Crossover Signal is ideal for traders of all experience levels and works effectively across multiple timeframes—whether you're day trading, swing trading, or analyzing long-term trends. It helps simplify market noise, provides cleaner trend direction, and enhances decision-making by giving visually clear signals on your chart. With its straightforward behavior and consistent performance, this indicator is a must-have for anyone looking to trade with more structure, discipline, and clarity.