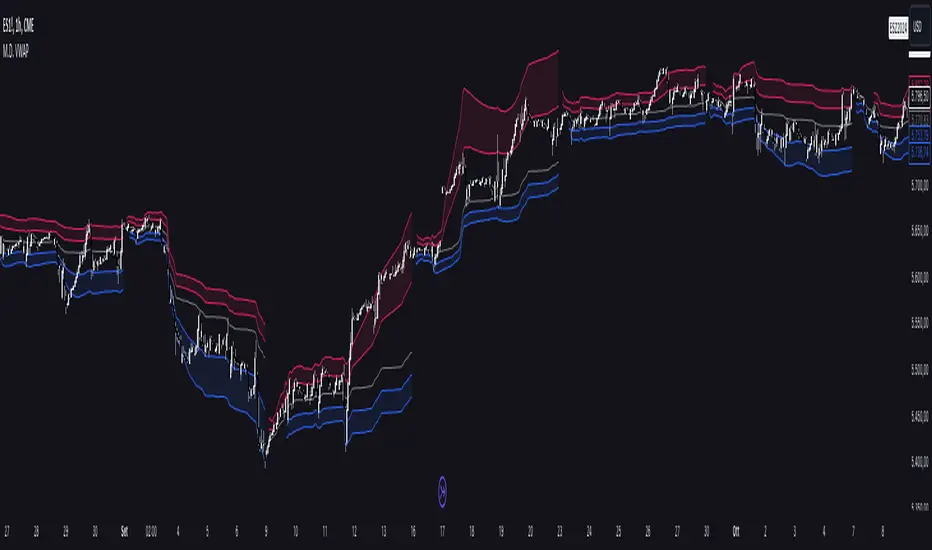
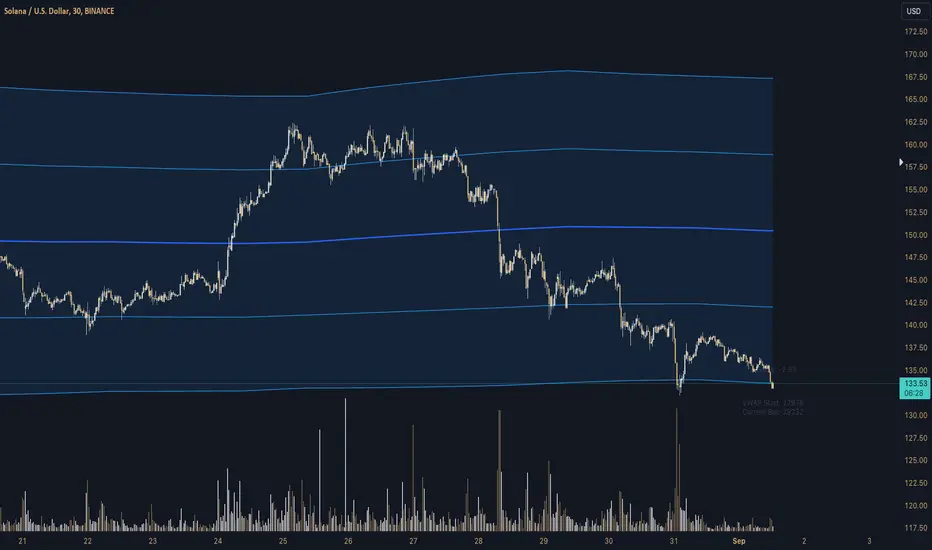
Multi Deviation VWAP [OmegaTools]The Multi Deviation VWAP is an original variation of the traditional VWAP indicator, designed to enhance your trading experience by providing more precise market insights. While the conventional VWAP calculates a single price level based on volume and price over a given period, the Multi Deviation VWAP goes a step further by introducing dynamic upper and lower bands that adapt to market conditions. These bands give traders a more comprehensive understanding of volatility and price action, making it an ideal tool for various trading strategies, especially for identifying potential price reversals or trend continuations.
Key Features:
Separate Calculation of Deviation Bands:
Unlike traditional VWAP bands, where both the upper and lower bands are symmetrically calculated using a single deviation value, the Multi Deviation VWAP calculates the deviations independently for the upper and lower bands. This allows for a more accurate reflection of market dynamics.
The upper deviation band is based on the average distance of closing prices above the VWAP, while the lower deviation band considers the average distance of closing prices below the VWAP.
This separation provides a more tailored approach, adapting to whether the market is showing bullish or bearish momentum, as opposed to a fixed, equal deviation in both directions.
Internal and External Bands:
Two sets of deviation bands are plotted: Internal Bands and External Bands, controlled by user inputs (factorone for internal and factortwo for external). These bands offer multiple levels of support and resistance based on market volatility.
The Internal Bands are closer to the VWAP and act as the first level of support/resistance, suitable for short-term or tighter trading ranges.
The External Bands are further from the VWAP and capture more significant market swings, useful for identifying larger trends or setting wider stop-losses.
Timeframe Flexibility:
The indicator allows traders to select the desired timeframe (1D by default) over which the VWAP and its deviation bands are calculated. This flexibility enables users to adapt the indicator to different trading styles, from intraday scalping to longer-term trend analysis.
Visual Enhancements:
Bullish and Bearish Colors: The bands are color-coded for quick visual interpretation. Bullish bands (lower deviations) are colored blue, while bearish bands (upper deviations) are colored red, making it easy to differentiate between market conditions at a glance.
Plot Fill: The area between the internal and external bands is shaded, providing clear visual zones of potential price containment, aiding in understanding the market structure and anticipating price movements.
How It Differs from a Standard VWAP:
Traditional VWAP provides a single price line that represents the volume-weighted average price over a given period, often used to identify general price trends.
In contrast, the Multi Deviation VWAP introduces upper and lower bands calculated separately based on price deviations above and below the VWAP, giving a more nuanced view of market volatility.
Symmetrical bands in traditional VWAP may not always accurately reflect the market's true behavior, especially in trending markets, where upward and downward price movements aren't always equal. By splitting the deviation calculations, this tool provides a more dynamic and realistic view of price action, adapting to whether the market is showing stronger upward or downward pressure.
Use Cases:
Trend Identification: The VWAP line acts as a central trend line, while the deviation bands offer levels of potential support and resistance. When price moves beyond the external bands, it may indicate overextension and potential reversal.
Volatility Trading: Traders can use the internal and external bands to set dynamic take-profit or stop-loss levels, allowing for flexible risk management depending on market conditions.
Range Trading: In consolidating markets, the Multi Deviation VWAP can help traders identify optimal buy and sell zones as the price oscillates between the upper and lower bands.
By incorporating independent deviation bands, this indicator provides traders with a more responsive tool that reflects market behavior more accurately, helping them make informed trading decisions with enhanced precision.
Harga Rata-Rata Terbebani Volume / Volume Weighted Average Price (VWAP)
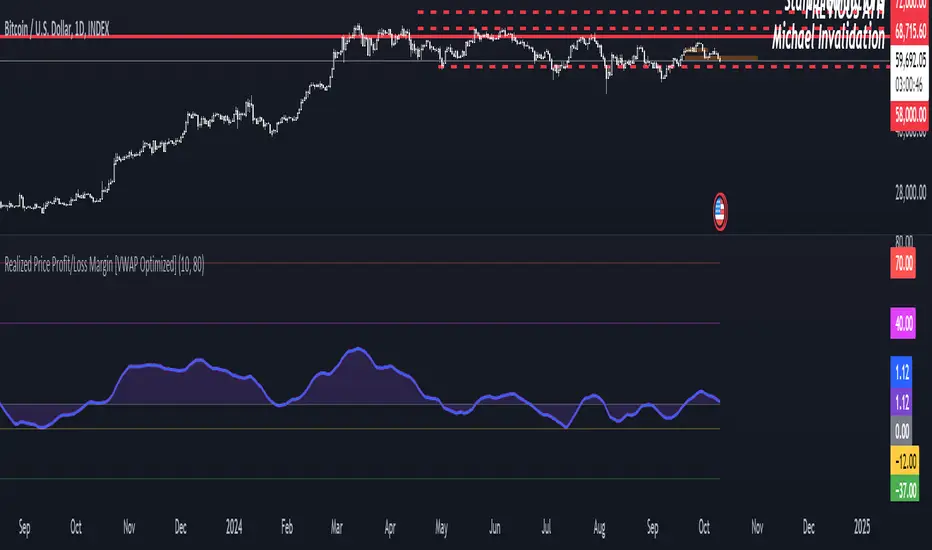
Realized Price Profit/Loss Margin [VWAP Optimized]Shaded Profit/Loss Margin Oscillator
The Shaded Profit/Loss Margin Oscillator is a powerful tool designed to measure Bitcoin’s Net Unrealized Profit/Loss (NUPL). This metric reflects the difference between Bitcoin’s current market price and its realized price, which approximates the price at which coins were last moved. By smoothing the NUPL using a moving average, the indicator provides a clean purple oscillator line that helps users easily gauge market sentiment. When the oscillator is above the zero line, the market is in profit, and when it is below zero, participants are generally in a state of unrealized loss. The shaded area between the oscillator and the zero line enhances visual clarity, making it easier to identify potential shifts in market behavior such as profit-taking or capitulation.
Unique Features and Added Value
What sets this indicator apart from traditional NUPL indicators is the use of a volume-weighted average price (VWAP) as a proxy for the realized price. Unlike the original on-chain NUPL metric, which relies on complex on-chain data, this indicator leverages VWAP to provide an approximation of realized price based solely on price and volume data available directly on TradingView. This method makes it highly accessible to traders who don’t have access to on-chain data platforms.
The use of VWAP not only simplifies the calculation but also provides additional value, as it incorporates volume into the realized price estimation. This volume-sensitive approach may offer a more responsive and dynamic reflection of realized prices compared to on-chain models, which can sometimes lag. In essence, this VWAP-based NUPL oscillator offers a unique edge in tracking profit/loss margins, particularly for traders who want a straightforward and efficient way to gauge sentiment without relying on external on-chain data sources. It brings the essence of NUPL into the world of technical analysis in an accessible and actionable way.
SMA, VWAP with Buy/Sell Signals - First Signal OnlyIndicator: SMA, VWAP with First Buy/Sell Signals
Overview:
This indicator plots two Simple Moving Averages (SMA 20 and SMA 200) and the Volume-Weighted Average Price (VWAP) on the chart, with fully customizable colors and line thickness. Additionally, it provides buy and sell signals based on the price action relative to these indicators.
Buy Signal:
A buy signal is generated when a green candle (bullish candle) closes above the SMA 20, SMA 200, and VWAP without touching them (i.e., the low of the candle is above all three). This signal will only be plotted for the first such candle of the day to avoid signal clutter.
Sell Signal:
A sell signal is generated when a candle closes below the SMA 20, SMA 200, and VWAP without touching them (i.e., the high of the candle is below all three). Similar to the buy signal, it will only be plotted for the first qualifying candle of the day.
Customization:
SMAs and VWAP: Users can adjust the lengths, colors, and line thickness of the SMAs and VWAP to suit their preferences.
Signal Shape: You can choose from different shapes (arrow, circle, or cross) to represent the buy and sell signals on the chart.
Key Features:
First Candle Only: Both buy and sell signals are generated only for the first candle that satisfies the conditions, ensuring clean and actionable signals.
Visual Customization: Full control over the appearance of the indicator, including signal shapes and line properties.
Works Across Assets: This indicator is applicable to any asset (stocks, forex, crypto) where price action relative to moving averages and VWAP is important.

Auto Anchored Swing VWAP'sThe Auto Anchored Swing VWAP's indicator automatically anchors Volume-Weighted Average Price (VWAP) lines to recent swing highs and swing lows. VWAPs often act as key support or resistance levels because they represent the average price at which the majority of trading volume has occurred over a given time.
What is VWAP? VWAP is an essential tool in trading, representing the average price of a security over a specific period, weighted by volume. It helps traders identify the average price at which most trades have been executed, providing a balanced view of price action over time.
Anchored VWAPs: Unlike traditional VWAPs, which start from the beginning of the day, anchored VWAPs allow traders to "anchor" the calculation to a specific point in time or a pivot on the chart, in this case a swing high and swing low. This version of VWAP follows the price action from a selected point forward.
When the price is above the VWAP, it indicates that the majority of traders have paid less for the asset, creating a potential support zone as buyers may step in at or near this level. On the other hand, when the price is below the VWAP, it suggests that most traders have paid a higher price, which can lead to a resistance level where sellers may appear to defend their positions.
Anchored VWAPs, in particular, provide more precise support and resistance levels by starting from a specific swing high, swing low, or other significant point on the chart. This allows traders to track how price interacts with these levels after a certain bar.
The selectable pivot lookback length in this indicator defines the number of bars to the left and right of a potential swing high or swing low that must be lower (for a swing high) or higher (for a swing low) in order to confirm the pivot. In other words, it controls how many surrounding bars need to validate a local price extreme before it is considered a true swing point.
For example, if the lookback length is set to 9, a swing high is identified when there are 9 bars to the left and 9 bars to the right that all have lower highs than the current bar. The same logic applies for swing lows, where the price must be lower than the highs of the bars to the left and right for it to be considered a swing low.
This parameter allows traders to control the sensitivity of the swing points used to anchor VWAPs. A smaller lookback value will identify more frequent and short-term swing highs and lows, making the VWAPs more responsive to recent price action. Conversely, a larger lookback value will result in fewer but more significant swing points.
Pine Script
Utilization of Pine Script’s Enum Feature: This indicator leverages Pine Script's new enum feature for the selection of the VWAP lines (solid, dashed, or dotted) style.
VWAP Periodic Close [LuxAlgo]The VWAP Periodic Close script offers an advanced tool for analyzing the Volume Weighted Average Price (VWAP) across various timeframes.
This tool enables traders to visualize VWAP close levels for daily, weekly, monthly, quarterly, and yearly periods, offering a comprehensive view of price behavior across different time frames. It helps in identifying key levels where the VWAP closes at the end of each specified period.
🔶 USAGE
This script is designed to enhance your trading strategy by plotting VWAP close levels on your chart for different time periods. This helps traders easily identify historical VWAP levels and analyze price action relative to these levels, particularly useful for identifying key support and resistance levels providing insights into potential future price behavior.
Supports VWAP closes for multiple timeframes, including historical periods (e.g., 3 months back, 3 quarters back, 3 years back). The labels provide context and detailed information about the VWAP close at a specific point in time and enhance the clarity and usefulness of the VWAP data presented on the chart.
Users can toggle the display of VWAP lines for different periods and customize the colors for each timeframe (e.g., distinct colors for monthly, quarterly, and yearly closes).
🔶 SETTINGS
The script offers a range of customizable settings to tailor the analysis to your trading needs.
🔹 Volume Weighted Average Price (VWAP)
VWAP Close Level: Toggle the display of VWAP levels at the end of each period (daily, weekly, monthly, quarterly, yearly).
VWAP Origin: Toggle the display of the VWAP line for each period.
VWAP Source: Choose the data source for VWAP calculations (default is HLC3).
Historical Closes: Define the number of historical VWAP levels to plot.
Line/Label Offset: Adjust the offset for positioning lines and labels on the chart.
🔹 Themes
Theme Selection: Choose between "Day," "Night," or "Custom" themes to adjust the color scheme of VWAP lines and labels.

VWAP PressureKey Features and Utility:
Intrabar Focus: Unlike standard VWAP, which provides a cumulative average throughout the day, the Intrabar VWAP focuses on volume-weighted price calculations within shorter time frames. This allows traders to see how price and volume interact moment-to-moment, offering a granular view of market sentiment.
Market Pressure Analysis: The indicator examines the difference between a smoothed weighted average price of the close and intrabar price movements. This analysis helps in identifying the market pressure at high volume areas. When the market exhibits high volume at low prices within a bar, it suggests accumulation, whereas high volume at high prices indicates distribution.
Momentum and Pressure Shift Signals: By applying a modified MACD calculation to the smoothed difference, the indicator provides signals on shifts in market pressure. Positive values indicate upward price momentum (buying pressure), while negative values suggest downward momentum (selling pressure).

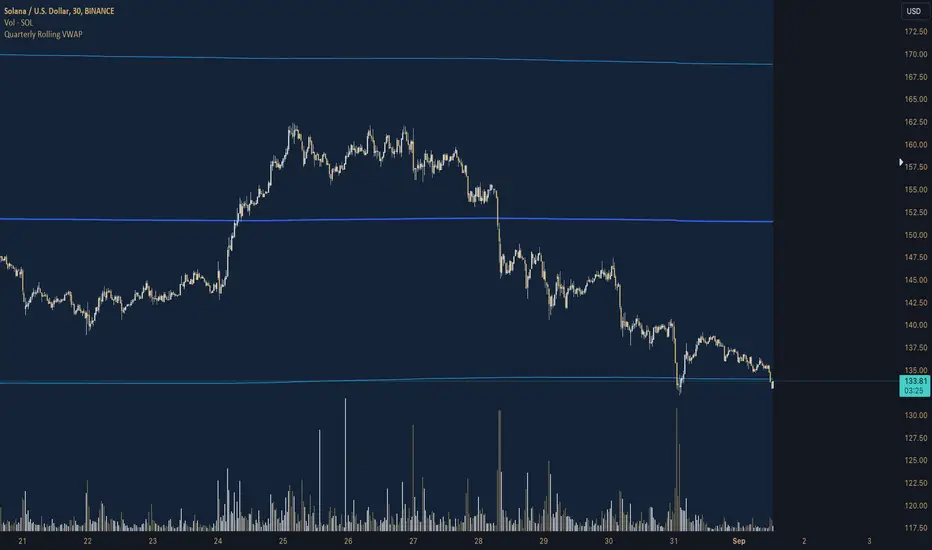
Quarterly Rolling VWAP# Quarterly Rolling VWAP Indicator
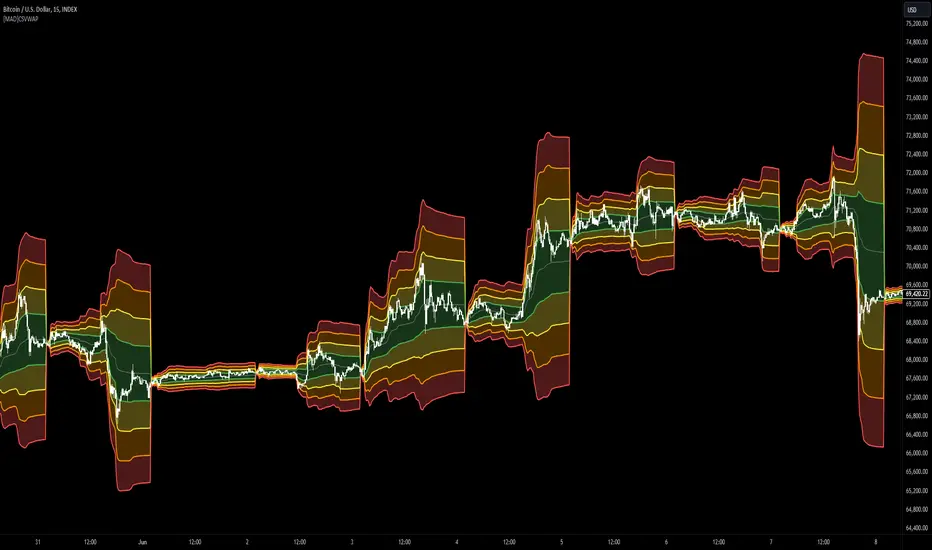
This custom indicator calculates and displays a Volume-Weighted Average Price (VWAP) that resets at the beginning of each quarter, providing traders with a medium-term perspective on price action relative to trading volume.
## Key Features:
1. **Quarterly Reset**: The VWAP calculation automatically resets at the beginning of each quarter, allowing for a rolling analysis that adapts to changing market conditions.
2. **Standard Deviation Bands**: The indicator includes two sets of bands based on standard deviations from the VWAP, helping to identify potential support and resistance levels.
3. **Customizable Appearance**: Users can adjust the colors of the VWAP line and bands, as well as control the visibility and transparency of the bands.
4. **Flexible Band Multipliers**: The distance of the bands from the VWAP can be adjusted using customizable multipliers.
## Indicator Logic:
1. **Quarterly Detection**:
- The script uses a function `isNewQuarter()` to determine the start of a new quarter.
- It calculates the timestamp for the start of the current quarter and checks for changes in this value.
2. **VWAP Calculation**:
- The `calcVWAP()` function computes the Volume-Weighted Average Price.
- It maintains running sums of price * volume and volume, which reset at the start of each quarter.
- The VWAP is calculated as the ratio of these sums.
3. **Standard Deviation Calculation**:
- The `calcStdDev()` function computes the standard deviation of price from the VWAP.
- It uses a similar approach to VWAP, maintaining running sums that reset quarterly.
4. **Band Calculation**:
- Two sets of bands are calculated using the VWAP, standard deviation, and user-defined multipliers.
- Upper and lower bands are plotted at 1x and 2x the standard deviation by default, but these are customizable.
5. **Plotting**:
- The main VWAP line is plotted with user-defined color and width.
- Bands are plotted conditionally based on user preference.
- The area between bands is filled with a semi-transparent color for better visualization.
## Trading Applications:
- **Medium-Term Trend Analysis**: The quarterly VWAP provides a broader perspective on price trends compared to daily or weekly VWAPs.
- **Support and Resistance**: The VWAP line and bands can act as dynamic support and resistance levels.
- **Mean Reversion Strategies**: Traders can look for potential reversals when price reaches the outer bands.
- **Volatility Assessment**: The width of the bands gives an indication of recent price volatility relative to volume.
- **Quarter-over-Quarter Comparison**: By resetting each quarter, the indicator allows for easy comparison of price action across different quarters.
This Quarterly Rolling VWAP indicator is particularly useful for traders focusing on medium-term strategies or those who want to incorporate a broader market context into their analysis. It combines the power of volume-weighted pricing with a quarterly perspective, offering a unique tool for technical analysis
Z-Score Triggered VWAP# Z-Score Triggered VWAP Indicator
This custom indicator combines Volume-Weighted Average Price (VWAP) with Z-Score analysis to create a dynamic, volume-sensitive trading tool. It's designed to identify significant volume events and adjust the VWAP calculation accordingly, providing traders with a more responsive and adaptive price average.
## Key Features:
1. **Z-Score Triggered VWAP**: The indicator calculates a new VWAP when the volume Z-Score crosses above a user-defined threshold, allowing it to adapt to significant volume events.
2. **Customizable Timeframes**: Users can set different timeframes for Z-Score calculation and VWAP plotting, enabling multi-timeframe analysis.
3. **Dynamic Bands**: The indicator plots two sets of bands around the VWAP, calculated using standard deviation multipliers, which can be customized by the user.
4. **Visual Cues**: New VWAP start points are marked with yellow circles, helping traders identify where calculations reset.
5. **Real-time Information**: The current Z-Score and VWAP start information are displayed on the chart, providing immediate context.
6. **Flexible Appearance**: Users can customize colors and choose whether to display bands, enhancing chart readability.
7. **Multiple Alert Conditions**: The indicator includes alert conditions for price crossovers of the VWAP and all band levels.
## How It Works:
1. The indicator calculates the volume Z-Score on a user-specified timeframe, comparing current volume to historical volume over a lookback period.
2. When the volume Z-Score exceeds the threshold, a new VWAP calculation is triggered, resetting the cumulative values used in the VWAP formula.
3. The VWAP is continuously calculated and plotted on the chart, along with upper and lower bands based on price deviation from the VWAP.
4. Traders can use the VWAP line and bands to identify potential support/resistance levels and overbought/oversold conditions.
5. The Z-Score trigger helps ensure that the VWAP remains relevant by adapting to significant changes in trading volume.
## Trading Applications:
- **Dynamic Support/Resistance**: Use the VWAP and bands as potential support and resistance levels that adapt to changing market conditions.
- **Trend Identification**: The slope of the VWAP can help identify the overall trend direction.
- **Mean Reversion**: Look for potential reversals when price reaches the outer bands.
- **Volume Analysis**: The Z-Score trigger points highlight periods of unusual volume, which may precede significant price moves.
- **Risk Management**: Use the bands as potential stop-loss or take-profit levels.
This indicator is suitable for traders who want a more dynamic alternative to traditional VWAP indicators, especially those trading in markets with variable volume patterns. It combines volume analysis with price action, providing a comprehensive view of market behaviour
VWAP with Trend Alerts [CrossTrade]The VWAP with Trend Alerts indicator is designed to provide a comprehensive visual and analytical tool for traders using the Volume Weighted Average Price (VWAP) along with additional features like custom bar coloring and trend-based signal alerts.
Key Components and Functionalities:
1. VWAP Calculation: The core of this indicator is the VWAP, which represents the average price of an asset, weighted by volume. It's a popular tool among traders to identify the general direction and strength of a trend, and for assessing entry and exit points.
2. Standard Deviation Bands: Surrounding the VWAP are multiple bands calculated based on standard deviation values. These bands serve as dynamic support and resistance levels. The script allows up to three bands, each with customizable multipliers, giving insights into price volatility and potential breakout or reversal points.
3. Bar Coloring Options:
- Color All Bars: When enabled, all bars on the chart are colored based on whether they close above (green) or below (red) the VWAP.
- Trend Bars Only: This option, when selected, colors only the bars that close beyond the second standard deviation band. It helps in identifying stronger trends and significant market movements.
4. Buy and Sell Signal Conditions: The script includes conditions for buy and sell signals specifically tailored for trend bars. A buy signal is generated when a bar closes above both the VWAP and the upper second standard deviation band, indicating a potential strong uptrend. Conversely, a sell signal is triggered when a bar closes below both the VWAP and the lower second standard deviation band, suggesting a strong downtrend.
5. Alert Conditions: To aid in timely decision-making, the script features alert conditions corresponding to the buy and sell signals.
Usage and Application:
- For Trend Identification: The VWAP and its bands can help identify the prevailing market trend. Bars closing consistently above the VWAP suggest an uptrend, while those closing below indicate a downtrend.
- Volatility Assessment: The standard deviation bands provide a visual representation of market volatility. Narrower bands suggest low volatility, while wider bands indicate high volatility.
- Signal Alerts for Trading: The buy and sell signals, especially those filtered by the trend bars condition, can be valuable for traders looking for strong movement confirmations.
Flexibility and Customization:
This indicator is highly customizable and builds off of the core logic found in standard VWAP indicators. By allowing traders to adjust the standard deviation multipliers and choose their preferred bar coloring strategy. It caters to various trading styles, whether focusing on the broader market trend or pinpointing significant trend-based movements.
Panoramic VWAP### Panoramic VWAP Indicator Overview
The Panoramic VWAP indicator provides a way to display up to four Volume Weighted Average Price (VWAP) lines on a chart, each anchored to different timeframes. This indicator also includes options for displaying standard deviation bands and close lines, offering a comprehensive view of price action across multiple time horizons.
### Key Features
Quad VWAPs : The indicator allows for the display of four VWAP lines simultaneously. Each line can be set to a different timeframe, enabling traders to analyze market conditions across various periods on a single chart.
Standard Deviation Bands : Users can enable bands around each VWAP line, which represent standard deviations or percentage levels from the VWAP. These bands help in assessing volatility and identifying potential overbought or oversold conditions.
Close Lines : The indicator includes an option to show close lines, marking the price's closing level relative to the VWAP. This feature is useful for examining how the market closes in relation to VWAP, which can be important for understanding trend strength or potential reversals.
### How It Looks
VWAP Lines : Multiple VWAP lines are displayed, each reflecting different timeframes. The lines change color depending on whether the price is above or below the VWAP, indicating bullish or bearish momentum.
Bands : Optional bands around the VWAP lines provide a visual indication of volatility, with the potential to identify overbought or oversold areas.
Close Lines : These lines represent the price's closing level relative to the VWAP and can be displayed to add further context to the analysis.
### How to Use It
Trend Analysis :
- Price above a VWAP line indicates bullish momentum .
- Price below a VWAP line suggests bearish momentum .
Support and Resistance :
- VWAP lines often act as dynamic support and resistance. Price approaching a VWAP line from above may find support, while approaching from below may encounter resistance.
Volatility Assessment :
- Bands around the VWAP lines can signal areas of potential reversal. Upper bands may indicate overbought conditions, while lower bands may indicate oversold conditions.
Multiple Timeframe Analysis :
- The ability to display VWAPs from different timeframes simultaneously allows for the identification of confluence zones, where multiple VWAP levels align, indicating potentially significant support or resistance levels.
Customization :
- The indicator settings are customizable, allowing users to choose which VWAP lines, bands, and close lines to display, along with adjustments for visual preferences like line thickness and colors.
### Practical Application
Intraday Trading : Traders can use the VWAPs and bands to identify potential entry and exit points during the trading day based on price interactions with these levels.
Swing Trading : Monitoring VWAP lines across different timeframes can help identify key levels where price might reverse or gain momentum, aiding in decisions about holding or exiting positions.
Long-Term Analysis : VWAP lines on higher timeframes can serve as dynamic support or resistance levels, providing context for long-term trend analysis and investment decisions.
The Panoramic VWAP indicator allows for a detailed analysis of price trends and levels across multiple timeframes, combining VWAPs, standard deviation bands, and close lines in a single, customizable tool.
Buy and Sell Alerts using VWAPThis is my first script, which I hope you'll enjoy.
The script generates alerts for buy and sell trades using VWAP and volume threshold that you select.
Indicators and Moving Averages :
This script allows you to choose which moving averages like VWAP, 9EMA, 10, 20, 50, 100, 200, and 325 SMAs you want to see on your chart.
Volume Threshold :
You can set a volume threshold, which is the minimum required volume required for buy and sell signals to be considered valid. (For example, I like 60,000 on SPY, 5 minute chart.)
Buy and Sell Signals :
The script checks if the stock prices crosses above or below the VWAP and if the trading volume is above the threshold you set.
If the price crosses above the VWAP and the volume is sufficient, a "Buy" signal is generated.
If the price crosses below the VWAP and the volume is sufficient, a "Sell" signal is generated.
This hopefully user-friendly indicator will alert you when certain conditions trading conditions are met, helping to make it a little easier to make informed trading decisions.

MVSF 6.0[ELPANO]The "MVSF 6.0 " indicator, which stands for Multi-Variable Strategy Framework, overlays on price charts to aid in trading decisions. It combines various moving averages and volume data to generate buy and sell signals based on predefined conditions.
Key features of the indicator include:
Moving Averages: It uses three exponential moving averages (EMAs) with lengths of 200, 100, and 50, and two simple moving averages (SMAs) with lengths of 14 and 9. These averages are combined into a single average line to detect trends.
Volume Analysis: The volume is assessed over a specified period (default is 2 bars) to determine its trend relative to its average, influencing the color and interpretation of signals.
Price Source and VWAP: Users can select the price (close, low, or high) used for calculations. The volume-weighted average price (VWAP) serves as a potential benchmark or condition in signal generation.
Signal Generation: Buy and sell signals are based on the relationship of the price to the average line and VWAP, the direction of the last candle, and the trend direction of the average line. These signals are visually represented on the chart.
Customization: Traders can toggle the visibility of signals, entry points, the average line, and even use these elements as conditions for filtering signals.
This script is designed to be flexible, allowing traders to modify settings according to their strategy needs. The description and implementation aim to provide clarity on how each component works together to assist in trading decisions, adhering to best practices for creating and publishing trading scripts.
*************************************
Der Indikator "MVSF 6.0 ", der für Multi-Variable Strategy Framework steht, wird über Preisdiagramme gelegt, um bei Handelsentscheidungen zu helfen. Er kombiniert verschiedene gleitende Durchschnitte und Volumendaten, um Kauf- und Verkaufssignale basierend auf vordefinierten Bedingungen zu generieren.
Wesentliche Merkmale des Indikators umfassen:
Gleitende Durchschnitte: Es werden drei exponentielle gleitende Durchschnitte (EMAs) mit Längen von 200, 100 und 50 sowie zwei einfache gleitende Durchschnitte (SMAs) mit Längen von 14 und 9 verwendet. Diese Durchschnitte werden zu einer einzelnen Durchschnittslinie kombiniert, um Trends zu erkennen.
Volumenanalyse: Das Volumen wird über einen festgelegten Zeitraum (standardmäßig 2 Balken) bewertet, um seinen Trend im Vergleich zum Durchschnitt zu bestimmen, was die Farbe und Interpretation der Signale beeinflusst.
Preisquelle und VWAP: Benutzer können den für Berechnungen verwendeten Preis (Schluss-, Tief- oder Hochkurs) auswählen. Der volumengewichtete Durchschnittspreis (VWAP) dient als mögliche Benchmark oder Bedingung bei der Generierung von Signalen.
Signalgenerierung: Kauf- und Verkaufssignale basieren auf dem Verhältnis des Preises zur Durchschnittslinie und zum VWAP, der Richtung der letzten Kerze und der Trendrichtung der Durchschnittslinie. Diese Signale werden visuell auf dem Diagramm dargestellt.
Anpassung: Händler können die Sichtbarkeit von Signalen, Einstiegspunkten, der Durchschnittslinie und sogar deren Verwendung als Bedingungen für die Filterung von Signalen ein- und ausschalten.
Dieses Skript ist so konzipiert, dass es flexibel ist und Händlern erlaubt, die Einstellungen gemäß ihren Strategiebedürfnissen zu modifizieren. Die Beschreibung und Implementierung zielen darauf ab, Klarheit darüber zu schaffen, wie jede Komponente zusammenarbeitet, um bei Handelsentscheidungen zu helfen, und halten sich an die besten Praktiken für die Erstellung und Veröffentlichung von Handelsskripten.

VWAP Bands [TradingFinder] 26 Brokers Data (Forex + Crypto)🔵 Introduction
Indicators are tools that help analysts predict the price trend of a stock through mathematical calculations on price or trading volume. It is evident that trading volume significantly impacts the price trend of a stock symbol.
The Volume-Weighted Average Price (VWAP) indicator combines the influence of trading volume and price, providing technical analysts with a practical tool.
This technical indicator determines the volume-weighted average price of a symbol over a specified time period. Consequently, this indicator can be used to identify trends and entry or exit points.
🟣 Calculating the VWAP Indicator
Adding the VWAP indicator to a chart will automatically perform all calculations for you. However, if you wish to understand how this indicator is calculated, the following explains the steps involved.
Consider a 5-minute chart. In the first candle of this chart (which represents price information in the first 5 minutes), sum the high, low, and close prices, and divide by 3. Multiply the resulting number by the volume for the period and call it a variable (e.g., X).
Then, divide the resulting output by the total volume for that period to calculate your VWAP. To maintain the VWAP sequence throughout the trading day, it is necessary to add the X values obtained from each period to the previous period and divide by the total volume up to that time. It is worth noting that the calculation method is the same for intervals shorter than a day.
The mathematical formula for this VWAP indicator : VWAP = ∑ (Pi×Vi) / ∑ Vi
🔵 How to Use
Traders might consider the VWAP indicator as a tool for predicting trends. For example, they might buy a stock when the price is above the VWAP level and sell it when the price is below the VWAP.
In other words, when the price is above the VWAP, the price is rising, and when it is below the VWAP, the price is falling. Major traders and investment funds also use the VWAP ratio to help enter or exit stocks with the least possible market impact.
It is important to note that one should not rely solely on the VWAP indicator when analyzing symbols. This is because if prices rise quickly, the VWAP indicator may not adequately describe the conditions. This indicator is generally used for daily or shorter time frames because using longer intervals can distort the average.
Since this indicator uses past data in its calculations, it can be considered a lagging indicator. As a result, the more data there is, the greater the delay.
🟣 Difference Between VWAP and Simple Moving Average
On a chart, the VWAP and the simple moving average may look similar, but these two indicators have different calculations. The VWAP calculates the total price considering volume, while the simple moving average does not consider volume.
In simpler terms, the VWAP indicator measures each day's price change relative to the trading volume that occurred that day. In contrast, the simple moving average implicitly assumes that all trading days have the same volume.
🟣 Reasons Why Traders Like the VWAP Indicator
The VWAP Considers Volume: Since VWAP takes volume into account, it can be more reliable than a simple arithmetic average of prices. Theoretically, one person can buy 200,000 shares of a symbol in one transaction at a single price.
However, during the same time frame, 100 other people might place 200 different orders at various prices that do not total 100,000 shares. In this case, if you only consider the average price, you might be mistaken because trading volume is ignored.
The Indicator Can Help Day Traders: While reviewing your trades, you might notice that the shares you bought at market price are trading below the VWAP indicator.
In this case, there's no need to worry because with the help of VWAP, you always get a price below the average. By knowing the volume-weighted average price of a stock, you can easily make an informed decision about paying more or less than other traders for the stock.
VWAP Can Signal Market Trend Changes: Buying low and selling high can be an excellent strategy for individuals. However, you are looking to buy when prices start to rise and sell your shares when prices start to fall.
Since the VWAP indicator simulates a balanced price in the market, when the price crosses above the VWAP line, one can assume that traders are willing to pay more to acquire shares, and as a result, the market will grow. Conversely, when the price crosses below the line, this can be considered a sign of a downward movement.
🔵 Setting
Period : Indicator calculation time frame.
Source : The Price used for calculations.
Market Ultra Data : If you turn on this feature, 26 large brokers will be included in the calculation of the trading volume.
The advantage of this capability is to have more reliable volume data. You should be careful to specify the market you are in, FOREX brokers and Crypto brokers are different.
Multiplier : Coefficient of band lines.

Session VWAPS [QuantVue]The Session VWAPS indicator is a designed for traders to enhance their trading analysis by incorporating Volume Weighted Average Price (VWAP) anchored to custom-defined trading sessions.
This indicator automatically plots VWAPs at three critical points of a user defined session:
🔹session start
🔹session high
🔹session low
Additionally, it provides the option to display the VWAPs from previous sessions, offering a look at potential areas of support and resistance.
Anchored VWAP, or Anchored Volume-Weighted Average Price, is a technical analysis tool used to determine the average price of a stock weighted by volume, starting from a specific point in time chosen by the analyst.
Unlike traditional VWAP, which starts at the beginning of the trading session, the anchored VWAP allows traders to select any point on the chart, such as a significant event, price low, high, or a breakout, to begin the calculation.
VWAP incorporates price and volume in a weighted average and can be used to identify areas of support and resistance on the chart.
Indicator Features:
Custom Session Definition:
Users can define their own trading sessions by specifying start and end times, allowing for tailored analysis according to individual trading strategies or market hours.
Anchored VWAP at Three Key Points:
🔹Session Start VWAP: This VWAP is anchored at the start of the defined session.
🔹Session High VWAP: Anchored at the highest price point within the session.
🔹Session Low VWAP: Anchored at the lowest price point within the session.
Previous Session VWAPs:
The indicator can display VWAPs from the previous session, allowing traders to spot potential areas of support and resistance.
Give this indicator a BOOST and COMMENT your thoughts below!
We hope you enjoy.
Cheers!

BooBee Digital - Enhanced Buy & Sell Alerts Suite
BooBee Digital - Enhanced Buy & Sell Alerts Suite
Introduction:
The “BooBee Digital - Enhanced Buy & Sell Alerts Suite” is a comprehensive trading tool designed to provide traders with precise buy and sell signals by integrating the Average True Range (ATR) trailing stop technique and the Volume Weighted Average Price (VWAP) indicator. This script is tailored to help traders make informed decisions by considering both market volatility and trading volume.
How It Works:
1. ATR Calculation:
• Purpose: Measures market volatility to set dynamic stop levels.
• Details: The Average True Range (ATR) is calculated over a user-defined period. The ATR value reflects the average range of price movements over the specified period, which is crucial for assessing market volatility.
2. ATR Trailing Stop:
• Purpose: Identifies potential trend reversals by setting trailing stops based on market volatility.
• Details: The ATR trailing stop is dynamically adjusted using the ATR value and a user-defined sensitivity factor. This trailing stop level helps identify trend reversals by moving in accordance with price fluctuations.
3. VWAP Calculation:
• Purpose: Provides a volume-weighted average price to benchmark fair value.
• Details: The VWAP is calculated by taking the sum of the product of price and volume, divided by the total volume. This indicator gives traders a reference point for the average price at which the asset has traded throughout the day, considering trading volume.
4. EMA Crossover:
• Purpose: Adds a confirmation layer for buy and sell signals.
• Details: A 1-period Exponential Moving Average (EMA) is used to identify short-term price movements. Buy and sell signals are generated based on the crossover of the EMA and the ATR trailing stop, adding an extra layer of confirmation for trade entries and exits.
Signal Generation:
Buy Signal:
• Generated when the price is above the ATR trailing stop and there is a bullish crossover of the EMA and ATR trailing stop.
• Indicator: Green label below the bar with “Buy” text.
Sell Signal:
• Generated when the price is below the ATR trailing stop and there is a bearish crossover of the EMA and ATR trailing stop.
• Indicator: Red label above the bar with “Sell” text.
VWAP Line:
• The VWAP line is plotted on the chart to help traders identify significant price levels based on trading volume.
• Indicator: Blue line representing the VWAP.
How to Use:
• Chart Type: The script is designed for use on standard chart types such as Candlestick and OHLC. It does not support non-standard chart types like Heikin Ashi, Renko, Kagi, Point & Figure, and Range, as they may produce unrealistic results.
• Clean Chart: Ensure your chart is clean and free of other indicators to avoid confusion. The signals and colors plotted by the script should be easily identifiable.
• Trade Confirmation: Use the buy and sell signals generated by the script in conjunction with other analysis methods to confirm trades.
Key Concepts:
• ATR Trailing Stop: This technique sets dynamic stop levels based on market volatility, helping to identify trend reversals.
• VWAP: This indicator provides a benchmark for the average price considering trading volume, helping traders identify fair value.
• EMA Crossover: This adds a layer of confirmation for buy and sell signals, improving the accuracy of trade entries and exits.

VWAP Bands [UAlgo]The "VWAP Bands " indicator is designed to provide traders with valuable insights into market trends and potential support/resistance levels using Volume Weighted Average Price (VWAP) bands. This indicator integrates the core concepts of VWAP with additional trend analysis features, making it a versatile tool for both range trading and trend-following strategies.
The VWAP bands are plotted based on the standard deviation multipliers, creating upper and lower bands around the VWAP. These bands serve as dynamic support and resistance levels. When the price approaches these bands, traders can anticipate potential reversals or continuations of the current trend. Additionally, the indicator provides visual cues for trend strength and potential trend changes, helping traders make informed decisions in various market conditions.
🔶 Settings
Source (Data Source): The data source for VWAP calculations. The default setting is the typical price (HLC3), which is the average of the high, low, and close prices.
Length: The number of bars used in the VWAP calculation. This determines the lookback period for the indicator.
Standard Deviation Multiplier: The multiplier applied to the standard deviation to create the primary upper and lower VWAP bands. This setting controls the distance of the bands from the VWAP.
Secondary Standard Deviation Multiplier: The multiplier applied to the standard deviation to create the secondary upper and lower VWAP bands, providing additional levels of support and resistance.
Display Trend: A toggle to enable or disable the display of the trend analysis feature. When enabled, the indicator highlights trend strength and potential trend changes.
Display Trend Crossovers: A toggle to enable or disable the display of trend crossover signals. When enabled, the indicator plots shapes to indicate where trend switches are likely occurring.
🔶 Calculations
The calculations behind the "VWAP Bands " indicator begin with determining the Volume Weighted Average Price (VWAP), which provides a comprehensive view of the average price of an asset, weighted by trading volume. This gives a more accurate representation of the asset's true average price over a specified period.
The first step in this process involves summing the trading volume over a chosen period, typically represented by the length parameter. Simultaneously, the product of the price (usually an average of the high, low, and close prices) and the trading volume is calculated and summed. By dividing this cumulative price-volume product by the total volume, we obtain the VWAP value. This VWAP serves as the central anchor around which the price action oscillates.
To enhance the utility of VWAP, we introduce standard deviation calculations. Standard deviation measures the extent of price dispersion from the VWAP, providing insight into price volatility. By calculating the variance (which involves the squared deviations of price) and then taking its square root, we derive the standard deviation. This helps in understanding how far prices typically stray from the VWAP.
With the VWAP and standard deviation in hand, we then establish upper and lower bands by adding and subtracting multiples of the standard deviation from the VWAP. These bands act as dynamic support and resistance levels, adapting to changes in market volatility. The primary bands, set by the first standard deviation multiplier, are augmented by secondary bands defined by a larger multiplier, offering additional layers of potential support and resistance.
It also integrates trend analysis, highlighting areas where the price action suggests a strong or weak trend. This is achieved by overlaying colored zones above and below the bands, indicating the strength and direction of the trend. When the price crosses these bands, it signals potential trend changes, aiding traders in making timely decisions.
🔶 Disclaimer
The "VWAP Bands " indicator is provided for educational and informational purposes only. It is not intended as financial advice and should not be construed as such.
Trading involves significant risk and may not be suitable for all investors. Before using this indicator or making any investment decisions, it is important to conduct thorough research and consider your financial situation.

[MAD] Custom Session VWAP BandsOverview
This indicator helps visualize the Volume Weighted Average Price (VWAP) and its associated standard deviation bands over specified time periods, providing traders with a clear understanding of price trends, volatility, and potential support/resistance levels.
Inputs
Deviation
StDev mult 1: Multiplier for the first standard deviation band (Default: 1.0)
StDev mult 2: Multiplier for the second standard deviation band (Default: 2.0)
StDev mult 3: Multiplier for the third standard deviation band (Default: 3.0)
StDev mult 4: Multiplier for the fourth standard deviation band (Default: 4.0)
Line width: Width of the lines for the bands (Default: 2)
Custom Vwap session reset settings
Many different options are considered when a session is going to be reset.
Plot and Fill Options
Enable Fills: Enable/disable filling between bands.
Plot +4: Enable/disable plotting the +4 standard deviation band.
Plot +3: Enable/disable plotting the +3 standard deviation band.
Plot +2: Enable/disable plotting the +2 standard deviation band.
Plot +1: Enable/disable plotting the +1 standard deviation band.
Plot VWAP: Enable/disable plotting the VWAP line.
Plot -1: Enable/disable plotting the -1 standard deviation band.
Plot -2: Enable/disable plotting the -2 standard deviation band.
Plot -3: Enable/disable plotting the -3 standard deviation band.
Plot -4: Enable/disable plotting the -4 standard deviation band.
How to Use the Indicator
Adding the Indicator
Add the indicator to your chart through your trading platform's indicator menu.
Configuring the VWAP Reset
Specify reset intervals based on time, days of the week, or specific dates.
Adjust the time zone if necessary.
Customizing Standard Deviation Bands
Set the multipliers for the standard deviation bands.
Choose line width for better visualization.
Enabling Plots and Fills
Select which bands to display.
Enable or disable fills between the bands.
Practical Application of VWAP Bands
Understanding VWAP
VWAP is a trading benchmark that calculates the average price a security has traded at throughout the day based on volume and price. It is primarily used for intraday trading but can also offer insights during end-of-day reviews.
Using VWAP for Trading
Intraday Trading
Entry and Exit Points: VWAP can help identify optimal buy and sell points. Buy when the price is above VWAP and sell when it's below.
Support and Resistance: VWAP often acts as a dynamic support/resistance level. Prices tend to revert to VWAP, making it a crucial level for intraday traders.
Trend Confirmation
Uptrends and Downtrends: In an uptrend, the price will generally stay above VWAP. Conversely, in a downtrend, it will stay below. Use this to confirm market direction.
Combining with Other Indicators
Moving Averages and Bollinger Bands: Combining VWAP with these indicators can provide a more robust trading signal, confirming trends and potential reversals.
Setting Stop-Loss and Profit Targets
Conservative Stop Orders: Place stop orders at recent lows for pullback trades.
Profit Targets: Use daily highs or Fibonacci extension levels to set profit targets.
Strategies for Using VWAP
Pullback Strategy
Buy during pullbacks to VWAP in an uptrend, and sell during rallies to VWAP in a downtrend.
Breakout Strategy
Look for breakouts above/below VWAP after the market open to capitalize on new trends.
Momentum Trading
Use VWAP to confirm the strength of a trend. Buy when the price is consistently above VWAP and sell when it's consistently below.
Institutional Strategies
Institutional traders use VWAP to execute large orders without causing significant market impact, ensuring trades are made around the average price.
By incorporating these strategies, traders can better understand market dynamics, make informed trading decisions, and manage their risk effectively.
Some setup possibilities
Price vs VWAP PerformancePrice vs VWAP Performance (PvVWAP)
This indicator visually displays the deviation between the current price and VWAP (Volume Weighted Average Price), helping you to determine the strength of a trend.
How it Works
VWAP Calculation: Calculates the Volume Weighted Average Price (VWAP) over a specified period.
Standard Deviation Calculation: Calculates the standard deviation of closing prices over the past 20 periods.
Deviation Calculation: Calculates the difference between the current price and VWAP, expressed as a multiple of the standard deviation.
Color Assignment: Changes the color of bars and background based on the magnitude of the deviation.
Green: Very strong uptrend
Light Green: Strong uptrend
Light Gray: No trend
Pinkish Red: Weak downtrend
Red: Very strong downtrend
How to Use
Trend Strength Assessment:
The greater the deviation of the price from VWAP, the stronger the trend is considered to be.
The color of the bars and background provides a visual indication of trend strength.
Entry/Exit Point Reference:
You can enter/exit by aiming for the movement of the price returning to VWAP after a large deviation from VWAP.
Notes
Parameter Settings:
The standard deviation period is 20 periods by default, but can be adjusted as needed.
Avoid Using Alone:
It is recommended to use this indicator in combination with other technical indicators.
F.B_Volume Weighted Average Price MTFThe F.B_Volume Weighted Average Price MTF (VWAP MTF) indicator calculates the volume-weighted average price of a security across different timeframes. The VWAP is a powerful indicator used by both institutional and retail traders to make better trading decisions.
Functionality:
Timeframe:
The indicator allows you to adjust the timeframe for the VWAP calculation via the settings. By default, the timeframe is set to weekly ("W").
Restart at new timeframe:
At each new period in the chosen timeframe, the VWAP calculations are reset, and a new VWAP is calculated.
VWAP Calculation:
The VWAP is calculated by the volume-weighted average of the typical prices (High, Low, and Close) of the security. This calculation takes into account the volume of each transaction to provide an accurate average price.
Visualization:
The VWAP is displayed as a line on the chart, and the color of the line changes depending on the price position relative to the VWAP:
Green: The current closing price is above the VWAP (bullish signal).
Red: The current closing price is below the VWAP (bearish signal).
Options:
Show barcolors:
This option allows you to display the colors of the candles based on their position relative to the VWAP (green for bullish, red for bearish).
Show previous VWAP close:
This option shows the closing value of the VWAP from the previous period to provide historical reference points.
Interpretation:
Bullish Signal:
If the current price is above the VWAP, this indicates that the market trend is upward, which could be considered a buying opportunity.
Bearish Signal:
If the current price is below the VWAP, this indicates that the market trend is downward, which could be considered a selling signal.

Consolidation VWAP's [QuantVue]Introducing the Consolidation VWAP's Indicator , a powerful tool designed to identify consolidation periods in stock advance and automatically anchor three distinct VWAPs to key points within the consolidation.
Consolidation Period Identification:
The indicator automatically detects periods of consolidation or areas on the chart where a stock's price moves sideways within a defined range. This period can be seen as the market taking a "breather" as it digests the previous gains. Consolidations are important because they often act as a base for the next move, either continuing the previous uptrend or reversing direction.
Consolidation requirements can be customized by the user to match your instrument and timeframe.
Maximum Consolidation Depth
Minimum Consolidation Length
Maximum Consolidation Length
Prior Uptrend Amount
Anchored VWAP, or Anchored Volume-Weighted Average Price, is a technical analysis tool used to determine the average price of a stock weighted by volume, starting from a specific point in time chosen by the analyst.
Unlike traditional VWAP, which starts at the beginning of the trading session, the anchored VWAP allows traders to select any point on the chart, such as a significant event, price low, high, or a breakout, to begin the calculation.
VWAP incorporates price and volume in a weighted average and can be used to identify areas of support and resistance on the chart.
VWAP Anchored to Consolidation High: This VWAP is anchored at the highest price point within the identified consolidation period. It helps traders understand the
average price paid by buyers who entered at the peak of the consolidation.
VWAP Anchored to Consolidation Low: This VWAP is anchored at the lowest price point within the consolidation. It provides insights into the average price paid by
buyers who entered at the lowest point of the consolidation.
VWAP Anchored to Highest Volume in the Consolidation: This VWAP is anchored at the price level with the highest trading volume during the consolidation. It reflects the average price at
which the most trading activity occurred, often indicating a key support or resistance level.
The indicator also allows the trader to see past consolidation areas and previous anchored VWAP's.
Give this indicator a BOOST and COMMENT your thoughts!
We hope you enjoy.
Cheers!
Vwap Z-Score with Signals [UAlgo]The "VWAP Z-Score with Signals " is a technical analysis tool designed to help traders identify potential buy and sell signals based on the Volume Weighted Average Price (VWAP) and its Z-Score. This indicator calculates the VWAP Z-Score to show how far the current price deviates from the VWAP in terms of standard deviations. It highlights overbought and oversold conditions with visual signals, aiding in the identification of potential market reversals. The tool is customizable, allowing users to adjust parameters for their specific trading needs.
🔶 Features
VWAP Z-Score Calculation: Measures the deviation of the current price from the VWAP using standard deviations.
Customizable Parameters: Allows users to set the length of the VWAP Z-Score calculation and define thresholds for overbought and oversold levels.
Reversal Signals: Provides visual signals when the Z-Score crosses the specified thresholds, indicating potential buy or sell opportunities.
🔶 Usage
Extreme Z-Score values (both positive and negative) highlight significant deviations from the VWAP, useful for identifying potential reversal points.
The indicator provides visual signals when the Z-Score crosses predefined thresholds:
A buy signal (🔼) appears when the Z-Score crosses above the lower threshold, suggesting the price may be oversold and a potential upward reversal.
A sell signal (🔽) appears when the Z-Score crosses below the upper threshold, suggesting the price may be overbought and a potential downward reversal.
These signals can help you identify potential entry and exit points in your trading strategy.
🔶 Disclaimer
The "VWAP Z-Score with Signals " indicator is designed for educational purposes and to assist traders in their technical analysis. It does not guarantee profitable trades and should not be considered as financial advice.
Users should conduct their own research and use this indicator in conjunction with other tools and strategies.
Trading involves significant risk, and it is possible to lose more than your initial investment.

VWAP Suite, Session Cloud RevOverview
The VWAP Suite with Standard Deviation Strategy is a comprehensive indicator designed to help traders make informed trading decisions based on the Volume Weighted Average Price (VWAP) and its associated standard deviation bands. This indicator provides multiple VWAP calculations for different timeframes (Session, Day, Week, Month) and incorporates standard deviation bands to identify potential trade entry and exit points.
Components
VWAP Calculation:
Session VWAP: VWAP calculated based on the current trading session.
Day VWAP: VWAP calculated for the daily timeframe.
Week VWAP: VWAP calculated for the weekly timeframe.
Month VWAP: VWAP calculated for the monthly timeframe.
Standard Deviation Bands:
The indicator includes three standard deviation bands (StDev 1, StDev 2, and StDev 3) around the VWAP. These bands help identify the dispersion of price from the VWAP, providing insight into potential overbought or oversold conditions.
Additional VWAP Lines:
VWAP 2: An additional VWAP line with a customizable timeframe (Day, Week, Month).
VWAP 3: Another VWAP line for further analysis with a customizable timeframe (Day, Week, Month).
Strategy Description
The primary strategy implemented in this indicator revolves around the second standard deviation band (StDev 2). The key aspects of this strategy include:
Entry Points:
Long Entry: Consider entering a long position when the price moves below the lower StDev 2 band and then starts to revert back towards the VWAP. This indicates a potential oversold condition.
Short Entry: Consider entering a short position when the price moves above the upper StDev 2 band and then starts to revert back towards the VWAP. This indicates a potential overbought condition.
Exit Points:
Long Exit: Exit the long position when the price moves back up to the VWAP or the upper StDev 1 band, indicating a normalization of the price.
Short Exit: Exit the short position when the price moves back down to the VWAP or the lower StDev 1 band, indicating a normalization of the price.
Risk Management:
Set stop-loss levels slightly beyond the StDev 3 bands to protect against significant adverse price movements.
Use trailing stops to lock in profits as the price moves favorably.
Customization
The VWAP Suite allows for extensive customization, enabling traders to adjust the following settings:
VWAP Mode: Select the timeframe for the primary VWAP calculation (Session, Day, Week, Month).
Line Widths and Colors: Customize the line widths and colors for VWAP and standard deviation bands.
Fill Opacity: Adjust the opacity of the fill between standard deviation bands for better visual clarity.
Additional VWAPs: Enable and customize additional VWAP lines (VWAP 2 and VWAP 3) for further analysis.
VWAP DivergenceThe "VWAP Divergence" indicator leverages the VWAP Rolling indicator available in TradingView's library to analyze price and volume dynamics. This custom indicator calculates a rolling VWAP (Volume Weighted Average Price) and compares it with a Simple Moving Average (SMA) over a specified historical period.
Advantages:
1. Accurate VWAP Calculation: The VWAP Rolling indicator computes a VWAP that dynamically adjusts based on recent price and volume data. VWAP is a vital metric used by traders to understand the average price at which a security has traded, factoring in volume.
2. SMA Comparison: By contrasting the rolling VWAP from the VWAP Rolling indicator with an SMA of the same length, the indicator highlights potential divergences. This comparison can reveal shifts in market sentiment.
3. Divergence Identification: The primary purpose of this indicator is to detect divergences between the rolling VWAP from VWAP Rolling and the SMA. Divergence occurs when the rolling VWAP significantly differs from the SMA, indicating potential changes in market dynamics.
Interpretation:
1. Positive Oscillator Values: A positive oscillator (difference between rolling VWAP and SMA) suggests that the rolling VWAP, derived from the VWAP Rolling indicator, is above the SMA. This could indicate strong buying interest or accumulation.
2. Negative Oscillator Values: Conversely, a negative oscillator value indicates that the rolling VWAP is below the SMA. This might signal selling pressure or distribution.
3. Divergence Signals: Significant divergences between the rolling VWAP (from VWAP Rolling) and SMA can indicate shifts in market sentiment. For instance, a rising rolling VWAP diverging upwards from the SMA might suggest increasing bullish sentiment.
4. Confirmation with Price Movements: Traders often use these divergences alongside price action to confirm potential trend reversals or continuations.
Implementation:
1. Length Parameter: Adjust the Length input to modify the lookback period for computing both the rolling VWAP from VWAP Rolling and the SMA. A longer period provides a broader view of market sentiment, while a shorter period is more sensitive to recent price movements.
2. Visualization: The indicator plots the VWAP SMA Oscillator, which visually represents the difference (oscillator) between the rolling VWAP (from VWAP Rolling) and SMA over time.
3. Zero Line: The zero line (gray line) serves as a reference point. Oscillator values crossing above or below this line can be interpreted as bullish or bearish signals, respectively.
4. Contextual Analysis: Interpret signals from this indicator in conjunction with broader market conditions and other technical indicators to make informed trading decisions.
This indicator, utilizing the VWAP Rolling component, is valuable for traders seeking insights into the relationship between volume-weighted price levels and traditional moving averages, aiding in the identification of potential trading opportunities based on market dynamics.
