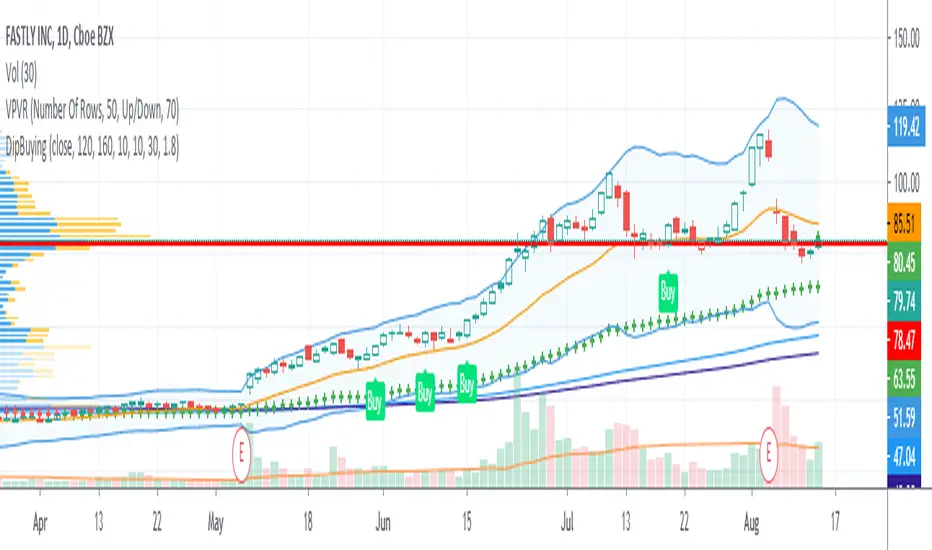
Nerd Dip Buying for StocksThis script is intended to generate BUY signals during pullbacks in stocks which are in the midst of mid to long-term uptrends. The ideal timeframe is Daily.
Signals should be acted upon at or near the close, or at open next bar.
I use 2 simple moving averages (SMA1 and SMA2) to determine whether the stock is currently in an uptrend. The default parameters are:
SMA1 = 120
SMA2 = 160
Buy signals are only produced when SMA1 is above SMA2.
As an additional filter I also use the Adaptive Moving Average (AMA) developed by Perry Kaufman. The settings are (10, 10, 30). Buy signals are allowed only when the bar closes above the AMA.
Lastly, the Buy signal itself is computed utilizing the Greatest Swing Value, a concept pioneered by Larry Williams in his book Long-Term Secrets To Short-Term Trading . You can control how often BUY signals appear by tweaking the parameter GSV Buy Factor . The smaller the number, the more often BUY signals appear. By default,
GSV Buy Factor = 1.8
This indicator has been developed with stocks trading in mind only, in particular US stocks. Feel free to apply it to other markets or asset classes and let me know the results. Thank you very much.
Stocktrading
Magic CandleThis indicator is very simple, but surprisingly effective, and I haven't found any mention of something similar, so here it is. I hope it helps you in your stock trading.
Someone made a comment in a trading room that the 8 am candle of the stock looked odd, so I quickly checked all the other stocks I had on my screen, and for all of them, the 8 am candle was just a little strange. What's more, is that the stock would often respond to the high and low values of that 8 am candle later on in the day. It turned out to be quite an important support and resistance level indicator for stocks which I've used in my trading ever since I discovered it.
After testing it out day after day on multiple stocks, I decided to write this indicator, which not only projects the high and low values of the 8 am candle, but also the previous day's closing price.
If you find that there's another "magic candle" out there for Forex or Crypto, please let me know!
You have the option to set the "magic candle" to another time, if you want to experiment with things.

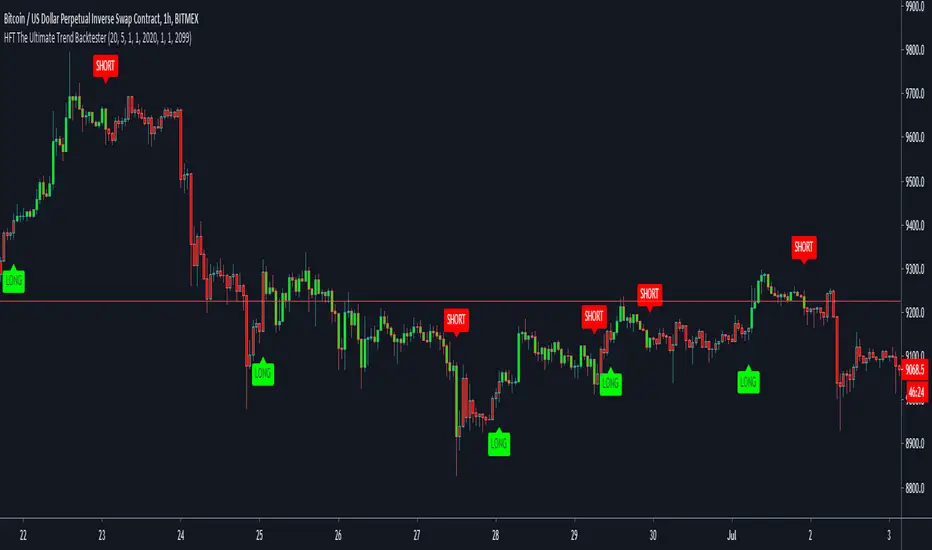
HFT The Ultimate Trend BacktesterThis is a trend following based strategy developed by HFT Research.
It works on Stocks, Forex and Cryptocurrency markets
This indicator comes fine tuned out of the box. It works on best on 15min, 1 hour and 4 hour time frames. It provides 3 separate entries for each of the time frames, providing you 12 different entry options.
Each time frame has the following options to choose from
You can use 1 hour settings on 15min chart however, it may not work the best.
Moderate entry will give you the modest amount of trades with modest amount of risk
Aggressive entry will give you wild entries and lots of action, if you are willing to babysit the trades, it might be an option for you
Conservative entry are best for those who want to automate the strategy or for those that don't have the time to trade the alerts actively
The backtester assumes the following;
- 1000$ capital
- 0.06% commission based on binance
- 1% risk meaning 100% equity on cross leverage
- Backtest results are starting from 2020
PpSignal Algorithmic trading system this strategy uses
1) trend
2) volatility
3) volume
Also, you can find in additional tools, rsi wilders on the chart and its standard deviation.
CFB composite fractal behavior and smoothed atr.
Candle converter MTF.
The strategy uses these four indicators to generate inputs and outputs.
Basically buy when cfb, rsi and atr go in the same direction upwards and the movement is accompanied by a rising volume (cfb green color and rsi Aqua ATR).
Idem in reverse for sell, when cfb, atra and rsi are giving a sell signal (Red color) and the volume is descending.
It is important that you also use other trading systems that you consider convenient. Support and resistance and also fibonacci levels all help to better trading.
Not all assets have or use the same configuration, for this, you must find the appropriate parameters with the variables, long length, short length, source, and period.
for example for btcusd the optimal parameters for me are:
long length = 2
short length = 2
signal length = 2
source = ohlc4
period = 9
It also has a take profit and stops loss tool in percentage.
remember to use parameters according to your tolerance as a trader or investor.
enjoy it
PD: you can write to me privately I have many optimizations and settings already done
este estrategia usa
1) trend
2)volatilidad
3)volumen
Tambien usted podrá encontrar en herramientas adicionales, rsi wilder on the chart y su desviación estándar.
CFB composite fractal behavior y atr suavizado.
Candle converter MTF.
La estrategia usa estos cuatro indicadores para generar entradas y salidas.
Básicamente buy cuándo cfb, rsi y atr van en la misma dirección hacia arriba y el movimiento está acompañado por un volumen ascendente (color verde cfb y rsi Aqua ATR).
Idem a la inversa para el sell, cuando cfb, atra y rsi están dando señal de venta (color Rojo) y el volumen es descendente.
Es importante que también use otros sistemas de trading que usted crea conveniente. Soporte y resistencia y también niveles fibonacci todo ayuda a un mejor trading.
No todos los activos tienen o usan la misma configuración para esto usted deberá encontrar los parámetros adecuado con las variables, long length, short length, source y period.
por ejemplo para btcusd los parámetros óptimos para mi son:
long length = 2
short length = 2
signal length = 2
source = ohlc4
period = 9
También posee una herramienta de take profit y stop lose en porcentaje.
recuerde usar parámetros acorde a su tolerancia como trader o inversor.
disfrutelo

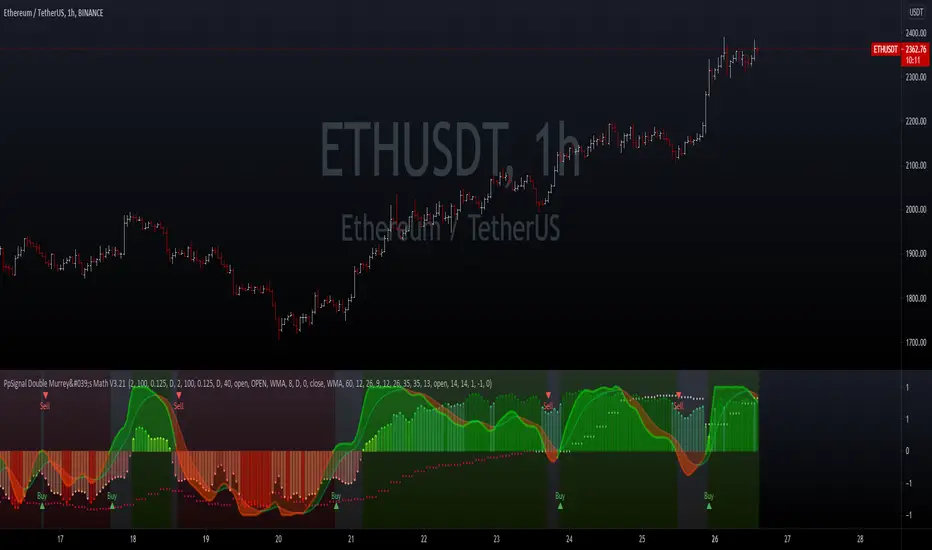
PpSIgnal Double Murrey's Math StrategyA forex indicator is a statistical tool that currency traders use to make judgments about the direction of a currency pair’s price action. Forex indicators come in many types, including leading indicators, lagging indicators, confirming indicators and so on. Popular forex indicators include moving averages, relative strength index (RSI) and average true range (ATR). A forex trader must choose the indicators that fit his or her trading strategy.
we added universal oscillator by elder and mtf in superior automatics time.
Buy when the oscillator Murray math is green and universal oscillator is green too.
Sell when the MM oscillator is red and universal oscillator is red too.
we added additional volume in bar indicator...enjoy it
PpSignal Variable Move Average V 3.0A Variable Moving Average is an exponential moving average that automatically adjusts the smoothing weight based on the volatility of the data series. The more volatile the data is, the more weight is given to the more recent values. The Variable Moving Average solves a problem with most moving averages.
Blue: Buy
Red: Sell
Gray: Indecision hold

PpSignal Parabolic SAR Of RSI OscillatorThis indicator is parabolic zar of rsi oscillator style .
Buy when the rsi on the char is blue and psar is gold color.
sell when the rsi on the char is red and psar is orange.

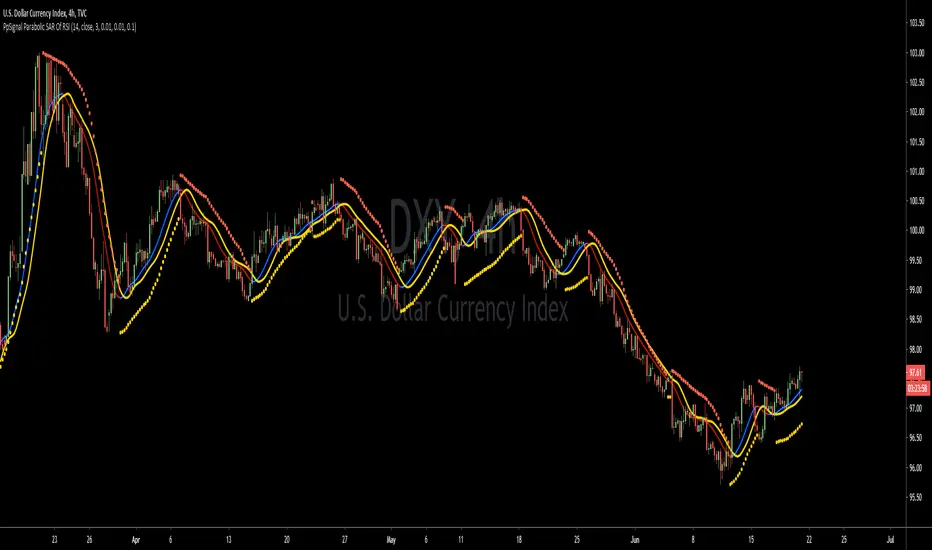
PpSignal Parabolic SAR Of RSIThis indicator is parabolic zar of rsi.
Buy when the rsi on the char is blue and psar is gold color.
sell when the rsi on the char is red an psar is orange.
PpSignal OSCILLATORThe Ppsignal oscillator is calculated based on LWMA and smoothed with the elder formula to avoid trending noise.
Each asset has its settings so you should go looking for the best set yourself.
Buy when the oscillator is yellow Sell when it is red.

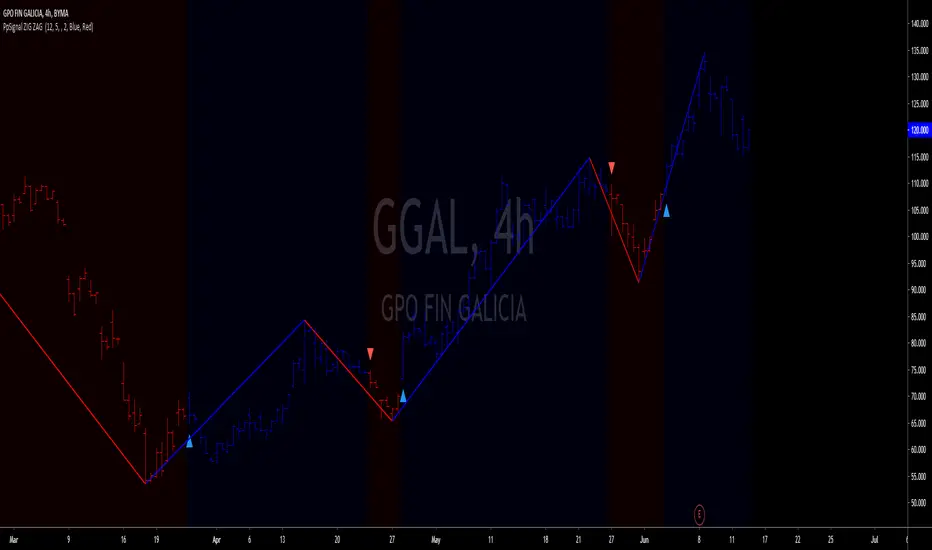
PpSigan ZigZag++The Zig Zag indicator plots points on the chart whenever prices reverse by a percentage greater than a pre-chosen variable. Straight lines are then drawn, connecting these points. The indicator is used to help identify price trends. It eliminates random price fluctuations and attempts to show trend changes. Zig Zag lines only appear when there is a price movement between a swing high and a swing low that is greater than a specified percentage; often 5%. By filtering minor price movements, the indicator makes trends easier to spot in all time frames.
Buy when the price is blue or green choose your favorite up color and arrow is up.
sell when the price is red or orange choose your favorite up color and arrow is up.
PpSignal Weis Volume & Volume in Bar V2.20This is an Advanced Weis Wave indicator which is based on Richard D. Wyckoff theory. It works in all time periods, range bar and tick bar charts and it can be applied to any market. The new Autowaves feature eliminates changing the parameters when switching time frames.
This indicator is adding the volumes of the corresponding price waves and draws a cumulative histogram. Each price wave is moving in a specific direction up or down until it reverses. In order for the indicator wave to reverse in the opposite direction, the price should exceed the number of points (pips*10) set in the indicator parameters. Therefore, the last wave repaints but the theory behind this trading method is forecasting where the market will go by reading mainly the previous waves.
The volume of the wave together with pip distance that the price has covered and the number of bars are displayed at the end of this wave. Speed Index is a new function noting the speed of the wave and can be displayed on the chart (the smaller this number is the faster the wave is and the larger this number is the slower the wave is)
Furthermore, an Alert (popup, email, push, sound) can be setup if the cumulative volume of the current wave exceeds a certain number specified in the parameters. An Alert can also be setup if Speed Index exceeds a specific value and/or is below a specific value.
Buy when the Weiss is aqua and sell when the Weiss is orange

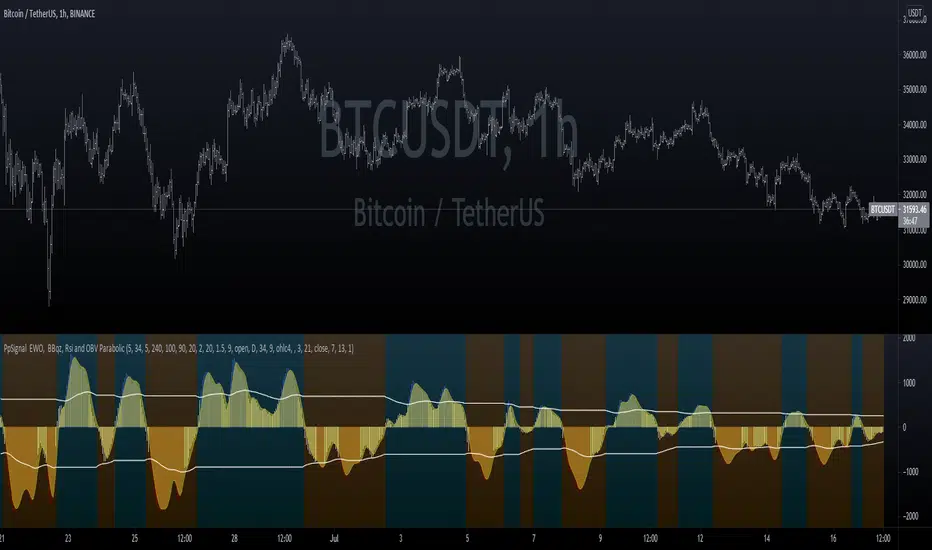
PpSignal EWO, BBqz, Rsi and OBV ParabolicEWO Break Band, bbsqeeze, rsi tdi and OBV of rsi all in one.
Buy when the oscillator change a color blue and sell when the oscillator changes color to red.
PpSignal On Balance Volume Reflex this indicator is On Balance Volume (OBV) and BB Stop with ema.
Buy: when the OBV is over Move average (gold) and BBstop is aqua.
Sell: when the OBV is below the moving average and BBstop is orange.
Check all time the tendency with channel support and resistance and Fibonacci levels.

MACD Bull Crossover and RSI Oversold 5 Candles Ago-Long StrategyHello everyone, I've been having a great time perfecting this strategy for a few weeks now. I finally feel like it's time to release it to the public and share what I have been working on.
This strategy only enters a long trade when the MACD crosses over the signal line and the RSI was oversold looking back 5 candles ago. The logic behind this is to wait for RSI to enter the oversold territory, and then when the market starts to recovery the MACD will crossover telling us the sell off is over.
This strategy will close once these 2 conditions are met.
1. MACD Histogram is above 0 and MACD crosses under the signal line.
2. RSI was overbought 5 previous candles ago.
In the strategies settings, you'll be able to enable visual stop-loss and profit levels and change those levels to what you like, enable up to 5 EMA'S,
ADDONS That Affect Strategy:
* Enable visual stop-loss and profit levels as soon as a buy signal is triggered.
* Modify stop-loss and profit levels.
* Modify RSI oversold and RSI overbought levels.
* Modify MACD Fast and Slow moving average.
ADDONS That Do Not Affect Strategy:
* Enable up to 5 EMA's. (This will not affect strategy, and is the only purpose is for people who like following EMA's.)
Thank you for taking the time to try my strategy. I hope you have the best success. I will be making a short strategy, and alerts for this strategy soon. Follow me for updates!

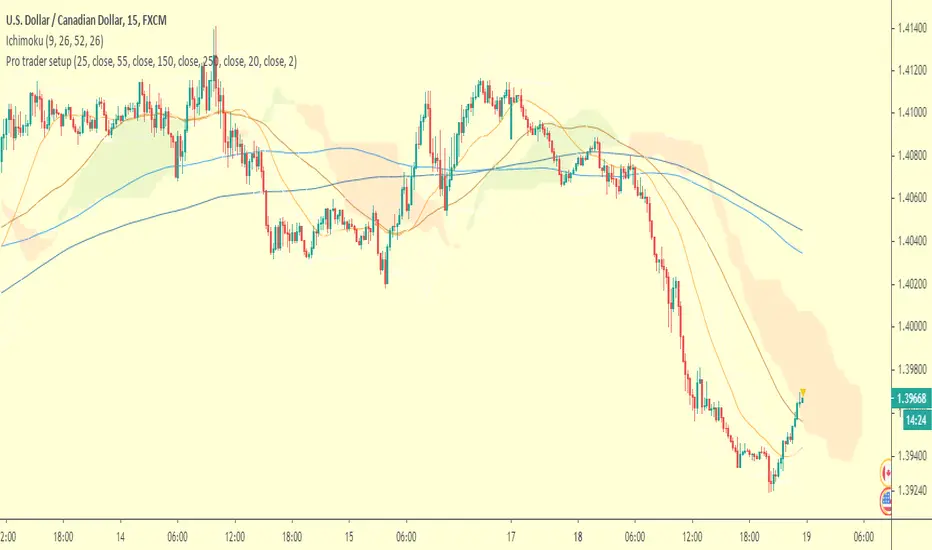
Pro Trader SETUPThe indicator comes with 4 Moving Averages
Default 25 55 150 250
Support/Resistance
ATR breakout signals (use on higher TFs)
Bollinger Bands
PpSignal CFB Version 2 Composite Fractal Behavior
Este indicador fue diseñado para filtrar acciones de precios menores para una visión más clara de las tendencias.
Inspirado en el filtro de volatilidad de QQE, este filtro aplica el proceso directamente al precio en lugar de a un RSI suavizado.
Range Filter y las bandas ahora se calculan en una función singular.
Ahora hay dos métodos de cálculo diferentes para el filtro. Seleccione el tipo que desea usar a través de la entrada "Tipo de filtro". Tipo 1 es la fórmula original.
Múltiples métodos de tamaño de rango ahora están disponibles. Puede elegir entre las siguientes escalas:
- Puntos
- Pips (Funciona mejor con pares de divisas, obviamente)
- ticks
-% del precio
- ATR
- Cambio promedio (predeterminado. Este es el método de dimensionamiento original).
- Desviación Estándar
- Absoluto (valor numérico absoluto)
- El suavizado con eldher de rango ahora es opcional, y puede especificar su longitud de suavizado. El suavizado solo afecta a las escalas dinámicas (ATR, cambio promedio y desviación estándar).
- El movimiento del filtro ahora se puede determinar usando mechas o precio de cierre. Esto se puede especificar a través de la entrada .
Bollinger Band RSI Wilder
Las bandas de volatilidad se calcularon teniendo como base el rsi wilder.
Básicamente uno estaria comparado con tendencia y volatilidad
Compre cuando el el CFB da señal de Compra color verde y las bandas de volatilidad se pongan de color azul...venda cuando cfb se pone rojo y las bandas de volatilidad se ponen celestes.
This indicator was designed to filter out lower price actions for a clearer view of trends. Inspired by QQE's volatility filter, this filter applies the process directly to price rather than a smoothed RSI. Range Filter and bands are now calculated in a singular function. There are now two different calculation methods for the filter. Select the type you want to use through the "Filter type" entry. Type 1 is the original formula. Multiple range size methods are now available.
You can choose between the following scales:
- Points
- Pips (Works best with currency pairs, obviously)
- Ticks -% of the price - ATR - Average change (default. This is the original sizing method). - Standard Deviation
- Absolute (absolute numerical value)
- Smoothing with the range elder is now optional, and you can specify its smoothing length.
Smoothing only affects dynamic scales (ATR, average change, and standard deviation).
- Filter movement can now be determined using highlights or closing price. This can be specified through the input.
Bollinguer Bands
Volatility bands were calculated based on the rsi wilder. Basically one would be compared to trend and volatility Buy when CFB gives
Buy signal green color and volatility bands turn blue ... sell when cfb turns red and volatility bands turn light blue.

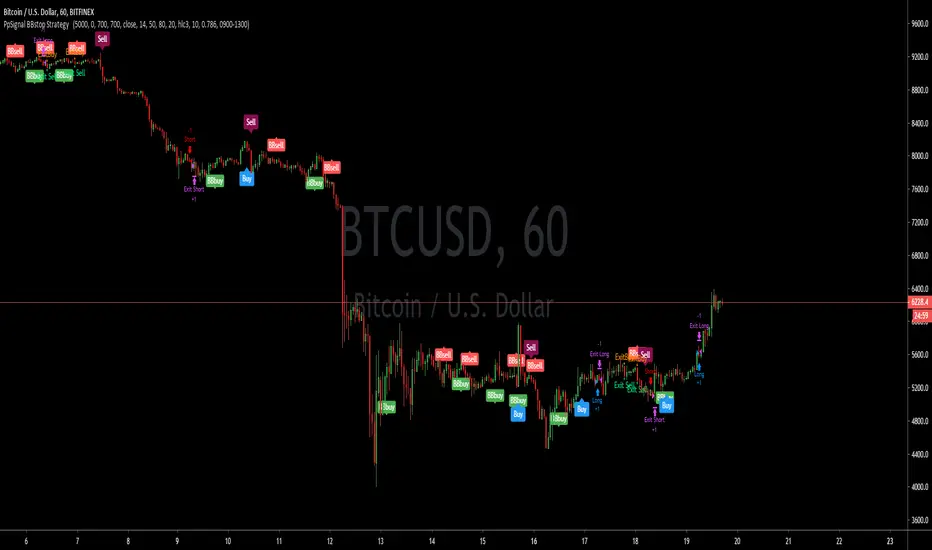
PpSignal BBstop Strategy strategy based on rsi of ma, in the example with btc usd we have as tp 1000 trailing stop 700, but you should adopt the money management to your criteria.
it has an alarm system when you see bbbuy or bbsell is a pre-notice only buy when the signal is Buy in blue or sell in maroon, it also has a buy exit and sell exit warning.
PpSignal drake delay oscillator GritasIt is a technique, when the drake oscillator moving averages (Drake Daly Statocastico) cross up you must buy and the histogram is painted in a green color .... when the drake oscillator crosses down and the histogram is painted red you must to sell.

BEST Algorithm Builder STOCKSHello traders 👋
I. 💎 SCRIPTS ACCESS AND TRIALS 💎
1. Every trial request access has to be done through my website.
2. My website URL is in this script signature at the very bottom (you'll have to scroll down a bit and going past the long description) and in my profile status available here: Daveatt profile status
3. Many video tutorials explaining clearly how all our indicators work are available on our website > guides section and also on website forum + Youtube
4. You may also contact me directly for more information regarding the trading method included in the indicator or how to access it
II. Forewords
(Screenshot based on $FCEL - FUELCELL ENERGY Inc.)
This indicator is for the SWING traders looking for fixed entries based on our proprietary trading method. It's a nice complement to any intraday method
We've been working on it for months and releasing now for our subscribers.
We mostly trade the US stocks with it due to personal preference but it's working also with other international stocks.
All stocks sectors (tech, aerospace, food, energy, financial, healthcare, ...) are eligible.
We've seen quite great signals with penny stocks/biotech/tech stocks.
III. Optimized system for lowering risk/capturing most of the opportunities
We worked hard on reducing the risk as much as we could.
The built-in hard-exit (also called invalidation) system does a huge job in exiting a position way before a Stop Loss will get hit
$TSLA (TESLA)
$SAVA (CASSAVA SCIENCES)
IV. Trade Manager and compatible with dynamic alerts
It includes :
- our proprietary method with fixed entries
- a hard exit system (built-in stop-loss)
- multiple options for user-defined stop-loss/take-profit settings (price value, distance in pips, percentage, trailing, ...)
- 🔔 Compatible with dynamic alerts 🔔
Dynamic alerts are bringing automated trading to a whole new level. The third-party solutions capturing TradingView alerts are able to use them.
- Algorithmic Supports and Resistances used as safeguards and take profit zones
Final words
We made it as simple as we could (to be honest it's a very simple system for the end-user) - even with several hundreds of calculations in the indicator.
Please hit me up for any questions/feedback/comments
Become the BEST trader you deserve to be
Dave

PpSignal RSI Haiken ashiPpSignal rsi Heiken Ashi is rsi smooth by elder formula and Heiken Ashi calculation.
Buy when the price is above on the RSI offset line (yellow).
Sell when the price is bellowed of RSI offset line (yellow).
for best results use the chart in bars style and turn on the bar color.

PpSignaldouble rsi cross alertthis indicator is rsi open and rsi close in the same chart and qqe move average.
open is green rsi line and close is red, when close is above open and qqe ma is blue for examples is a good signal, and vice-versa.
have got oversold and overbought background alert too.
Consider rsi divergences and the trend before entering to the market
Buy when rsi is oversold and qqe ma is in blue color.
sell when the rsi is overbought red background and qqe is red.

Entry Point IndicatorIndicator detects entry point on differents markets and timeframes
Suggested timeframes: from 1 hour to 1-week chart

MesattoTrend v1 - MesattoCapitalWelcome to MesattoTrend v1
How to use it:
1- VWAP(pink line)
BUY Scenario, VWAP will act as your base, it has to be below price to be a valid buy.
SELL Scenario, VWAP will be higher and act as resistance.
2- Support/Resistance lines will give you an idea on where prices
might pullback or increase in volume for a breakout.
3- Supertrend(green/red cross)
Supertrend will act as your Stop point. Use it as reference together with
support/resist lines to set your stoploss/gain
Reminder: Use it at your own risk, an indicator serves to assist you on taking a trade, always look for confimation before trading.
Link to my bottom indicator
comment below if you would like more adjustments.
