AI Swing Master by Pooja🌟 AI Swing Master by Pooja — Multi-EMA Trend Intelligence Suite
AI Swing Master is a refined swing-trend engine built to highlight structural trend alignment, momentum transitions, and higher-timeframe confluence — all within a clean and minimal interface.
This tool is designed for traders who want clarity, structure, and disciplined trend interpretation without clutter.
⚡ Core Highlights
🔵 SB — Strong Buy
Triggers on meaningful bullish momentum shifts when major EMAs cross in favor of the trend.
• Non-repetitive
• Clean and decisive
• Highlights momentum transitions
🔴 SS — Strong Sell
Identifies bearish momentum shifts through downside EMA transitions.
• Useful for trend reversals
• Helps avoid late entries
• Zero duplicate signals
🟡 GB — Golden Buy (First Structural Alignment)
Appears the first time this structure forms:
EMA 50 ≥ EMA 100 ≥ EMA 200
This highlights a clean, long-term bullish structure.
• One-time structural confirmation
• Ideal for swing & positional traders
• High-signal quality, low noise
📊 Triple-EMA Trend Framework (50/100/200)
The script plots three institutional-grade EMAs:
EMA 50 → Short-term momentum
EMA 100 → Medium-term flow
EMA 200 → Long-term trend foundation
This layered structure gives a clear view of:
✔ Trend health
✔ Pullbacks vs reversals
✔ Momentum expansion or compression
🧭 MTF Trend Dashboard (Premium TV-Style Panel)
A compact, elegant dashboard showing trend direction + % performance for:
TF Trend Performance
4H 📈/📉/➖ %
1D 📈/📉/➖ %
1W 📈/📉/➖ %
1M 📈/📉/➖ %
3M 📈/📉/➖ %
6M 📈/📉/➖ %
1Y 📈/📉/➖ %
Trend icons:
📈 Bull
📉 Bear
➖ Side
Perfect for quick bias confirmation without switching timeframes.
🛠️ Alerts Included (Ready for Automation)
Use alert conditions for:
SB – Strong Buy
SS – Strong Sell
GB – Golden Buy
Fully compatible with:
✔ Push notifications
✔ Email alerts
✔ Webhooks (where allowed)
🎯 Best For
This indicator works beautifully for:
Swing traders
Positional trend riders
Intraday traders using HTF confluence
Option traders needing directional bias
Trend-following systems
It does not predict price — it visualizes trend structure to support disciplined decision-making.
⚠️ Disclaimer
This tool is for technical analysis only.
It does not offer financial advice, does not guarantee outcomes, and should not be used as a sole decision source.
All trading decisions are your own responsibility.
🔐 ACCESS
This version is an Invite-Only Script.
Access is granted manually.
🛡 Support
This is an invite-only indicator.
Approved users may contact the author via the “Author’s Instructions” section on TradingView for help or usage guidance.
Stocktrading

Stock Fundamentals (Zeiierman)█ Overview
Stock Fundamentals (Zeiierman) is designed for investors who want a clear, visual, and efficient way to understand a company’s overall fundamental profile directly on the chart. Instead of digging through dozens of ratios or scanning multiple websites, the tool combines fundamental data, price behavior, and analyst expectations into a single intuitive visual system that can be understood at a glance.
A multi-axis “fundamental spider chart” presents the company across six core dimensions: value, quality, financial health, future prospects, dividend strength, performance, and volatility behavior. Each axis represents a structural aspect of company quality, allowing you to see strengths, weaknesses, and imbalances in one immediate view.
Alongside the spider chart, a compact PE and Return panel shows where current valuation and analyst expectations sit within their historical ranges, giving context for whether the stock is cheap, expensive, stretched, or positioned for growth.
The goal is simple: make fundamental analysis accessible, fast, and insightful for every investor, from beginner to advanced. Stock Fundamentals (Zeiierman) transforms dense data into a structured visual profile suited for stocks on the daily timeframe, allowing you to interpret company quality as easily as you read price action.
Important: This script is designed for STOCK symbols on the DAILY timeframe. On anything else, it will show an explicit warning instead of a spider chart.
⚪ Why This One Is Unique
Most fundamental overlays rely on static ratios or simple tables, but this script takes a far more comprehensive approach. It builds a multi-dimensional scoring system across Value, Health, Future, Dividend, Performance, and Volatility, then maps these dimensions into a geometric spider chart with clearly labeled axes so you can interpret company quality visually rather than through scattered numbers.
An Overall Score from 0 to 10 is computed by aggregating these dimensions and is displayed using a smooth gradient from your selected color palette. Performance scoring is based on yearly return statistics such as returns, volatility, Sharpe ratio, max drawdown, and alpha versus a benchmark, giving the score a foundation in real multi-year behavior rather than short-term noise.
Dividend quality is evaluated through yield, growth, payout behavior, free-cash-flow coverage, leverage, and the company’s EPS trend, creating a deeper view of dividend strength than raw yield alone. Future expectations are incorporated through a forward-looking model that compares projected earnings and revenue paths to the current price using a nonlinear scoring method.
A dedicated PE Sentiment and Return Estimate panel places the stock’s PE, current price, and analyst targets along a graded strip, helping you see valuation and expected upside or downside in a meaningful context.
█ Main Features
⚪ 1. Company Overview Score
Stock Fundamentals (Zeiierman) evaluates a company across six core dimensions: Value, Health, Future, Dividend, Performance, and Volatility. Each dimension is scored individually and combined into a single Overall Score (0–10) displayed beside the spider chart. The score cell uses a smooth gradient to reflect weak-to-strong company quality at a glance.
⚪ 2. Fundamental spider chart Visualization
The individual scores are mapped into a six-axis polygon, known as the fundamental spider chart. Each arm of the spider chart represents one of the core dimensions:
Dividend – quality, growth, coverage, and stability
Performance – multi-year risk-adjusted returns
Volatility – long-term price stability
Value – earnings yield, ROIC, and valuation appeal
Health – solvency, balance-sheet strength, and overall safety
Future – forward growth potential relative to current price
The axes extend from weak at the center to strong at the outer boundary, creating a color-filled shape that makes strengths, weaknesses, and imbalances instantly visible. The spider chart and the overall score work together to provide a fast, intuitive snapshot of company fundamentals.
⚪ 3. PE Sentiment Bar
A horizontal PE Sentiment bar shows where the company’s current P/E sits within its historical low-to-high range. The bar is color-graded to indicate whether the valuation leans cheap or expensive, with a marker precisely showing today’s position.
⚪ 4. Return Estimate Bar
The Return Estimate bar compares the current price against analyst expectations:
lowest target
highest target
average target
current price marker
A percentage estimate displays potential upside or downside to the average target. The bar is visually graded using the same palette for fast interpretation.
█ How to Use
⚪ Quick Stock Screening
Investors can rapidly assess company quality before deep research, saving significant time.
⚪ Comparing Opportunities
Easily compare two or more companies using their overall scores and key sentiment visuals.
⚪ Portfolio Reassessment
Use the Stock Fundamentals to monitor existing holdings and identify potential risks or strong performers.
⚪ Sentiment-Based Entries
Combine PE Sentiment and Return Estimate data to evaluate whether a stock is currently undervalued or overextended.
█ How It Works
⚪ Fundamental Dimensions and Scoring
Stock Fundamentals (Zeiierman) evaluates a company across six primary dimensions: Value, Health, Future, Dividend, Performance, and Volatility. Each dimension is assessed through its underlying behaviors rather than a single ratio, producing a more balanced and realistic view of company strength.
Value reflects how attractive the company is relative to its earnings power and capital efficiency.
Health measures balance-sheet strength, operational resilience, and the company’s ability to withstand financial stress.
Future estimates the growth potential implied by projected business expansion versus current pricing.
Dividend evaluates reliability, sustainability, and the stability of historical payouts.
Performance summarizes long-term return quality and risk-adjusted behavior.
Volatility indicates the consistency of price behavior, highlighting stability versus choppiness.
Each category is converted into a normalized score and combined into an overall weighted score (0–10), providing a fast yet reliable snapshot of company quality.
⚪ Value Engine
The Value dimension reflects both the company’s earnings attractiveness and how effectively it uses capital. Instead of relying on a single valuation ratio, the engine blends multiple valuation signals with an estimate of capital efficiency, producing a stable value intensity score. This approach rewards companies that combine strong earnings power with efficient capital use, while preventing extreme outliers from dominating.
⚪ Health Engine
The Health dimension evaluates how structurally sound the business is. It draws from indicators that capture financial resilience, balance-sheet strength, stability, and operational robustness. For financial institutions or bank-like profiles, the system shifts toward metrics that emphasize asset efficiency and solvency buffers. The result is a single robustness score that adapts to the company’s business model.
⚪ Performance Engine
Performance is based on long-term behavior rather than short-term swings. The system evaluates multi-year return characteristics, consistency, risk-adjusted efficiency, and resilience during adverse market periods. Each of these behaviors is transformed into a smooth score, then combined into a single Performance dimension that reflects “quality of returns,” not just raw gains.
⚪ Dividend Engine
The Dividend dimension assesses both reward and reliability. It considers payout behavior over several years, historical stability, growth tendencies, coverage strength, and overall sustainability. It also evaluates whether the company’s financial structure supports long-term dividends rather than simply rewarding high yield. All of these factors combine into a dividend score that balances attractiveness with durability.
⚪ Future Growth Engine
The Future dimension estimates how well the company’s projected business expansion aligns with current price levels. It builds a simplified projection of growth potential and assesses whether that trajectory reasonably supports the stock’s valuation. The closer the company appears to “growing into” its price, the higher the future score. This dimension effectively acts as a growth runway estimator.
⚪ Volatility Node
The Volatility dimension reflects how stable or turbulent the stock has been over a broad timeframe. Its purpose is descriptive rather than judgmental: a high volatility score indicates choppy behavior, while a lower score suggests consistency. Although this measurement is displayed as part of the spider chart, it is intentionally excluded from the Overall Score to avoid penalizing growth-oriented or cyclical companies unfairly.
⚪ PE Sentiment
The company’s current P/E ratio is placed within its historical low-to-high range. The panel uses a smooth gradient from “cheap” to “expensive,” with a clear marker showing exactly where today’s valuation sits relative to past conditions.
⚪ Return Estimate
Analyst expectations are displayed on a similar range-based strip. Markers show the lowest, highest, and average analyst targets, alongside a marker for the current price. A projected percentage return is calculated relative to consensus expectations, offering a simple visual cue for whether analysts see meaningful upside or downside.
-----------------
Disclaimer
The content provided in my scripts, indicators, ideas, algorithms, and systems is for educational and informational purposes only. It does not constitute financial advice, investment recommendations, or a solicitation to buy or sell any financial instruments. I will not accept liability for any loss or damage, including without limitation any loss of profit, which may arise directly or indirectly from the use of or reliance on such information.
All investments involve risk, and the past performance of a security, industry, sector, market, financial product, trading strategy, backtest, or individual's trading does not guarantee future results or returns. Investors are fully responsible for any investment decisions they make. Such decisions should be based solely on an evaluation of their financial circumstances, investment objectives, risk tolerance, and liquidity needs.

Rebound Sigma Pro - IndicatorOverview
Rebound Sigma Pro is a mean-reversion indicator that detects statistically oversold conditions in trending markets.
It helps traders identify potential short-term rebounds based on momentum exhaustion and volatility-adjusted entry zones.
Concept
The indicator combines two quantitative components:
Short-term momentum to detect short-term exhaustion
Trend filter to ensure setups align with the long-term direction
When a stock in an uptrend becomes temporarily oversold, a limit-entry signal is plotted.
The trade is then tracked until short-term conditions normalize or a time-based exit occurs.
Visual Signals
Green Triangle: Suggests placing a limit order for the next session
Green Circle: Confirms entry was filled
Red Triangle: Signals an exit for the next session’s open
Orange Background: Pending order
Green Background: Position active
Red Background: Exit phase
Yellow Line: Entry reference price
User Inputs
Limit Entry (% below previous close) – Default 1 %
Use Limit Entry – Switch between limit or market entries
Enable Time Exit – Optional holding-period constraint
Maximum Holding Days
All other internal parameters (momentum length, filters) are pre-configured.
Alerts
Limit Order Signal: New setup detected
Entry Confirmed: Order filled
Exit Signal: Exit expected next day
Usage
Designed for liquid equities and ETFs
Works best in confirmed uptrends
Backtesting encouraged to adapt parameters per symbol and timeframe
Notes
Not an automated strategy; manual order execution required
Past behavior does not imply future performance
Always apply sound position sizing and risk management
Disclaimer
This indicator is provided for educational and analytical purposes only.
It does not constitute financial advice or performance assurance.

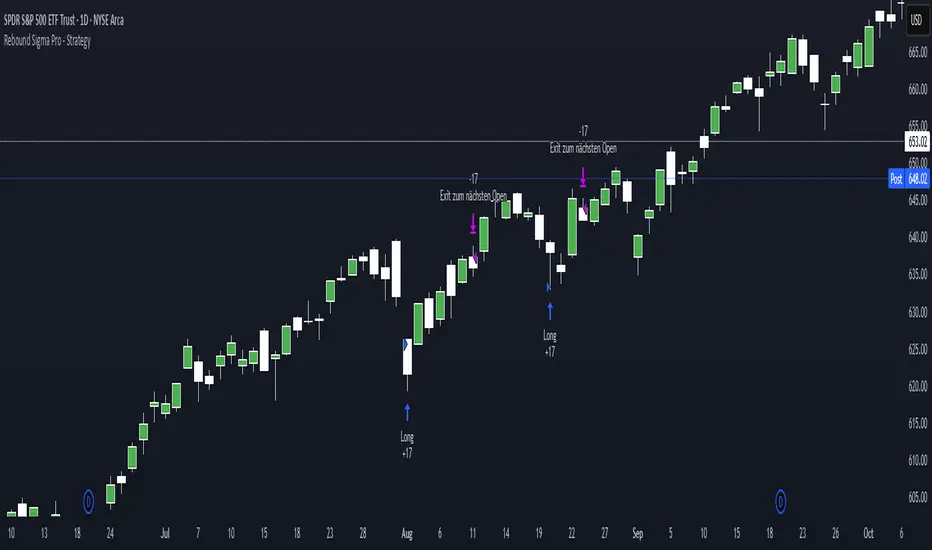
Rebound Sigma Pro - StrategyOverview
Rebound Sigma Pro is a mean-reversion indicator that detects statistically oversold conditions in trending markets.
It helps traders identify potential short-term rebounds based on momentum exhaustion and volatility-adjusted entry zones.
Concept
The indicator combines two quantitative components:
Short-term momentum to detect short-term exhaustion
Trend filter to ensure setups align with the long-term direction
When a stock in an uptrend becomes temporarily oversold, a limit-entry signal is plotted.
The trade is then tracked until short-term conditions normalize or a time-based exit occurs.
Visual Signals
Green Triangle: Suggests placing a limit order for the next session
Green Circle: Confirms entry was filled
Red Triangle: Signals an exit for the next session’s open
Orange Background: Pending order
Green Background: Position active
Red Background: Exit phase
Yellow Line: Entry reference price
User Inputs
Limit Entry (% below previous close) – Default 1 %
Use Limit Entry – Switch between limit or market entries
Enable Time Exit – Optional holding-period constraint
Maximum Holding Days
All other internal parameters (momentum length, filters) are pre-configured.
Alerts
Limit Order Signal: New setup detected
Entry Confirmed: Order filled
Exit Signal: Exit expected next day
Usage
Designed for liquid equities and ETFs
Works best in confirmed uptrends
Backtesting encouraged to adapt parameters per symbol and timeframe
Notes
Not an automated strategy; manual order execution required
Past behavior does not imply future performance
Always apply sound position sizing and risk management
Disclaimer
This indicator is provided for educational and analytical purposes only.
It does not constitute financial advice or performance assurance.
DYNAMIC TRADING DASHBOARDStudy Material for the "Dynamic Trading Dashboard"
This Dynamic Trading Dashboard is designed as an educational tool within the TradingView environment. It compiles commonly used market indicators and analytical methods into one visual interface so that traders and learners can see relationships between indicators and price action. Understanding these indicators, step by step, can help traders develop discipline, improve technical analysis skills, and build strategies. Below is a detailed explanation of each module.
________________________________________
1. Price and Daily Reference Points
The dashboard displays the current price, along with percentage change compared to the day’s opening price. It also highlights whether the price is moving upward or downward using directional symbols. Alongside, it tracks daily high, low, open, and daily range.
For traders, daily levels provide valuable reference points. The daily high and low are considered intraday support and resistance, while the median price of the day often acts as a pivot level for mean reversion traders. Monitoring these helps learners see how price oscillates within daily ranges.
________________________________________
2. VWAP (Volume Weighted Average Price)
VWAP is calculated as a cumulative average price weighted by volume. The dashboard compares the current price with VWAP, showing whether the market is trading above or below it.
For traders, VWAP is often a guide for institutional order flow. Price trading above VWAP suggests bullish sentiment, while trading below VWAP indicates bearish sentiment. Learners can use VWAP as a training tool to recognize trend-following vs. mean reversion setups.
________________________________________
3. Volume Analysis
The system distinguishes between buy volume (when the closing price is higher than the open) and sell volume (when the closing price is lower than the open). A progress bar highlights the ratio of buying vs. selling activity in percentage.
This is useful because volume confirms price action. For instance, if prices rise but sell volume dominates, it can signal weakness. New traders learning with this tool should focus on how volume often precedes price reversals and trends.
________________________________________
4. RSI (Relative Strength Index)
RSI is a momentum oscillator that measures price strength on a scale from 0 to 100. The dashboard classifies RSI readings into overbought (>70), oversold (<30), or neutral zones and adds visual progress bars.
RSI helps learners understand momentum shifts. During training, one should notice how trending markets can keep RSI extended for longer periods (not immediate reversal signals), while range-bound markets react more sharply to RSI extremes. It is an excellent tool for practicing trend vs. range identification.
________________________________________
5. MACD (Moving Average Convergence Divergence)
The MACD indicator involves a fast EMA, slow EMA, and signal line, with focus on crossovers. The dashboard shows whether a “bullish cross” (MACD above signal line) or “bearish cross” (MACD below signal line) has occurred.
MACD teaches traders to identify trend momentum shifts and divergence. During practice, traders can explore how MACD signals align with VWAP trends or RSI levels, which helps in building a structured multi-indicator analysis.
________________________________________
6. Stochastic Oscillator
This indicator compares the current close relative to a range of highs and lows over a period. Displayed values oscillate between 0 and 100, marking zones of overbought (>80) and oversold (<20).
Stochastics are useful for students of trading to recognize short-term momentum changes. Unlike RSI, it reacts faster to price volatility, so false signals are common. Part of the training exercise can be to observe how stochastic “flips” can align with volume surges or daily range endpoints.
________________________________________
7. Trend & Momentum Classification
The dashboard adds simple labels for trend (uptrend, downtrend, neutral) based on RSI thresholds. Additionally, it provides quick momentum classification (“bullish hold”, “bearish hold”, or neutral).
This is beneficial for beginners as it introduces structured thinking: differentiating long-term market bias (trend) from short-term directional momentum. By combining both, traders can practice filtering signals instead of trading randomly.
________________________________________
8. Accumulation / Distribution Bias
Based on RSI levels, the script generates simplified tags such as “Accumulate Long”, “Accumulate Short”, or “Wait”.
This is purely an interpretive guide, helping learners think in terms of accumulation phases (when markets are low) and distribution phases (when markets are high). It reinforces the concept that trading is not only directional but also involves timing.
________________________________________
9. Overall Market Status and Score
Finally, the dashboard compiles multiple indicators (VWAP position, RSI, MACD, Stochastics, and price vs. median levels) into a Market Score expressed as a percentage. It also labels the market as Overbought, Oversold, or Normal.
This scoring system isn’t a recommendation but a learning framework. Students can analyze how combining different indicators improves decision-making. The key training focus here is confluence: not depending on one indicator but observing when several conditions align.
Extended Study Material with Formulas
________________________________________
1. Daily Reference Levels (High, Low, Open, Median, Range)
• Day High (H): Maximum price of the session.
DayHigh=max(Hightoday)DayHigh=max(Hightoday)
• Day Low (L): Minimum price of the session.
DayLow=min(Lowtoday)DayLow=min(Lowtoday)
• Day Open (O): Opening price of the session.
DayOpen=OpentodayDayOpen=Opentoday
• Day Range:
Range=DayHigh−DayLowRange=DayHigh−DayLow
• Median: Mid-point between high and low.
Median=DayHigh+DayLow2Median=2DayHigh+DayLow
These act as intraday guideposts for seeing how far the price has stretched from its key reference levels.
________________________________________
2. VWAP (Volume Weighted Average Price)
VWAP considers both price and volume for a weighted average:
VWAPt=∑i=1t(Pricei×Volumei)∑i=1tVolumeiVWAPt=∑i=1tVolumei∑i=1t(Pricei×Volumei)
Here, Price_i can be the average price (High + Low + Close) ÷ 3, also known as hlc3.
• Interpretation: Price above VWAP = bullish bias; Price below = bearish bias.
________________________________________
3. Volume Buy/Sell Analysis
The dashboard splits total volume into buy volume and sell volume based on candle type.
• Buy Volume:
BuyVol=Volumeif Close > Open, else 0BuyVol=Volumeif Close > Open, else 0
• Sell Volume:
SellVol=Volumeif Close < Open, else 0SellVol=Volumeif Close < Open, else 0
• Buy Ratio (%):
VolumeRatio=BuyVolBuyVol+SellVol×100VolumeRatio=BuyVol+SellVolBuyVol×100
This helps traders gauge who is in control during a session—buyers or sellers.
________________________________________
4. RSI (Relative Strength Index)
RSI measures strength of momentum by comparing gains vs. losses.
Step 1: Compute average gains (AG) and losses (AL).
AG=Average of Upward Closes over N periodsAG=Average of Upward Closes over N periodsAL=Average of Downward Closes over N periodsAL=Average of Downward Closes over N periods
Step 2: Calculate relative strength (RS).
RS=AGALRS=ALAG
Step 3: RSI formula.
RSI=100−1001+RSRSI=100−1+RS100
• Used to detect overbought (>70), oversold (<30), or neutral momentum zones.
________________________________________
5. MACD (Moving Average Convergence Divergence)
• Fast EMA:
EMAfast=EMA(Close,length=fast)EMAfast=EMA(Close,length=fast)
• Slow EMA:
EMAslow=EMA(Close,length=slow)EMAslow=EMA(Close,length=slow)
• MACD Line:
MACD=EMAfast−EMAslowMACD=EMAfast−EMAslow
• Signal Line:
Signal=EMA(MACD,length=signal)Signal=EMA(MACD,length=signal)
• Histogram:
Histogram=MACD−SignalHistogram=MACD−Signal
Crossovers between MACD and Signal are used in studying bullish/bearish phases.
________________________________________
6. Stochastic Oscillator
Stochastic compares the current close against a range of highs and lows.
%K=Close−LowestLowHighestHigh−LowestLow×100%K=HighestHigh−LowestLowClose−LowestLow×100
Where LowestLow and HighestHigh are the lowest and highest values over N periods.
The %D line is a smooth version of %K (using a moving average).
%D=SMA(%K,smooth)%D=SMA(%K,smooth)
• Values above 80 = overbought; below 20 = oversold.
________________________________________
7. Trend and Momentum Classification
This dashboard generates simplified trend/momentum logic using RSI.
• Trend:
• RSI < 40 → Downtrend
• RSI > 60 → Uptrend
• In Between → Neutral
• Momentum Bias:
• RSI > 70 → Bullish Hold
• RSI < 30 → Bearish Hold
• Otherwise Neutral
This is not predictive, only a classification framework for educational use.
________________________________________
8. Accumulation/Distribution Bias
Based on extreme RSI values:
• RSI < 25 → Accumulate Long Bias
• RSI > 80 → Accumulate Short Bias
• Else → Wait/No Action
This helps learners understand the idea of accumulation at lows (strength building) and distribution at highs (profit booking).
________________________________________
9. Overall Market Status and Score
The tool adds up 5 bullish conditions:
1. Price above VWAP
2. RSI > 50
3. MACD > Signal
4. Stochastic > 50
5. Price above Daily Median
BullishScore=ConditionsMet5×100BullishScore=5ConditionsMet×100
Then it categorizes the market:
• RSI > 70 or Stoch > 80 → Overbought
• RSI < 30 or Stoch < 20 → Oversold
• Else → Normal
This encourages learners to think in terms of probabilistic conditions instead of single-indicator signals.
________________________________________
⚠️ Warning:
• Trading financial markets involves substantial risk.
• You can lose more money than you invest.
• Past performance of indicators does not guarantee future results.
• This script must not be copied, resold, or republished without authorization from aiTrendview.
By using this material or the code, you agree to take full responsibility for your trading decisions and acknowledge that this is not financial advice.
________________________________________
⚠️ Disclaimer and Warning (From aiTrendview)
This Dynamic Trading Dashboard is created strictly for educational and research purposes on the TradingView platform. It does not provide financial advice, buy/sell recommendations, or guaranteed returns. Any use of this tool in live trading is completely at the user’s own risk. Markets are inherently risky; losses can exceed initial investment.
The intellectual property of this script and its methodology belongs to aiTrendview. Unauthorized reproduction, modification, or redistribution of this code is strictly prohibited. By using this study material or the script, you acknowledge personal responsibility for any trading outcomes. Always consult professional financial advisors before making investment decisions.

ETF Builder & Backtest System [TradeDots]Create, analyze, and monitor your own custom “ETF-like” portfolio directly on TradingView. This script merges up to 10 different assets with user-defined weightings into a single composite chart, allowing you to see how your personalized portfolio would have performed historically. It is an original tool designed to help traders and investors quickly gauge risk and return profiles without leaving the TradingView platform.
📝 HOW IT WORKS
1. Custom Portfolio Construction
Multiple Assets : Combine up to 10 different stocks, ETFs, cryptocurrencies, or other symbols.
User-Defined Weights : Allocate each asset a percentage weight (e.g., 15% in AAPL, 10% in MSFT, etc.).
Single Composite Value : The script calculates a weighted “ETF-style” price, effectively simulating a merged portfolio curve on your chart.
2. Performance Tracking & Return Analysis
Automatic History Capture : The indicator records each asset’s starting price when it first appears in your chosen date range.
Rolling Updates : As time progresses, all asset prices are continually evaluated and the portfolio value is updated in real time.
Buy & Hold Returns : See how each asset—and the overall portfolio—performed from the “start” date to the most recent bar.
Annualized Return : Automatically calculates CAGR (Compound Annual Growth Rate) to help visualize performance over varying timescales.
3. Table & Visual Output
Performance Table : A comprehensive table displays individual asset returns, annualized returns, and portfolio totals.
Normalized Chart Plot : The composite ETF value is scaled to 100 at the start date, making it easy to compare relative growth or decline.
Optional Time Filter : You can define a specific date range (Start/End Dates) to focus on a particular period or to limit historical data.
⚙️ KEY FEATURES
1. Flexible Asset Selection
Choose any symbols from multiple asset classes. The script will only run calculations when data is available—no need to worry about missing quotes.
2. Dynamic Table Reporting
Start Price for each asset
Percentage Weight in the portfolio
Total Return (%) and Annualized Return (%)
3. Simple Backtesting Logic
This script takes a straightforward Buy & Hold perspective. Once the start date is reached, the portfolio remains static until the end date, so you can quickly assess hypothetical growth.
4. Plot Customization
Toggle the main “ETF” plot on/off.
Alter the visual style for tables and text.
Adjust the time filter to limit or extend your performance measurement window.
🚀 HOW TO USE IT
1. Add the Script
Search for “ETF Builder & Backtest System ” in the Indicators & Strategies tab or manually add it to your chart after saving it in your Pine Editor.
2. Configure Inputs
Enable Time Filter : Choose whether to restrict the analysis to a particular date range.
Start & End Date : Define the period you want to measure performance over (e.g., from 2019-12-31 to 2025-01-01).
Assets & Weights : Enter each symbol and specify a percentage weight (up to 10 assets).
Display Options : Pick where you want the Table to appear and choose background/text colors.
3. Interpret the Table & Plots
Asset Rows : Each asset’s ticker, weighting, start price, and performance metrics.
ETF Total Row : Summarizes total weighting, composite starting value, and overall returns.
Normalized Plot : Tracks growth/decline of the combined portfolio, starting at 100 on the chart.
4. Refine Your Strategy
Compare how different weights or a new mix of assets would have performed over the same period.
Assess if certain assets contribute disproportionately to your returns or volatility.
Use the results to guide allocations in your real trading or paper trading accounts.
❗️LIMITATIONS
1. Buy & Hold Only
This script does not handle rebalancing or partial divestments. Once the portfolio starts, weights remain fixed throughout the chosen timeframe.
2. No Reinvestment Tracking
Dividends or other distributions are not factored into performance.
3. Data Availability
If historical data for a particular asset is unavailable on TradingView, related results may display as “N/A.”
4. Market Regimes & Volatility
Past performance does not guarantee similar future behavior. Markets can change rapidly, which may render historical backtests less predictive over time.
⚠️ RISK DISCLAIMER
Trading and investing carry significant risk and can result in financial loss. The “ETF Builder & Backtest System ” is provided for informational and educational purposes only. It does not constitute financial advice.
Always conduct your own research.
Use proper risk management and position sizing.
Past performance does not guarantee future results.
This script is an original creation by TradeDots, published under the Mozilla Public License 2.0.
Use this indicator as part of a broader trading or investment approach—consider fundamental and technical factors, overall market context, and personal risk tolerance. No trading tool can assure profits; exercise caution and responsibility in all financial decisions.

AccumulationPro Money Flow StrategyAccumulationPro Money Flow Strategy identifies stock trading opportunities by analyzing money flow and potential long-only opportunities following periods of increased money inflow. It employs proprietary responsive indicators and oscillators to gauge the strength and momentum of the inflow relative to previous periods, detecting money inflow, buying/selling pressure, and potential continuation/reversals, while using trailing stop exits to maximize gains while minimizing losses, with careful consideration of risk management and position sizing.
Setup Instructions:
1. Configuring the Strategy Properties:
Click the "Settings" icon (the gear symbol) next to the strategy name.
Navigate to the "Properties" tab within the Settings window.
Initial Capital: This value sets the starting equity for the strategy backtesting. Keep in mind that you will need to specify your current account size in the "Inputs" settings for position sizing.
Base Currency: Leave this setting at its "Default" value.
Order Size: This setting, which determines the capital used for each trade during backtesting, is automatically calculated and updated by the script. You should leave it set to "1 Contract" and the script will calculate the appropriate number of contracts based on your risk per trade, account size, and stop-loss placement.
Pyramiding: Set this setting at 1 order to prevent the strategy from adding to existing positions.
Commission: Enter your broker's commission fee per trade as a percentage, some brokers might offer commission free trading. Verify Price for limit orders: Keep this value as 0 ticks.
Slippage: This value depends on the instrument you are trading, If you are trading liquid stocks on a 1D chart slippage might be neglected. You can Keep this value as 1 ticks if you want to be conservative.
Margin for long positions/short positions: Set both of these to 100% since this strategy does not employ leverage or margin trading.
Recalculate:
Select the "After order is filled" option.
Select the "On every tick" option.
Fill Orders: Keep “Using bar magnifier” unselected.
Select "On bar close". Select "Using standard OHLC"
2. Configuring the Strategy Inputs:
Click the "Inputs" tab in the Settings window.
From/Thru (Date Range): To effectively backtest the strategy, define a substantial period that includes various bullish and bearish cycles. This ensures the testing window captures a range of market conditions and provides an adequate number of trades. It is usually favorable to use a minimum of 8 years for backtesting. Ensure the "Show Date Range" box is checked.
Account Size: This is your actual current Account Size used in the position sizing table calculations.
Risk on Capital %: This setting allows you to specify the percentage of your capital you are willing to risk on each trade. A common value is 0.5%.
3. Configuring Strategy Style:
Select the "Style" tab.
Select the checkbox for “Stop Loss” and “Stop Loss Final” to display the black/red Average True Range Stop Loss step-lines
Make sure the checkboxes for "Upper Channel", "Middle Line", and "Lower Channel" are selected.
Select the "Plots Background" checkboxes for "Color 0" and "Color 1" so that the potential entry and exit zones become color-coded.
Having the checkbox for "Tables" selected allows you to see position sizing and other useful information within the chart.
Have the checkboxes for "Trades on chart" and "Signal Labels" selected for viewing entry and exit point labels and positions.
Uncheck* the "Quantity" checkbox.
Precision: select “Default”.
Check “Labels on price scale”
Check “Values in status line”
Strategy Application Guidelines:
Entry Conditions:
The strategy identifies long entry opportunities based on substantial money inflow, as detected by our proprietary indicators and oscillators. This assessment considers the strength and momentum of the inflow relative to previous periods, in conjunction with strong price momentum (indicated by our modified, less-lagging MACD) and/or a potential price reversal (indicated by our modified, less-noisy Stochastic). Additional confirmation criteria related to price action are also incorporated. Potential entry and exit zones are visually represented by bands on the chart.
A blue upward-pointing arrow, accompanied by the label 'Long' and green band fills, signifies a long entry opportunity. Conversely, a magenta downward-pointing arrow, labeled 'Close entry(s) order Long' with yellow band fills, indicates a potential exit.
Take Profit:
The strategy employs trailing stops, rather than fixed take-profit levels, to maximize gains while minimizing losses. Trailing stops adjust the stop-loss level as the stock price moves in a favorable direction. The strategy utilizes two types of trailing stop mechanisms: one based on the Average True Range (ATR), and another based on price action, which attempts to identify shifts in price momentum.
Stop Loss:
The strategy uses an Average True Range (ATR)-based stop-loss, represented by two lines on the chart. The black line indicates the primary ATR-based stop-loss level, set upon trade entry. The red line represents a secondary ATR stop-loss buffer, used in the position sizing calculation to account for potential slippage or price gaps.
To potentially reduce the risk of stop-hunting, discretionary traders might consider using a market sell order within the final 30 to 60 minutes of the main session, instead of automated stop-loss orders.
Order Types:
Market Orders are intended for use with this strategy, specifically when the candle and signal on the chart stabilize within the final 30 to 60 minutes of the main trading session.
Position Sizing:
A key aspect of this strategy is that its position size is calculated and displayed in a table on the chart. The position size is calculated based on stop-loss placement, including the stop-loss buffer, and the capital at risk per trade which is commonly set around 0.5% Risk on Capital per Trade.
Backtesting:
The backtesting results presented below the chart are for informational purposes only and are not intended to predict future performance. Instead, they serve as a tool for identifying instruments with which the strategy has historically performed well.
It's important to note that the backtester utilizes a tiny portion of the capital for each trade while our strategy relies on a diversified portfolio of multiple stocks or instruments being traded at once.
Important Considerations:
Volume data is crucial; the strategy will not load or function correctly without it. Ensure that your charts include volume data, preferably from a centralized exchange.
Our system is designed for trading a portfolio. Therefore, if you intend to use our system, you should employ appropriate position sizing, without leverage or margin, and seek out a variety of long opportunities, rather than opening a single trade with an excessively large position size.
If you are trading without automated signals, always allow the chart to stabilize. Refrain from taking action until the final 1 hour to 30 minutes before the end of the main trading session to minimize the risk of acting on false signals.
To align with the strategy's design, it's generally preferable to enter a trade during the same session that the signal appears, rather than waiting for a later session.
Disclaimer:
Trading in financial markets involves a substantial degree of risk. You should be aware of the potential for significant financial losses. It is imperative that you trade responsibly and avoid overtrading, as this can amplify losses. Remember that market conditions can change rapidly, and past performance is not indicative of future results. You could lose some or all of your initial investment. It is strongly recommended that you fully understand the risks involved in trading and seek independent financial advice from a qualified professional before using this strategy.

Qullamaggie [Modified] | FractalystWhat's the purpose of this strategy?
The strategy aims to identify high-probability breakout setups in trending markets, inspired by Kristjan "Qullamaggie" Kullamägi’s approach.
It focuses on capturing explosive price moves after periods of consolidation, using technical criteria like moving averages, breakouts, trailing stop-loss and momentum confirmation.
Ideal for swing traders seeking to ride strong trends while managing risk.
----
How does the strategy work?
The strategy follows a systematic process to capture high-momentum breakouts:
Pre-Breakout Criteria:
Prior Price Surge: Identifies stocks that have rallied 30-100%+ in recent month(s), signaling strong underlying momentum (per Qullamaggie’s volatility expansion principles).
Consolidation Phase: Looks for a tightening price range (e.g., flag, pennant, or tight base), indicating a potential "coiling" before continuation.
Trend Confirmation: Uses moving averages (e.g., 20/50/200 EMA) to ensure the stock is trading above key averages on the daily chart, confirming an uptrend.
Price Break: Enters when price clears the consolidation high with conviction.
Risk Management:
Initial Stop Loss: Placed below the consolidation low or a recent swing point to limit downside.
Break-Even Adjustment: Moves stop loss to breakeven once the trade reaches 1.5x risk-to-reward (RR), securing a "free trade" while letting winners run.
Trailing Stop (Unique Edge):
Market Structure Trailing: Instead of trailing via moving averages, the stop is dynamically adjusted using structural invalidation level. This adapts to price action, allowing the trade to stay open during volatile retracements while locking in gains as new structure forms.
Why This Matters: Most strategies use rigid trailing stops (e.g., below the 10EMA), which often exit prematurely in choppy markets. By trailing based on structure, this strategy avoids "noise" and captures larger trends, directly boosting overall returns.
----
What markets or timeframes is this suited for?
This is a long-only strategy designed for trending markets, and it performs best in:
Markets: Stocks (especially high-growth, liquid equities), cryptocurrencies (major pairs with strong volatility), commodities (e.g., oil, gold), and futures (index/commodity futures).
Timeframes: Primarily daily charts for swing trades (1-30 day holds), though weekly charts can help confirm broader trends.
Key Advantage: The TradingView script allows instant backtesting with adjustable parameters
You can:
- Test historical performance across multiple markets to identify which assets align best with the strategy.
- Optimize settings (e.g., trailing stop sensitivity, moving averages etc.) to match a market’s volatility profile.
Build a diversified portfolio by filtering for markets that show consistent profitability in backtests.
For example, you might discover cryptos require tighter trailing stops due to volatility, while stocks thrive with wider structural stops. The script automates this analysis, letting you to trade confidently.
----
What indicators or tools does the strategy use?
The strategy combines customizable technical tools with strict anti-lookahead safeguards:
Core Indicators:
Moving Averages: Adjustable periods (e.g., 20/50/200 EMA or SMA) and timeframes (daily/weekly) to confirm trend alignment. Users can test combinations (e.g., 10EMA vs. 20EMA) to optimize for specific markets.
Breakout Parameters:
Consolidation Length: Adjustable window to define the "tightness" of the pre-breakout pattern.
Entry Models: Flexible entry logics (Breakouts and fractals)
Anti-Lookahead Design:
All calculations (e.g., moving averages, consolidation ranges, volume averages) use only closed/confirmed data available at the time of the signal.
----
How do I manage risk with this strategy?
The strategy prioritizes customizable risk controls to align with your trading style and account size:
User-Defined Risk Inputs:
Risk Per Trade: Set a % of Equity (e.g., 1-2%) to determine position size. The strategy auto-calculates shares/contracts to match your selected risk per trade.
Flexibility: Choose between fixed risk or equity-based scaling.
The script adjusts position sizing dynamically based on your selection.
Pyramiding Feature:
Customizable Entries: Adjust the number of pyramiding trades allowed (e.g., 1-3 additional positions) in the strategy settings. Each new entry is triggered only if the prior trade hits its 1.5x RR target and the trend remains intact.
Risk-Scaled Additions: New positions use profits from prior trades, compounding gains without increasing initial risk.
Risk-Free Trade Mechanic:
Once a trade reaches 1.5x RR, the stop loss is moved to breakeven, eliminating downside risk.
The strategy then opens a new position (if pyramiding is enabled) using a portion of the locked-in profit. This "snowballs" winners while keeping total capital exposure stable.
Impact on Net Profit & Drawdown:
Net Profit Boost: Pyramiding lets you ride multi-leg trends aggressively. For example, a 100% runner could generate 2-3x more profit vs. a single-entry approach.
Controlled Drawdowns: Since new positions are funded by profits (not initial capital), max drawdown stays anchored to your original risk per trade (e.g., 1-2% of account). Even if later entries fail, the breakeven stop on prior trades protects overall equity.
Why This Works: Most strategies either over-leverage (increasing drawdowns) or exit too early. By recycling profits into new positions only after securing risk-free capital, this approach mimics hedge fund "scaling in" tactics while staying retail-trader friendly.
----
How does the strategy identify market structure for its trailing stoploss?
The strategy identifies market structure by utilizing an efficient logic with for loops to pinpoint the first swing candle that features a pivot of 2. This marks the beginning of the break of structure, where the market's previous trend or pattern is considered invalidated or changed.
----
What are the underlying calculations?
The underlying calculations involve:
Identifying Swing Points: The strategy looks for swing highs (marked with blue Xs) and swing lows (marked with red Xs). A swing high is identified when a candle's high is higher than the highs of the candles before and after it. Conversely, a swing low is when a candle's low is lower than the lows of the candles before and after it.
Break of Structure (BOS):
Bullish BOS: This occurs when the price breaks above the swing high level of the previous structure, indicating a potential shift to a bullish trend.
Bearish BOS: This happens when the price breaks below the swing low level of the previous structure, signaling a potential shift to a bearish trend.
Structural Liquidity and Invalidation:
Structural Liquidity: After a break of structure, liquidity levels are updated to the first swing high in a bullish BOS or the first swing low in a bearish BOS.
Structural Invalidation: If the price moves back to the level of the first swing low before the bullish BOS or the first swing high before the bearish BOS, it invalidates the break of structure, suggesting a potential reversal or continuation of the previous trend.
This method provides users with a technical approach to filter market regimes, offering an advantage by minimizing the risk of overfitting to historical data, which is often a concern with traditional indicators like moving averages.
By focusing on identifying pivotal swing points and the subsequent breaks of structure, the strategy maintains a balance between sensitivity to market changes and robustness against historical data anomalies, ensuring a more adaptable and potentially more reliable market analysis tool.
----
What entry criteria are used in this script?
The script uses two entry models for trading decisions: BreakOut and Fractal.
Underlying Calculations:
Breakout: The script records the most recent swing high by storing it in a variable. When the price closes above this recorded level, and all other predefined conditions are satisfied, the script triggers a breakout entry. This approach is considered conservative because it waits for the price to confirm a breakout above the previous high before entering a trade. As shown in the image, as soon as the price closes above the new candle (first tick), the long entry gets taken. The stop-loss is initially set and then moved to break-even once the price moves in favor of the trade.
Fractal: This method involves identifying a swing low with a period of 2, which means it looks for a low point where the price is lower than the two candles before and after it. Once this pattern is detected, the script executes the trade. This is an aggressive approach since it doesn't wait for further price confirmation. In the image, this is represented by the 'Fractal 2' label where the script identifies and acts on the swing low pattern.
----
What type of stop-loss identification method are used in this strategy?
This strategy employs two types of stop-loss methods: Initial Stop-loss and Trailing Stop-Loss.
Underlying Calculations:
Initial Stop-loss:
ATR Based: The strategy uses the Average True Range (ATR) to set an initial stop-loss, which helps in accounting for market volatility without predicting price direction.
Calculation:
- First, the True Range (TR) is calculated for each period, which is the greatest of:
- Current Period High - Current Period Low
- Absolute Value of Current Period High - Previous Period Close
- Absolute Value of Current Period Low - Previous Period Close
- The ATR is then the moving average of these TR values over a specified period, typically 14 periods by default. This ATR value can be used to set the stop-loss at a distance from the entry price that reflects the current market volatility.
Swing Low Based:
For this method, the stop-loss is set based on the most recent swing low identified in the market structure analysis. This approach uses the lowest point of the recent price action as a reference for setting the stop-loss.
Trailing Stop-Loss:
The strategy uses structural liquidity and structural invalidation levels across multiple timeframes to adjust the stop-loss once the trade is profitable. This method involves:
Detecting Structural Liquidity: After a break of structure, the liquidity levels are updated to the first swing high in a bullish scenario or the first swing low in a bearish scenario. These levels serve as potential areas where the price might find support or resistance, allowing the stop-loss to trail the price movement.
Detecting Structural Invalidation: If the price returns to the level of the first swing low before a bullish break of structure or the first swing high before a bearish break of structure, it suggests the trend might be reversing or invalidating, prompting the adjustment of the stop-loss to lock in profits or minimize losses.
By using these methods, the strategy dynamically adjusts the initial stop-loss based on market volatility, helping to protect against adverse price movements while allowing for enough room for trades to develop. The ATR-based stop-loss adapts to the current market conditions by considering the volatility, ensuring that the stop-loss is not too tight during volatile periods, which could lead to premature exits, nor too loose during calm markets, which might result in larger losses. Similarly, the swing low based stop-loss provides a logical exit point if the market structure changes unfavorably.
Each market behaves differently across various timeframes, and it is essential to test different parameters and optimizations to find out which trailing stop-loss method gives you the desired results and performance. This involves backtesting the strategy with different settings for the ATR period, the distance from the swing low, and how the trailing stop-loss reacts to structural liquidity and invalidation levels.
Through this process, you can tailor the strategy to perform optimally in different market environments, ensuring that the stop-loss mechanism supports the trade's longevity while safeguarding against significant drawdowns.
----
What type of break-even method is used in this strategy? What are the underlying calculations?
Moves the initial stop-loss to the entry price when the price reaches a certain RR ratio.
Calculation:
Break-even level = Entry Price + (Initial Risk * RR Ratio)
----
What tables are available in this script?
- Summary: Provides a general overview, displaying key performance parameters such as Net Profit, Profit Factor, Max Drawdown, Average Trade, Closed Trades and more.
Total Commission: Displays the cumulative commissions incurred from all trades executed within the selected backtesting window. This value is derived by summing the commission fees for each trade on your chart.
Average Commission: Represents the average commission per trade, calculated by dividing the Total Commission by the total number of closed trades. This metric is crucial for assessing the impact of trading costs on overall profitability.
Avg Trade: The sum of money gained or lost by the average trade generated by a strategy. Calculated by dividing the Net Profit by the overall number of closed trades. An important value since it must be large enough to cover the commission and slippage costs of trading the strategy and still bring a profit.
MaxDD: Displays the largest drawdown of losses, i.e., the maximum possible loss that the strategy could have incurred among all of the trades it has made. This value is calculated separately for every bar that the strategy spends with an open position.
Profit Factor: The amount of money a trading strategy made for every unit of money it lost (in the selected currency). This value is calculated by dividing gross profits by gross losses.
Avg RR: This is calculated by dividing the average winning trade by the average losing trade. This field is not a very meaningful value by itself because it does not take into account the ratio of the number of winning vs losing trades, and strategies can have different approaches to profitability. A strategy may trade at every possibility in order to capture many small profits, yet have an average losing trade greater than the average winning trade. The higher this value is, the better, but it should be considered together with the percentage of winning trades and the net profit.
Winrate: The percentage of winning trades generated by a strategy. Calculated by dividing the number of winning trades by the total number of closed trades generated by a strategy. Percent profitable is not a very reliable measure by itself. A strategy could have many small winning trades, making the percent profitable high with a small average winning trade, or a few big winning trades accounting for a low percent profitable and a big average winning trade. Most mean-reversion successful strategies have a percent profitability of 40-80% but are profitable due to risk management control.
BE Trades: Number of break-even trades, excluding commission/slippage.
Losing Trades: The total number of losing trades generated by the strategy.
Winning Trades: The total number of winning trades generated by the strategy.
Total Trades: Total number of taken traders visible your charts.
Net Profit: The overall profit or loss (in the selected currency) achieved by the trading strategy in the test period. The value is the sum of all values from the Profit column (on the List of Trades tab), taking into account the sign.
- Monthly: Displays performance data on a month-by-month basis, allowing users to analyze performance trends over each month and year.
- Weekly: Displays performance data on a week-by-week basis, helping users to understand weekly performance variations.
- UI Table: A user-friendly table that allows users to view and save the selected strategy parameters from user inputs. This table enables easy access to key settings and configurations, providing a straightforward solution for saving strategy parameters by simply taking a screenshot with Alt + S or ⌥ + S.
User-input styles and customizations:
Please note that all background colors in the style are disabled by default to enhance visualization.
How to Use This Strategy to Create a Profitable Edge and Systems?
Choose Your Strategy mode:
- Decide whether you are creating an investing strategy or a trading strategy.
Select a Market:
- Choose a one-sided market such as stocks, indices, or cryptocurrencies.
Historical Data:
- Ensure the historical data covers at least 10 years of price action for robust backtesting.
Timeframe Selection:
- Choose the timeframe you are comfortable trading with. It is strongly recommended to use a timeframe above 15 minutes to minimize the impact of commissions/slippage on your profits.
Set Commission and Slippage:
- Properly set the commission and slippage in the strategy properties according to your broker/prop firm specifications.
Parameter Optimization:
- Use trial and error to test different parameters until you find the performance results you are looking for in the summary table or, preferably, through deep backtesting using the strategy tester.
Trade Count:
- Ensure the number of trades is 200 or more; the higher, the better for statistical significance.
Positive Average Trade:
- Make sure the average trade is above zero.
(An important value since it must be large enough to cover the commission and slippage costs of trading the strategy and still bring a profit.)
Performance Metrics:
- Look for a high profit factor, and net profit with minimum drawdown.
- Ideally, aim for a drawdown under 20-30%, depending on your risk tolerance.
Refinement and Optimization:
- Try out different markets and timeframes.
- Continue working on refining your edge using the available filters and components to further optimize your strategy.
What Makes This Strategy Unique?
This strategy combines flexibility, smart risk management, and momentum focus in a way that’s rare and practical:
1. Adapts to Any Market Rhythm
Works on daily, weekly, or intraday charts without code changes.
Uses two entry types: classic breakouts (like trending stocks) or fractal patterns (to avoid false starts).
2. Smarter Stop-Loss System
No rigid rules: Stops adjust based on price structure (e.g., new “higher lows”), not fixed percentages.
Avoids whipsaws: Tightens stops only when the trend strengthens, not in choppy markets.
3. Safe Profit-Boosting Pyramiding
Adds new positions only after prior trades are risk-free (stops moved above breakeven).
Scales up using locked-in profits, not new capital, to grow gains safely.
4. Built-In Momentum Check
Tracks 1/3/6-month price growth to spotlight stocks with strong, lasting momentum.
Terms and Conditions | Disclaimer
Our charting tools are provided for informational and educational purposes only and should not be construed as financial, investment, or trading advice. They are not intended to forecast market movements or offer specific recommendations. Users should understand that past performance does not guarantee future results and should not base financial decisions solely on historical data.
Built-in components, features, and functionalities of our charting tools are the intellectual property of @Fractalyst Unauthorized use, reproduction, or distribution of these proprietary elements is prohibited.
- By continuing to use our charting tools, the user acknowledges and accepts the Terms and Conditions outlined in this legal disclaimer and agrees to respect our intellectual property rights and comply with all applicable laws and regulations.

IBD Style Relative Strength RatingWelcome to the IBD Style Relative Strength Rating Indicator!
A powerful tool inspired by Investor's Business Daily (IBD), this indicator helps traders evaluate stock performance relative to a benchmark. It’s perfect for identifying strong or weak stocks compared to the broader market, specifically the S&P 500 (SPY). Whether you're a beginner or an experienced investor, this guide will walk you through its features and key concepts, including the RS Line and RS Rating, and how legendary trader Mark Minervini uses similar tools.
Understanding the RS Line & RS Rating
RS Line (Relative Strength Line)
A visual representation of how a stock’s price performs relative to SPY.
Calculated by dividing the stock’s closing price by SPY’s closing price and multiplying by 100.
Rising RS Line → Stock is outperforming SPY.
Falling RS Line → Stock is underperforming SPY.
Helps identify strength or weakness compared to the market.
RS Rating
A numerical score (1-99) measuring stock performance over 252 trading days (1 year) relative to SPY.
Above 80 → Top 20% of performers.
Above 90 → Top 10% (ideal for growth investors).
Weighted average of stock’s price changes over 63, 126, 189, and 252 days.
Key Features Explained
RS Line Color Mode:
Static (default white) or Dynamic (green when rising, red when falling) for quick trend identification.
Comparative Symbol:
Default: SPY. Can be changed to NASDAQ:NDX, AAPL, or other indices/stocks.
Ensure selected symbols have sufficient historical data.
Plot RS New Highs: Marks new 250-day highs with subtle blue circles
Indicates a stock significantly outperforming SPY (potential buy signal).
Plot RS New Lows: Marks new 250-day lows with red circles
Signals underperformance (possible sell or avoid indicator).
Lookback for Display: Adjustable up to 2000 bars for historical trend analysis.
RS Rating Color Scheme
Green: Upward trend (improving RS Rating).
Orange: Neutral/mixed trend.
Red: Downward trend (declining RS Rating).
Dynamic Color Settings
Rising Line Color: Green (default), customizable.
Falling Line Color: Red (default), adjustable.
Advanced Options
Enable Replay Mode: Uses fixed percentile values for consistent RS Rating calculations in backtesting.
RS Rating Table
Displays current RS Rating and values from previous day, week, and month in the top-right corner (daily charts).
Background color reflects trend: Green (up), Orange (neutral), Red (down).
Past values appear in neutral gray for a quick performance snapshot.
How Mark Minervini Uses This Indicator
Mark Minervini, a legendary trader, emphasizes Relative Strength as a core strategy:
Looks for stocks with:
Rising RS Line.
RS Rating above 80-90 (top performers).
RS New Highs to spot breakout candidates.
Avoids stocks with:
Declining RS Line.
RS Rating below 70.
Important Information for Beginners
RS vs. SPY
The indicator compares stock performance against SPY (S&P 500).
Rising RS Line → Stock is beating SPY.
Falling RS Line → Stock is lagging.
Why Use This Indicator?
Helps find strong relative strength stocks, crucial for bullish trends.
New highs/lows on the RS Line signal significant shifts.
The RS Rating quantifies percentile-based performance.
Customization Options
Adjust colors, lookback periods, and marker sizes to match your trading style.
Default SPY comparison is ideal for U.S. traders but can be customized.
Timeframe Considerations
Optimized for daily charts.
Weekly/monthly charts may have limited data availability.
Tips for Crypto Traders (Measuring Altcoins vs. Bitcoin or Total Market Cap)
If trading cryptocurrencies, this indicator can measure altcoins vs. Bitcoin (BTC) or the total crypto market cap (TOTAL):
Comparative Symbol Setup:
Set Comparative Symbol to BTCUSD to compare an altcoin (e.g., ETHUSD) against Bitcoin.
Rising RS Line → The altcoin is outperforming Bitcoin (bullish signal).
Use TOTAL (crypto market cap index) to assess an altcoin’s strength against the total market.
High RS Rating suggests the altcoin is a market leader.
Adjust Look-back Periods:
Crypto markets are volatile, so reduce Look-back for New Highs/Lows to 50-100 bars (about 2-4 months) for shorter-term trends.
Fine-tune based on your trading strategy.
New Highs and Lows:
Watch for new RS Line highs (blue dots) to identify altcoins breaking out against BTC or TOTAL (momentum trading).
New lows (red dots) may signal weakening altcoins to avoid.
RS Rating Interpretation:
Above 80 against BTC or TOTAL → The altcoin is a strong performer.
This aligns with Minervini’s growth strategy for stocks.
Color Dynamics:
Use Dynamic RS Line Color (green for rising, red for falling) to quickly spot altcoin trends against BTC or TOTAL.
Crypto data may have gaps—test indicator settings on different timeframes (e.g., 1-hour or 4-hour charts).
Tips for Getting Started
Apply the Indicator to a stock chart and set Comparative Symbol to SPY.
Watch the RS Line:
If trending upward with new highs and RS Rating > 80, it's a strong candidate.
Use the RS Rating Table to check for trend consistency.
Adjust Opacity Settings for markers to balance visibility and clarity.
This indicator is now ready for public use as of March 18, 2025. Enjoy trading with enhanced insights, and feel free to share feedback or suggestions for future updates!

Simple APF Strategy Backtesting [The Quant Science]Simple backtesting strategy for the quantitative indicator Autocorrelation Price Forecasting. This is a Buy & Sell strategy that operates exclusively with long orders. It opens long positions and generates profit based on the future price forecast provided by the indicator. It's particularly suitable for trend-following trading strategies or directional markets with an established trend.
Main functions
1. Cycle Detection: Utilize autocorrelation to identify repetitive market behaviors and cycles.
2. Forecasting for Backtesting: Simulate trades and assess the profitability of various strategies based on future price predictions.
Logic
The strategy works as follow:
Entry Condition: Go long if the hypothetical gain exceeds the threshold gain (configurable by user interface).
Position Management: Sets a take-profit level based on the future price.
Position Sizing: Automatically calculates the order size as a percentage of the equity.
No Stop-Loss: this strategy doesn't includes any stop loss.
Example Use Case
A trader analyzes a dayli period using 7 historical bars for autocorrelation.
Sets a threshold gain of 20 points using a 5% of the equity for each trade.
Evaluates the effectiveness of a long-only strategy in this period to assess its profitability and risk-adjusted performance.
User Interface
Length: Set the length of the data used in the autocorrelation price forecasting model.
Thresold Gain: Minimum value to be considered for opening trades based on future price forecast.
Order Size: percentage size of the equity used for each single trade.
Strategy Limit
This strategy does not use a stop loss. If the price continues to drop and the future price forecast is incorrect, the trader may incur a loss or have their capital locked in the losing trade.
Disclaimer!
This is a simple template. Use the code as a starting point rather than a finished solution. The script does not include important parameters, so use it solely for educational purposes or as a boilerplate.

Stock ETF Tracker 2.0The Stock Sector ETF tracker with Indicators is a versatile tool designed to track the performance of sector-specific ETFs relative to the current asset. It automatically identifies the sector of the underlying symbol and displays the corresponding ETF’s price action alongside key technical indicators. This helps traders analyze sector trends and correlations in real time.
---
Key Features
Automatic Sector Detection:
Fetches the sector of the current asset (e.g., "Technology" for AAPL).
Maps the sector to a user-defined ETF (default: SPDR sector ETFs) .
Technical Indicators:
Simple Moving Average (SMA): Tracks the ETF’s trend.
Bollinger Bands: Highlights volatility and potential reversals.
Donchian High (52-Week High): Identifies long-term resistance levels.
SPY Regime Filter: Red background color if SP500 is below 200 day SMA.
Customizable Inputs:
Adjust indicator parameters (length, visibility).
Override default ETFs for specific sectors.
Informative Table:
Displays the current sector and ETF symbol in the bottom-right corner.
---
Input Settings
SMA Settings
SMA Length: Period for calculating the Simple Moving Average (default: 200).
Show SMA: Toggle visibility of the SMA line.
Bollinger Bands Settings
BB Length: Period for Bollinger Bands calculation (default: 20).
BB Multiplier: Standard deviation multiplier (default: 2.0).
Show Bollinger Bands: Toggle visibility of the bands.
Donchian High (52-Week High)
Daily High Length: Days used to calculate the high (default: 252, approx. 1 year).
Show High: Toggle visibility of the 52-week high line.
Sector Selections
Customize ETFs for each sector (e.g., replace XLU with another utilities ETF).
---
Example Use Cases
Trend Analysis: Compare a stock’s price action to its sector ETF’s SMA for trend confirmation.
Volatility Signals: Use Bollinger Bands to spot ETF price squeezes or breakouts.
Sector Strength: Monitor if the ETF is approaching its 52-week high to gauge sector momentum.
Enjoy tracking sector trends with ease! 🚀

DCA Alpha 1.0 Trading Tool for Dollar-Cost Averaging
Description:
DCA Alpha 1.0 is a precision-engineered trading tool designed to assist traders and investors in accumulating assets during market downturns. Using proprietary algorithms that combine momentum decay, extreme price deviation metrics, trend dynamics, divergence analysis, and mean regression, it identifies potential bottom extreme zones in various asset classes such as indices, stocks, crypto, and commodities.
This indicator highlights market conditions where assets are oversold, undervalued, or experiencing capitulation—providing disciplined, unleveraged dollar-cost averaging (DCA) opportunities. Ideal for long-term growth strategies, DCA Alpha 1.0 helps cut through market noise, pinpointing moments of peak fear and maximum reward potential.
Whether navigating volatile crypto markets, timing corrections in indices, or accumulating commodities, DCA Alpha 1.0 serves as a vital tool for mastering the art of buying low and building your assets up strategically.
Instructions:
Getting Started:
Add the Indicator:
Install DCA Alpha 1.0 on your TradingView chart.
Select your preferred asset class: stocks, indices, crypto, or commodities.
Choose an appropriate timeframe (e.g., daily or weekly for long-term DCA strategies).
Customize Inputs: Adjust the following settings to align with your strategy:
Percentage of Equity to Trade: Define the portion of your portfolio to allocate per signal (default: 1% equity).
Profit Target Percentages: Set thresholds for locking in gains (default: 50% on lower timeframes, 500% on higher timeframes).
Zones and Signals:
Extreme Negative Zones:
What It Represents:
These zones highlight conditions where prices are deeply oversold, indicating extreme bearish sentiment. The market is likely nearing a bottom, offering high-probability buying opportunities.
Entry Signals:
When the price enters these extreme negative zones, visual markers (e.g., green triangles or other indicators) will signal a potential buying opportunity. These moments are indicative of market exhaustion, signaling that a reversal could be imminent.
Momentum Decay & Divergence:
Momentum decay occurs when price movement slows over time. In extreme negative zones, if prices continue to fall but at a diminishing rate (e.g., decreased volume or a fading oscillator), it suggests weakening bearish momentum. This, coupled with bullish divergence (oscillator forming higher lows while price makes lower lows), signifies a reversal, making it an ideal point to consider dollar-cost averaging into the asset.
Neutral Zones:
What It Represents:
The neutral zone is a state of market equilibrium, where prices are neither overbought nor oversold. The market is in a balanced state, with no strong trend emerging.
Mean Regression:
In a neutral zone, the market is reverting to its mean or average price after overreacting in either direction. A price transition from extreme zones (overbought/oversold) to the neutral zone suggests a reversion to the market's long-term average, making this a period of reduced volatility and uncertainty.
Entering or Exiting Neutral Zones:
Traders should avoid entering or exiting positions during neutral zone conditions unless transitioning from an extreme zone (negative or positive). Transitioning from an extreme negative zone to neutral may suggest an opportunity to accumulate assets gradually, while a shift from neutral to an extreme negative zone may indicate a deeper correction and warrant caution.
Momentum Decay & Divergence (Exiting Neutral Zone):
If prices are rising but the oscillator shows lower highs (bearish divergence), and momentum is fading, this could signal a pullback. A transition out of the neutral zone in this context may prompt traders to hold off on new positions or consider profit-taking.
Extreme Positive Zones:
What It Represents:
Markets can also become overbought or overvalued. When price enters extreme positive zones, the asset may be overvalued, suggesting potential selling or a waiting period.
Exit Signals:
Red triangle indicators signal potential exit points when prices reach overbought conditions, signaling a time to lock in profits and reduce exposure.
Momentum Decay & Divergence (Exiting Positive Zone):
When prices are making new highs but momentum is weakening (momentum decay) and the oscillator is showing lower highs (bearish divergence), this could indicate a faltering rally. Such conditions represent an ideal time to reduce exposure or exit positions.
Key Inputs for Customization:
Percentage of Equity to Trade:
This setting allows you to allocate a portion of your total portfolio per buy signal. By default, 1% of equity is used per signal, but this can be adjusted based on your risk tolerance and strategy.
Profit Target Percentages:
These thresholds help lock in gains once the price moves a set percentage in your favor.
Lower Timeframes: Default profit target of 50%.
Higher Timeframes: Default profit target of 500%.
These settings can be customized for specific risk/reward preferences.
Warning!!! : Aggressive Mode
Aggressive Mode is an advanced feature designed for traders who want to increase the frequency of signals during periods of market volatility. This mode will trigger more frequent entries, even into slightly less extreme zones, capturing short-term reversals.
What Aggressive Mode Does:
It amplifies signals by allowing the tool to identify more frequent price reversals, including brief market corrections, increasing trade frequency. While this can offer more trading opportunities, it also exposes you to higher risk.
Warning:
Aggressive Mode should be used only by experienced traders familiar with short-term volatility. The increased frequency of signals could lead to higher risk exposure. Ensure robust risk management practices, such as stop-loss orders and profit-taking strategies, are in place before activating this mode.
Default Setting:
Aggressive Mode is disabled by default. It can be activated at your discretion based on your experience level and risk appetite.
Best Practices:
Focus on High-Quality Assets: Prioritize assets with strong recovery potential (e.g., major indices, blue-chip cryptocurrencies).
Use Longer Timeframes: Minimize market noise and optimize your DCA strategy by focusing on higher timeframes (e.g., daily or weekly charts).
Review Trading Inputs: Regularly adjust your inputs to ensure they align with your financial goals and risk tolerance.
Implement Risk Management: Use stop-loss orders and profit targets to manage risk, especially when using Aggressive Mode.
Disclaimer:
DCA Alpha 1.0 is designed specifically for unleveraged, long-term dollar-cost averaging strategies. It is not intended for day trading or leveraged positions. The tool excels at identifying market dips but cannot guarantee success. Users are fully responsible for their own risk management, including the use of stop-losses, profit targets, and position sizing.
Aggressive Mode increases trade frequency and may lead to higher exposure and potential losses. Only experienced traders should consider using this mode. Always understand the risks involved before incorporating this tool into your trading strategy.

Arjunology for Stocks IndicatorArjunology for Stocks Indicator is a unique trend-following and exit management system that combines the power of Exponential Moving Averages (EMA) and Average True Range (ATR) to capture market trends and manage trade exits dynamically. It is designed to help traders identify potential buy and sell points based on market trends while incorporating volatility adjustments to avoid false signals and provide more reliable trade entries and exits.
Key Features:
1. Exponential Moving Averages (EMAs):
• Two EMAs (Short EMA and Long EMA) are used to determine trend direction and potential crossover signals.
• Short EMA reacts quickly to price changes, giving an indication of shorter-term trends.
• Long EMA provides a more stable measure of the overall trend direction, helping filter out market noise.
• Bullish Crossovers: When the short EMA crosses above the long EMA, it signals a potential uptrend (buy condition).
• Bearish Crossovers: When the short EMA crosses below the long EMA, it signals a potential downtrend (sell condition).
2. Average True Range (ATR):
• ATR is used to assess market volatility and avoid false signals during low volatility periods.
• A trailing stop loss mechanism based on ATR ensures that the indicator adapts to the current market environment, with higher volatility allowing for wider stops and lower volatility leading to tighter stops.
• A flat ATR threshold is used to avoid signals during quiet periods, where price movement may be too insignificant to trade effectively.
3. Buy and Sell Visual Cues:
• Green Triangle at the bottom of the candle when a bullish crossover (buy) condition is met.
• Red Triangle at the top of the candle when a bearish crossover (sell) condition is met.
• These visual cues help traders quickly identify trade entry points based on the trend signals.
4. Dynamic Exit Management:
• The indicator provides an Blue candle background to highlight exit points, with an “EXIT” label at the bottom of the candle in blue. This visual exit signal ensures clarity when a trade should be exited based on the trend reversal.
Justification for Combining EMAs and ATR in This Script:
The Exponential Moving Averages (EMAs) and Average True Range (ATR) serve complementary purposes in this script, enhancing each other’s functionality to provide a more complete trading system:
1. Trend Identification with EMAs:
• The combination of short and long EMAs is a widely trusted method for determining the trend direction. The crossovers between these EMAs provide clear entry signals for buy or sell trades. However, relying solely on EMAs can lead to false signals during periods of low volatility or market consolidation.
2. ATR for Volatility and Stop Loss:
• To prevent false signals during low-volatility conditions, the script uses ATR as a filter. This ensures that trades are only taken when the market has enough momentum, reducing the risk of being caught in “choppy” conditions where price action may be flat and untradeable.
• Additionally, the ATR-based trailing stop provides dynamic trade management, adjusting stop-loss levels according to the current volatility. This makes the system adaptive and prevents tight stops in volatile conditions or unnecessarily wide stops in calm markets.
3. Why They Work Together:
• The EMAs handle the trend direction, which is the foundation of the trading system, while the ATR adjusts the trade management to account for changing volatility. This means that the trader is always entering trades that are likely to follow a strong trend, while avoiding stagnant markets and using volatility-adaptive exit points.
• Without ATR, EMAs might generate signals during low-volatility periods that are unreliable. On the other hand, ATR alone wouldn’t provide a clear direction for trend-following. Together, these indicators create a balanced approach where trades are not only timely but also carefully managed.
How to Use:
• Buy Entry: Enter when the green triangle appears, indicating a bullish EMA crossover.
• Sell Entry: Enter short when the red triangle appears, indicating a bearish EMA crossover.
• Exit: Follow the orange background and blue “EXIT” label as a visual cue to exit the trade.
The combination of these tools allows traders to identify meaningful trend reversals while also managing risk dynamically, making the Arjunology for Stocks Indicator both versatile and effective for various market conditions.
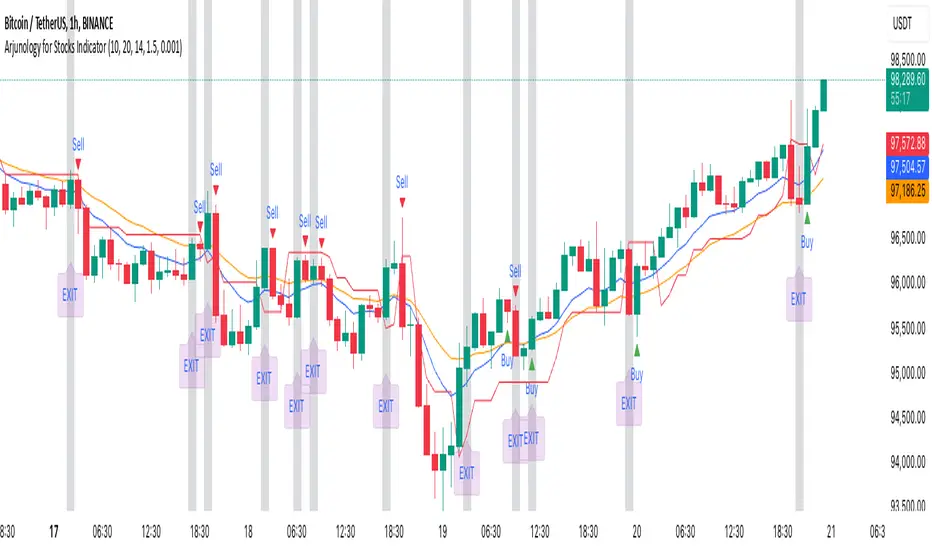
Fisher Transform on RSIOverview
The Fisher Transform on RSI indicator combines the Relative Strength Index (RSI) with the Fisher Transform to offer a refined tool for identifying market turning points and trends. By applying the Fisher Transform to the RSI, this indicator converts RSI values into a Gaussian normal distribution, enhancing the precision of detecting overbought and oversold conditions. This method provides a clearer and more accurate identification of potential market reversals than the standard RSI.
Key/Unique Features
Fisher Transform Applied to RSI : Transforms RSI values into a Gaussian normal distribution, improving the detection of overbought and oversold conditions.
Smoothing : Applies additional smoothing to the Fisher Transform, reducing noise and providing clearer signals.
Signal Line : Includes a signal line to identify crossover points, indicating potential buy or sell signals.
Custom Alerts : Built-in alert conditions for bullish and bearish crossovers, keeping traders informed of significant market movements.
Visual Enhancements : Background color changes based on crossover conditions, offering immediate visual cues for potential trading opportunities.
How It Works
RSI Calculation : The indicator calculates the Relative Strength Index (RSI) based on the selected source and period length.
Normalization : The RSI values are normalized to fit within a range of -1 to 1, which is essential for the Fisher Transform.
Fisher Transform : The normalized RSI values undergo the Fisher Transform, converting them into a Gaussian normal distribution.
Smoothing : The transformed values are smoothed using a simple moving average to reduce noise and provide more reliable signals.
Signal Line : A signal line, which is a simple moving average of the smoothed Fisher Transform, is plotted to identify crossover points.
Alerts and Visuals : Custom alert conditions are set for bullish and bearish crossovers, and the background color changes to indicate these conditions.
Usage Instructions
Trend Identification : Use the Fisher Transform on RSI to identify overbought and oversold conditions with enhanced precision, aiding in spotting potential trend reversals.
Trade Signals : Monitor the crossovers between the smoothed Fisher Transform and the signal line. A bullish crossover suggests a potential buying opportunity, while a bearish crossover indicates a potential selling opportunity.
Alerts : Set custom alerts based on the built-in conditions to receive notifications when important crossover events occur, ensuring you never miss a trading opportunity.
Visual Cues : Utilize the background color changes to quickly identify bullish (green) and bearish (red) conditions, providing immediate visual feedback on market sentiment.
Complementary Analysis : Combine this indicator with other technical analysis tools and indicators to enhance your overall trading strategy and make more informed decisions.

PUMP IndicatorsPUMP Indicator Description
★ Supported Markets and Assets
The PUMP indicator is a versatile tool that can be effectively applied to various markets and assets, including:
▶ Korean Stocks: KOSPI, KOSDAQ, etc.
▶ U.S. Stocks: NYSE, NASDAQ, etc.
▶ Cryptocurrencies: Major cryptocurrencies such as Bitcoin (BTC), Ethereum (ETH), etc.
▶ Futures: Major futures contracts like gold, silver, crude oil, etc.
▶ ETFs: SPY, QQQ, etc.
★ Indicator Description
The PUMP indicator is designed to analyze price divergence and volatility.
It is provided with minimal representation on the chart, allowing users to use it in conjunction with other indicators, such as classical RSI, TRIX, CCI, ADX, BWI, Bollinger Bands, etc.
Everything displayed on the chart can be turned on or off in the options, allowing users to customize their setup.
The PUMP indicator is based on the concept of the MACD indicator, which calculates the difference between the leading line and the lagging line to generate signals.
GOOD, UP, and CR signals predict price increases.
DOWN and BAD signals predict price decreases.
WARN emphasizes that the buy position is not certain, regardless of price increases or decreases.
Therefore, the PUMP indicator is good to use with other indicators. It visually displays divergence and volatility signals along with the MACD movements below, and users can receive alerts for movements in their interested stocks using the alarm function.
It can be used as an indicator for viewing buy and sell signals, as well as predicting the price flow.
▶ (Drawback) Unlike typical TRIX, RSI, TRIX, CCI, ADX, BWI indicators, which are implemented in a new lower window, the PUMP indicator displays both signals and the leading and lagging lines simultaneously, so it is not implemented in a new window, meaning the baseline may vary depending on the daily chart appearance.
★ The PUMP indicator consists of the following components:
▶ PUMP Indicator Leading and Lagging Lines
PUMP t: Leading line (yellow)
PUMP p: Lagging line (blue)
The MACD displayed at the bottom of the chart calculates the divergence between the PUMP t leading line and the PUMP p lagging line.
▶ EA Formula
The core calculation of the PUMP indicator is as follows:
EA (Exponential Average): 100 * (eavg1 / eavg2)
Where eavg1 is the short-term EMA, and eavg2 is the long-term EMA.
It calculates the divergence of the index.
▶ The PUMP indicator is a fixed indicator (cannot be arbitrarily modified).
▶ Highlights: The method of calculating the interval or number of uses is an important part of the index calculation and is therefore private.
★ Signal Description
The PUMP indicator provides a total of six major signals:
▶ UP Signal: Occurs when the divergence between the MACD PUMP t leading line and PUMP p lagging line narrows, and the divergence of the exponential moving average widens compared to before.
▶ DOWN Signal: Occurs when the MACD PUMP t leading line crosses above the PUMP p lagging line.
▶ GOOD Signal: Represents an UP signal with added volume.
(The GOOD signal is not necessarily better than the UP signal. If a GOOD signal appears in a stock that has sufficiently fallen in price, it helps understand that a rebound has started. Therefore, the GOOD signal is made to find a rebound in stocks that have continuously declined, rather than finding signals in consistently rising prices.)
▶ BAD Signal: Occurs when the PUMP t leading line crosses above the 0 baseline, indicating a potential sell signal.
▶ WARN Signal: A warning signal occurring at high levels, indicating that buying is not recommended (regardless of buy or sell).
▶ CR Signal: Occurs in all sections where the PUMP t leading line crosses below the PUMP p lagging line.
★ Lower MACD Horizontal Baseline
The PUMP indicator provides three horizontal baselines from the MACD indicator for additional analysis:
▶ Pump H
▶ PUMP M
▶ PUMP L
It visually provides the divergence of the lower MACD indicator for rising and falling changes, with the default set to 0, and users can change the numbers in the options as needed.
★ Moving Averages
The PUMP indicator provides three basic moving averages:
▶ Buzz 7: 7-day moving average
▶ Buzz 26: 26-day moving average
▶ Buzz 120: 120-day moving average
The number of moving averages is fixed, but users can use them in conjunction with the moving averages provided by TradingView as needed.
★ Alert Function
Using the Alert function of TradingView, you can set alerts for various signals generated by the PUMP indicator.
▶ GOOD Signal Alert
▶ UP Signal Alert
▶ CR Signal Alert
▶ DOWN Signal Alert
▶ BAD Signal Alert
▶ WARN Signal Alert
★ Usage
1. The PUMP indicator is not focused on buy and sell signals but calculates the current price movement and divergence and is designed to express it through MACD leading and lagging lines and signals.
2. The PUMP indicator can be used alone or in conjunction with other indicators for technical analysis.
3. You can analyze buy and sell using the signals of the PUMP indicator along with fundamental analysis, such as news, issues, national policies, company profits, and sales increases.
4. The MACD leading and lagging lines at the bottom of the chart move inversely to the price, ensuring that the PUMP indicator does not interfere when used with other indicators.
5. You can receive real-time alerts using the alarm function.
Below, we attach pictures to help users understand.
============================================
PUMP 인디케이터 설명(한글)
★ 지원되는 시장 및 자산
PUMP 표시기는 다음과 같은 다양한 시장 및 자산에 효과적으로 적용할 수 있는 다용도 도구입니다:
▶ 한국주식: KOSPI, KOSDAQ 등.
▶ 미국주식: NYSE, NASDAQ 등.
▶ 암호화폐: 비트코인(BTC), 이더리움(ETH) 등 주요 암호화폐.
▶ 선물 : 금, 은, 원유 등 주요 선물 계약.
▶ 상장지수펀드(ETF) : SPY, QQQ 등.
★ 지표 설명
PUMP 지표는 가격 이격과 변동성을 분석하도록 설계되었습니다.
사용자가 만든 지표 또는 고전 RSI, TRIX, CCI, ADX, BWI, Bollinger Bands 등과 함께 사용할 수 있게 차트에 최소한의 표현으로 제공됩니다.
그리고 차트에 표현되는 모든 것들을 옵션에서 on / off 가능하게 하였기에 사용자가 커스텀 할 수 있게 하였습니다.
PUMP 지표 신호를 생성하기 위해 선행 라인과 후행 라인 간의 차이를 계산하는 MACD 지표의 개념을 기반으로 합니다.
GOOD, UP, CR 신호는 가격 상승을 예측합니다.
DOWN, BAD 신호는 가격 하락을 예측합니다.
WARN은 가격 상승과 하락에 관계없이, 매수 자리는 확실히 아님을 강조한 신호입니다.
그러므로 PUMP 지표는 다른 지표와 함께 사용하기 좋고, 이격과 변동성을 신호와 하단 MACD 움직임을 눈으로 볼 수 있으며, 알람 기능을 활용하여 관심 있는 종목의 움직임을 알람으로 받아 볼 수 있는 지표입니다.
매수와 매도를 보는 지표로 사용할 수 있으며, 가격의 흐름을 예상하는 지표로 사용할 수 있습니다.
▶ (단점) 보통의 TRIX, RSI, TRIX, CCI, ADX, BWI 지표들은 하단의 새로운 창에서 구현됩니다. 하지만 PUMP 지표는 신호와 하단 선행과 후행을 동시에 표현하기 때문에 새로운 창에서 구현되지 않기에 기준 축이 일봉의 모습에 따라 달라질 수 있습니다.
★ PUMP 지표는 다음과 같은 구성요소로 구성됩니다
▶ PUMP 지표 선행과 후행
PUMP t : 선행라인 (노란색)
PUMP p : 후행라인 (파란색)
차트 하단에 나타나는 MACD는 PUMP t선행라인과 PUMP p 후행라인의 이격도를 계산합니다.
▶ EA공식
PUMP 지표의 핵심 계산식은 다음과 같습니다:
EA(지수평균): 100 * (eavg1 / eavg2)
여기서 eavg1은 단기 EMA이고 eavg2는 장기 EMA입니다.
지수의 이격도를 계산합니다.
▶ PUMP 지표는 고정 지표입니다. (임의 수정 불가)
▶ 강조 : 이격의 계산법이나 사용하는 숫자는 지표 계산의 중요한 부분이므로 비공개입니다.
★ 신호 설명
PUMP 표시등은 총 6개의 주요 신호를 제공합니다:
▶ UP 신호: MACD PUMP t 선행과 PUMP p 후행의 이격이 줄어들 때, 지수 이동 평균의 이격도가 이전 보다 넓어지면 발생합니다.
▶ DOWN 신호: MACD PUMP t 선행이 PUMP p 후행을 상향 교차할 때 발생합니다.
▶ GOOD 신호: 거래량이 추가된 UP 신호를 나타냅니다.
(GOOD 신호가 UP 신호보다 좋다기 보다, 충분히 가격 하락한 종목에서 GOOD 신호가 나온다면 반등이 시작되는 것을 이해할 수 있게 만든 지표입니다. 그러므로 GOOD 신호는 가격이 꾸준히 상승하는 곳에서 신호를 찾기보다, 지속 하락하다 반등을 찾는 신호로 만들었습니다.)
▶ BAD 신호: PUMP t 선행이 0 기준선 이상으로 교차할 때 발생하며, 이는 잠재적인 판매 신호를 나타냅니다.
▶ 경고 신호: 높은 수준에서 발생하는 경고 신호로, 매수가 권장되지 않음을 나타냅니다(매수, 매도와 무관함).
▶ CR 신호: PUMP t 선행 라인이 PUMP p 후행 라인 아래로 교차하는 모든 구간에서 발생합니다.
★ 하단 MACD 가로 기준선
PUMP 표시기는 추가 분석을 위해 MACD 지표에서 3가지 가로 기준을 제공합니다:
▶ pump H
▶ PUMP M
▶ PUMP L
하단의 MACD 지표의 이격도를 상승 및 하강의 변화를 시각적으로 기준을 만들 수 있게 제공하며, 기본은 0으로 제공하고, 사용자의 필요에 따라 옵션에서 숫자를 변경할 수 있게 하였습니다.
★ 이동 평균
PUMP 표시기는 세 가지 기본 이동 평균을 제공 합니다:
▶ Buzz 7: 7일 이동 평균
▶ Buzz 26: 26일 이동 평균
▶ Buzz 120 : 120일 이동 평균
이동 평균의 수는 고정되어 있지만, 사용자는 필요에 따라 TradingView에서 제공하는 이동 평균과 함께 사용할 수 있습니다.
★ 알림 기능
TradingView의 Alert 기능을 사용하여 PUMP 지표 생성되는 다양한 신호에 대한 Alert를 설정할 수 있습니다.
▶ GOOD 신호 알림
▶ UP 신호 알림
▶ CR 신호 알림
▶ DOWN 신호 알림
▶ BAD 신호 알림
▶ WARN 신호 알림
★ 사용법
1.PUMP 지표는 매수와 매도에 중점을 둔 지표가 아니며 현재 가격의 움직임과 이격도를 계산하며 MACD 선행과 후행 그리고 신호로 표현하기 위해 만들어진 지표입니다.
2. PUMP 지표는 단일로 사용할 수 있고, 또는 다른 지표와 함께 기술적분석으로 사용할 수 있습니다.
3. 뉴스와 이슈, 국가의 정책, 회사의 이익, 매출의 상승 등 기본적분석과 함께 PUMP 지표의 신호를 이용하여 매수와 매도 분석을 할 수 있습니다.
4. 차트 하단의 MACD 선행과 후행은 가격의 움직임을 반대로 움직이며, 가격과 반대로 움직이게 함으로써 다른 지표와 함께 사용하였을 때, PUMP 지표가 방해가 되지 않게 하였습니다.
5. 알람을 사용하여 실시간으로 알람을 받아 보실 수 있습니다.
아래 사진을 첨부하여 사용자 이해를 돕습니다.
============================================
UP신호는 이격을
▶ The UP signal indicates horizontal divergence.
CR신호는 선행이 후행을 아래로 돌파
▶ The CR signal indicates vertical divergence when the leading line crosses below the lagging line.
WARN 신호를 확인
▶ Check the WARN signal.
BAD와 DOWN 신호
▶ BAD and DOWN signals.
PUMP 지표의 기준 3개
3 criteria for PUMP indicators
따로 그림을 그리지 않은 차트
▶ A chart without separate drawings.
============================================
다른 지표와 + 조합
+ Combination with other indicators

AlgoBuilder [Trend-Following] | FractalystWhat's the strategy's purpose and functionality?
This strategy is designed for both traders and investors looking to rely on and trade based on historical and backtested data using automation. The main goal is to build profitable trend-following strategies that outperform the underlying asset in terms of returns while minimizing drawdown. For example, as for a benchmark, if the S&P 500 (SPX) has achieved an estimated 10% annual return with a maximum drawdown of -57% over the past 20 years, using this strategy with different entry and exit techniques, users can potentially seek ways to achieve a higher Compound Annual Growth Rate (CAGR) while maintaining a lower maximum drawdown.
Although the strategy can be applied to all markets and timeframes, it is most effective on stocks, indices, future markets, cryptocurrencies, and commodities and JPY currency pairs given their trending behaviors.
In trending market conditions, the strategy employs a combination of moving averages and diverse entry models to identify and capitalize on upward market movements. It integrates market structure-based trailing stop-loss mechanisms across different timeframes and provides exit techniques, including percentage-based and risk-reward (RR) based take profit levels.
Additionally, the strategy has also a feature that includes a built-in probability and sentiment function for traders who want to implement probabilities and market sentiment right into their trading strategies.
Performance summary, weekly, and monthly tables enable quick visualization of performance metrics like net profit, maximum drawdown, compound annual growth rate (CAGR), profit factor, average trade, average risk-reward ratio (RR), and more. This aids optimization to meet specific goals and risk tolerance levels effectively.
-----
How does the strategy perform for both investors and traders?
The strategy has two main modes, tailored for different market participants: Traders and Investors.
Trading:
1. Trading (1x):
- Designed for traders looking to capitalize on bullish trending markets.
- Utilizes a percentage risk per trade to manage risk and optimize returns.
- Suitable for active trading with a focus on trend-following and risk management.
- (1x) This mode ensures no stacking of positions, allowing for only one running position or trade at a time.
◓: Mode | %: Risk percentage per trade
2. Trading (2x):
Similar to the 1x mode but allows for two pyramiding entries.
This approach enables traders to increase their position size as the trade moves in their favor, potentially enhancing profits during strong bullish trends.
◓: Mode | %: Risk percentage per trade
3. Investing:
- Geared towards investors who aim to capitalize on bullish trending markets without using leverage while mitigating the asset's maximum drawdown.
- Utilizes 100% of the equity to buy, hold, and manage the asset.
- Focuses on long-term growth and capital appreciation by fully investing in the asset during bullish conditions.
- ◓: Mode | %: Risk not applied (In investing mode, the strategy uses 100% of equity to buy the asset)
-----
What's the purpose of using moving averages in this strategy? What are the underlying calculations?
Using moving averages is a widely-used technique to trade with the trend.
The main purpose of using moving averages in this strategy is to filter out bearish price action and to only take trades when the price is trading ABOVE specified moving averages.
The script uses different types of moving averages with user-adjustable timeframes and periods/lengths, allowing traders to try out different variations to maximize strategy performance and minimize drawdowns.
By applying these calculations, the strategy effectively identifies bullish trends and avoids market conditions that are not conducive to profitable trades.
The MA filter allows traders to choose whether they want a specific moving average above or below another one as their entry condition.
This comparison filter can be turned on (>/<) or off.
For example, you can set the filter so that MA#1 > MA#2, meaning the first moving average must be above the second one before the script looks for entry conditions. This adds an extra layer of trend confirmation, ensuring that trades are only taken in more favorable market conditions.
MA #1: Fast MA | MA #2: Medium MA | MA #3: Slow MA
⍺: MA Period | Σ: MA Timeframe
-----
What entry modes are used in this strategy? What are the underlying calculations?
The strategy by default uses two different techniques for the entry criteria with user-adjustable left and right bars: Breakout and Fractal.
1. Breakout Entries :
- The strategy looks for pivot high points with a default period of 3.
- It stores the most recent high level in a variable.
- When the price crosses above this most recent level, the strategy checks if all conditions are met and the bar is closed before taking the buy entry.
◧: Pivot high left bars period | ◨: Pivot high right bars period
2. Fractal Entries :
- The strategy looks for pivot low points with a default period of 3.
- When a pivot low is detected, the strategy checks if all conditions are met and the bar is closed before taking the buy entry.
◧: Pivot low left bars period | ◨: Pivot low right bars period
By utilizing these entry modes, the strategy aims to capitalize on bullish price movements while ensuring that the necessary conditions are met to validate the entry points.
-----
What type of stop-loss identification method are used in this strategy? What are the underlying calculations?
Initial Stop-Loss:
1. ATR Based:
The Average True Range (ATR) is a method used in technical analysis to measure volatility. It is not used to indicate the direction of price but to measure volatility, especially volatility caused by price gaps or limit moves.
Calculation:
- To calculate the ATR, the True Range (TR) first needs to be identified. The TR takes into account the most current period high/low range as well as the previous period close.
The True Range is the largest of the following:
- Current Period High minus Current Period Low
- Absolute Value of Current Period High minus Previous Period Close
- Absolute Value of Current Period Low minus Previous Period Close
- The ATR is then calculated as the moving average of the TR over a specified period. (The default period is 14).
Example - ATR (14) * 1.5
⍺: ATR period | Σ: ATR Multiplier
2. ADR Based:
The Average Day Range (ADR) is an indicator that measures the volatility of an asset by showing the average movement of the price between the high and the low over the last several days.
Calculation:
- To calculate the ADR for a particular day:
- Calculate the average of the high prices over a specified number of days.
- Calculate the average of the low prices over the same number of days.
- Find the difference between these average values.
- The default period for calculating the ADR is 14 days. A shorter period may introduce more noise, while a longer period may be slower to react to new market movements.
Example - ADR (14) * 1.5
⍺: ADR period | Σ: ADR Multiplier
Application in Strategy:
- The strategy calculates the current bar's ADR/ATR with a user-defined period.
- It then multiplies the ADR/ATR by a user-defined multiplier to determine the initial stop-loss level.
By using these methods, the strategy dynamically adjusts the initial stop-loss based on market volatility, helping to protect against adverse price movements while allowing for enough room for trades to develop.
Trailing Stop-Loss:
One of the key elements of this strategy is its ability to detec buyside and sellside liquidity levels across multiple timeframes to trail the stop-loss once the trade is in running profits.
By utilizing this approach, the strategy allows enough room for price to run.
There are two built-in trailing stop-loss (SL) options you can choose from while in a trade:
1. External Trailing Stop-Loss:
- Uses sell-side liquidity to trail your stop-loss, allowing price to consolidate before continuation. This method is less aggressive and provides more room for price fluctuations.
Example - External - Wick below the trailing SL - 12H trailing timeframe
⍺: Exit type | Σ: Trailing stop-loss timeframe
2. Internal Trailing Stop-Loss:
- Uses the most recent swing low with a period of 2 to trail your stop-loss. This method is more aggressive compared to the external trailing stop-loss, as it tightens the stop-loss closer to the current price action.
Example - Internal - Close below the trailing SL - 6H trailing timeframe
⍺: Exit type | Σ: Trailing stop-loss timeframe
Each market behaves differently across various timeframes, and it is essential to test different parameters and optimizations to find out which trailing stop-loss method gives you the desired results and performance.
-----
What type of break-even and take profit identification methods are used in this strategy? What are the underlying calculations?
For Break-Even:
- You can choose to set a break-even level at which your initial stop-loss moves to the entry price as soon as it hits, and your trailing stop-loss gets activated (if enabled).
- You can select either a percentage (%) or risk-to-reward (RR) based break-even, allowing you to set your break-even level as a percentage amount above the entry price or based on RR.
For TP1 (Take Profit 1):
- You can choose to set a take profit level at which your position gets fully closed or 50% if the TP2 boolean is enabled.
- Similar to break-even, you can select either a percentage (%) or risk-to-reward (RR) based take profit level, allowing you to set your TP1 level as a percentage amount above the entry price or based on RR.
For TP2 (Take Profit 2):
- You can choose to set a take profit level at which your position gets fully closed.
- As with break-even and TP1, you can select either a percentage (%) or risk-to-reward (RR) based take profit level, allowing you to set your TP2 level as a percentage amount above the entry price or based on RR.
The underlying calculations involve determining the price levels at which these actions are triggered. For break-even, it moves the initial stop-loss to the entry price and activate the trailing stop-loss once the break-even level is reached.
For TP1 and TP2, it's specifying the price levels at which the position is partially or fully closed based on the chosen method (percentage or RR) above the entry price.
These calculations are crucial for managing risk and optimizing profitability in the strategy.
⍺: BE/TP type (%/RR) | Σ: how many RR/% above the current price
-----
What's the ADR filter? What does it do? What are the underlying calculations?
The Average Day Range (ADR) measures the volatility of an asset by showing the average movement of the price between the high and the low over the last several days.
The period of the ADR filter used in this strategy is tied to the same period you've used for your initial stop-loss.
Users can define the minimum ADR they want to be met before the script looks for entry conditions.
ADR Bias Filter:
- Compares the current bar ADR with the ADR (Defined by user):
- If the current ADR is higher, it indicates that volatility has increased compared to ADR (DbU).(⬆)
- If the current ADR is lower, it indicates that volatility has decreased compared to ADR (DbU).(⬇)
Calculations:
1. Calculate ADR:
- Average the high prices over the specified period.
- Average the low prices over the same period.
- Find the difference between these average values in %.
2. Current ADR vs. ADR (DbU):
- Calculate the ADR for the current bar.
- Calculate the ADR (DbU).
- Compare the two values to determine if volatility has increased or decreased.
By using the ADR filter, the strategy ensures that trades are only taken in favorable market conditions where volatility meets the user's defined threshold, thus optimizing entry conditions and potentially improving the overall performance of the strategy.
>: Minimum required ADR for entry | %: Current ADR comparison to ADR of 14 days ago.
-----
What's the probability filter? What are the underlying calculations?
The probability filter is designed to enhance trade entries by using buyside liquidity and probability analysis to filter out unfavorable conditions.
This filter helps in identifying optimal entry points where the likelihood of a profitable trade is higher.
Calculations:
1. Understanding Swing highs and Swing Lows
Swing High: A Swing High is formed when there is a high with 2 lower highs to the left and right.
Swing Low: A Swing Low is formed when there is a low with 2 higher lows to the left and right.
2. Understanding the purpose and the underlying calculations behind Buyside, Sellside and Equilibrium levels.
3. Understanding probability calculations
1. Upon the formation of a new range, the script waits for the price to reach and tap into equilibrium or the 50% level. Status: "⏸" - Inactive
2. Once equilibrium is tapped into, the equilibrium status becomes activated and it waits for either liquidity side to be hit. Status: "▶" - Active
3. If the buyside liquidity is hit, the script adds to the count of successful buyside liquidity occurrences. Similarly, if the sellside is tapped, it records successful sellside liquidity occurrences.
5. Finally, the number of successful occurrences for each side is divided by the overall count individually to calculate the range probabilities.
Note: The calculations are performed independently for each directional range. A range is considered bearish if the previous breakout was through a sellside liquidity. Conversely, a range is considered bullish if the most recent breakout was through a buyside liquidity.
Example - BSL > 50%
-----
What's the sentiment Filter? What are the underlying calculations?
Sentiment filter aims to calculate the percentage level of bullish or bearish fluctuations within equally divided price sections, in the latest price range.
Calculations:
This filter calculates the current sentiment by identifying the highest swing high and the lowest swing low, then evenly dividing the distance between them into percentage amounts. If the price is above the 50% mark, it indicates bullishness, whereas if it's below 50%, it suggests bearishness.
Sentiment Bias Identification:
Bullish Bias: The current price is trading above the 50% daily range.
Bearish Bias: The current price is trading below the 50% daily range.
Example - Sentiment Enabled | Bullish degree above 50% | Bullish sentimental bias
>: Minimum required sentiment for entry | %: Current sentimental degree in a (Bullish/Bearish) sentimental bias
-----
What's the range length Filter? What are the underlying calculations?
The range length filter identifies the price distance between buyside and sellside liquidity levels in percentage terms. When enabled, the script only looks for entries when the minimum range length is met. This helps ensure that trades are taken in markets with sufficient price movement.
Calculations:
Range Length (%) = ( ( Buyside Level − Sellside Level ) / Current Price ) ×100
Range Bias Identification:
Bullish Bias: The current range price has broken above the previous external swing high.
Bearish Bias: The current range price has broken below the previous external swing low.
Example - Range length filter is enabled | Range must be above 5% | Price must be in a bearish range
>: Minimum required range length for entry | %: Current range length percentage in a (Bullish/Bearish) range
-----
What's the day filter Filter, what does it do?
The day filter allows users to customize the session time and choose the specific days they want to include in the strategy session. This helps traders tailor their strategies to particular trading sessions or days of the week when they believe the market conditions are more favorable for their trading style.
Customize Session Time:
Users can define the start and end times for the trading session.
This allows the strategy to only consider trades within the specified time window, focusing on periods of higher market activity or preferred trading hours.
Select Days:
Users can select which days of the week to include in the strategy.
This feature is useful for excluding days with historically lower volatility or unfavorable trading conditions (e.g., Mondays or Fridays).
Benefits:
Focus on Optimal Trading Periods:
By customizing session times and days, traders can focus on periods when the market is more likely to present profitable opportunities.
Avoid Unfavorable Conditions:
Excluding specific days or times can help avoid trading during periods of low liquidity or high unpredictability, such as major news events or holidays.
Increased Flexibility: The filter provides increased flexibility, allowing traders to adapt the strategy to their specific needs and preferences.
Example - Day filter | Session Filter
θ: Session time | Exchange time-zone
-----
What tables are available in this script?
Table Type:
- Summary: Provides a general overview, displaying key performance parameters such as Net Profit, Profit Factor, Max Drawdown, Average Trade, Closed Trades, Compound Annual Growth Rate (CAGR), MAR and more.
CAGR: It calculates the 'Compound Annual Growth Rate' first and last taken trades on your chart. The CAGR is a notional, annualized growth rate that assumes all profits are reinvested. It only takes into account the prices of the two end points — not drawdowns, so it does not calculate risk. It can be used as a yardstick to compare the performance of two strategies. Since it annualizes values, it requires a minimum 4H timeframe to display the CAGR value. annualizing returns over smaller periods of times doesn't produce very meaningful figures.
MAR: Measure of return adjusted for risk: CAGR divided by Max Drawdown. Indicates how comfortable the system might be to trade. Higher than 0.5 is ideal, 1.0 and above is very good, and anything above 3.0 should be considered suspicious and you need to make sure the total number of trades are high enough by running a Deep Backtest in strategy tester. (available for TradingView Premium users.)
Avg Trade: The sum of money gained or lost by the average trade generated by a strategy. Calculated by dividing the Net Profit by the overall number of closed trades. An important value since it must be large enough to cover the commission and slippage costs of trading the strategy and still bring a profit.
MaxDD: Displays the largest drawdown of losses, i.e., the maximum possible loss that the strategy could have incurred among all of the trades it has made. This value is calculated separately for every bar that the strategy spends with an open position.
Profit Factor: The amount of money a trading strategy made for every unit of money it lost (in the selected currency). This value is calculated by dividing gross profits by gross losses.
Avg RR: This is calculated by dividing the average winning trade by the average losing trade. This field is not a very meaningful value by itself because it does not take into account the ratio of the number of winning vs losing trades, and strategies can have different approaches to profitability. A strategy may trade at every possibility in order to capture many small profits, yet have an average losing trade greater than the average winning trade. The higher this value is, the better, but it should be considered together with the percentage of winning trades and the net profit.
Winrate: The percentage of winning trades generated by a strategy. Calculated by dividing the number of winning trades by the total number of closed trades generated by a strategy. Percent profitable is not a very reliable measure by itself. A strategy could have many small winning trades, making the percent profitable high with a small average winning trade, or a few big winning trades accounting for a low percent profitable and a big average winning trade. Most trend-following successful strategies have a percent profitability of 15-40% but are profitable due to risk management control.
BE Trades: Number of break-even trades, excluding commission/slippage.
Losing Trades: The total number of losing trades generated by the strategy.
Winning Trades: The total number of winning trades generated by the strategy.
Total Trades: Total number of taken traders visible your charts.
Net Profit: The overall profit or loss (in the selected currency) achieved by the trading strategy in the test period. The value is the sum of all values from the Profit column (on the List of Trades tab), taking into account the sign.
- Monthly: Displays performance data on a month-by-month basis, allowing users to analyze performance trends over each month.
- Weekly: Displays performance data on a week-by-week basis, helping users to understand weekly performance variations.
- OFF: Hides the performance table.
Labels:
- OFF: Hides labels in the performance table.
- PnL: Shows the profit and loss of each trade individually, providing detailed insights into the performance of each trade.
- Range: Shows the range length and Average Day Range (ADR), offering additional context about market conditions during each trade.
Profit Color:
- Allows users to set the color for representing profit in the performance table, helping to quickly distinguish profitable periods.
Loss Color:
- Allows users to set the color for representing loss in the performance table, helping to quickly identify loss-making periods.
These customizable tables provide traders with flexible and detailed performance analysis, aiding in better strategy evaluation and optimization.
-----
User-input styles and customizations:
To facilitate studying historical data, all conditions and rules can be applied to your charts. By plotting background colors on your charts, you'll be able to identify what worked and what didn't in certain market conditions.
Please note that all background colors in the style are disabled by default to enhance visualization.
-----
How to Use This Algobuilder to Create a Profitable Edge and System:
Choose Your Strategy mode:
- Decide whether you are creating an investing strategy or a trading strategy.
Select a Market:
- Choose a one-sided market such as stocks, indices, or cryptocurrencies.
Historical Data:
- Ensure the historical data covers at least 10 years of price action for robust backtesting.
Timeframe Selection:
- Choose the timeframe you are comfortable trading with. It is strongly recommended to use a timeframe above 15 minutes to minimize the impact of commissions on your profits.
Set Commission and Slippage:
- Properly set the commission and slippage in the strategy properties according to your broker or prop firm specifications.
Parameter Optimization:
- Use trial and error to test different parameters until you find the performance results you are looking for in the summary table or, preferably, through deep backtesting using the strategy tester.
Trade Count:
- Ensure the number of trades is 100 or more; the higher, the better for statistical significance.
Positive Average Trade:
- Make sure the average trade value is above zero.
(An important value since it must be large enough to cover the commission and slippage costs of trading the strategy and still bring a profit.)
Performance Metrics:
- Look for a high profit factor, MAR (Mar Ratio), CAGR (Compound Annual Growth Rate), and net profit with minimum drawdown. Ideally, aim for a drawdown under 20-30%, depending on your risk tolerance.
Refinement and Optimization:
- Try out different markets and timeframes.
- Continue working on refining your edge using the available filters and components to further optimize your strategy.
Automation:
- Once you’re confident in your strategy, you can use the automation section to connect the algorithm to your broker or prop firm.
- Trade a fully automated and backtested trading strategy, allowing for hands-free execution and management.
-----
What makes this strategy original?
1. Incorporating direct integration of probabilities into the strategy.
2. Leveraging market sentiment to construct a profitable approach.
3. Utilizing built-in market structure-based trailing stop-loss mechanisms across various timeframes.
4. Offering both investing and trading strategies, facilitating optimization from different perspectives.
5. Automation for efficient execution.
6. Providing a summary table for instant access to key parameters of the strategy.
-----
How to use automation?
For Traders:
1. Ensure the strategy parameters are properly set based on your optimized parameters.
2. Enter your PineConnector License ID in the designated field.
3. Specify the desired risk level.
4. Provide the Metatrader symbol.
5. Check for chart updates to ensure the automation table appears on the top right corner, displaying your License ID, risk, and symbol.
6. Set up an alert with the strategy selected as Condition and the Message as {{strategy.order.alert_message}}.
7. Activate the Webhook URL in the Notifications section, setting it as the official PineConnector webhook address.
8. Double-check all settings on PineConnector to ensure the connection is successful.
9. Create the alert for entry/exit automation.
For Investors:
1. Ensure the strategy parameters are properly set based on your optimized parameters.
2. Choose "Investing" in the user-input settings.
3. Create an alert with a specified name.
4. Customize the notifications tab to receive alerts via email.
5. Buying/selling alerts will be triggered instantly upon entry or exit order execution.
----
Strategy Properties
This script backtest is done on 4H COINBASE:BTCUSD , using the following backtesting properties:
Balance: $5000
Order Size: 10% of the equity
Risk % per trade: 1%
Commission: 0.04% (Default commission percentage according to TradingView competitions rules)
Slippage: 75 ticks
Pyramiding: 2
-----
Terms and Conditions | Disclaimer
Our charting tools are provided for informational and educational purposes only and should not be construed as financial, investment, or trading advice. They are not intended to forecast market movements or offer specific recommendations. Users should understand that past performance does not guarantee future results and should not base financial decisions solely on historical data.
Built-in components, features, and functionalities of our charting tools are the intellectual property of @Fractalyst Unauthorized use, reproduction, or distribution of these proprietary elements is prohibited.
By continuing to use our charting tools, the user acknowledges and accepts the Terms and Conditions outlined in this legal disclaimer and agrees to respect our intellectual property rights and comply with all applicable laws and regulations.

Forex & Stock Daily WatchList And Screener [M]Hi, this is a watchlist and screener indicator for Forex and Stocks.
This indicator is designed for traders who trade in the forex markets and monitor developments in indices and other currency pairs.
It includes information on 14 indices such as the volatility index, Baltic dry index, etc. You can customize the indices as you wish. The indices table contains the index's price (or points), daily change, stochastic value, and trend direction.
The second table is designed for trading forex and stock currency pairs.
In this table, you will find information such as price, volume, change, stochastic, RSI, trend direction, and MACD result for all traded pairs. You can customize all the currency pairs in this table as you wish, and you can also tailor the oscillator settings to your preferences.
In the settings section, you can use checkboxes to hide the pairs in both tables.
The "Customize" section in the settings allows you to personalize the table appearances according to your preferences.
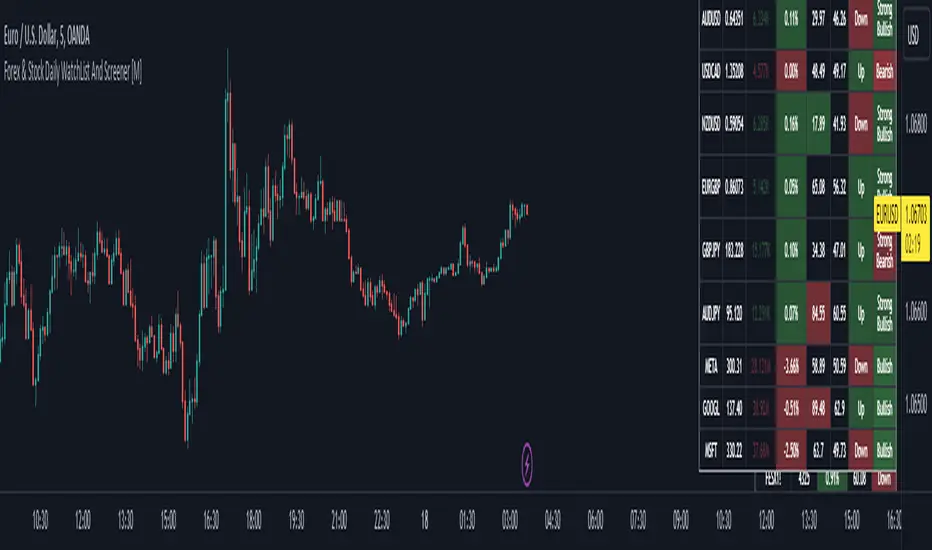
Scalping The Bull - BullBot for Stock and ForexName : Scalping The Bull - BullBot for Stock and Forex.
Category : Scalping tool for the Stock and Forex market, optimized for trend following and mean reversal operations.
Timeframe : Recommended to be used on timeframe 1m, 5m, 30m, 1h, 1D, depending on the specific technique.
Technical Analysis : The indicator implements the trading techniques of Scalping The Bull. Even if the techniques are exquisitely discretionary, we have written the indicator with our interpretation of the them to identify the patterns automatically. We also codified a the process described below, giving the possibility to trade mechanically. The indicator is designed for a short-term (intraday or scalping) trend-following approach, where the entry is made on the breakout of significant price levels. Entry setups are calculated by price action analysis using 5-10-50-200 EMAs as reference. According to the interaction of price action with the EMAs, patterns are generated, and the indicator finds them independently.
Suggested use :
The process follows:
1. Selection of the instrument to trade on
Given the short duration of the trades, there must be sufficient volatility and liquidity. You can add the different instruments to a TradingView watch list and then make a first skim, considering the daily percentage change. Once an instrument has been selected, the indicator allows you to check at a glance things like the Rate of Change (ROC) and the detection of opening gaps.
2. Identification of the main trend
Once in the instrument, the main trend of the underlying is identified through the 50-200 EMAs: if the fast EMA is greater than the slow one, we have a bullish trend, otherwise a bearish trend on a higher timeframe than the one in which the trade is executed. The rule is to trade in favor of the main trend. For this reason, the indicator prints to chart reference averages. It is also recommended to check the daily timeframe, always using the averages, preferring those instruments where the price follows an average without touching it too often.
3. Identification of breakout levels
Breakout levels favoring the trend are identified near the daily high/minimum, the previous day's high/minimum, or the weekly high/minimum. The indicator prints such levels on the chart with lines.
4. Identification of secondary trends and entry levels
Patterns can be divided into three categories. Trend-based ones have the function of identifying the secondary trend and then confirming the trade. Breakout patterns are used to find entry levels.
a. Trend Continuation Patterns (Price/EMA) : are used to get confirmation that the minor trend is in agreement with the major trend (i.e., Shimano, Dive, Dip, Anti-crossing).
b. Trend Change Patterns (Price/EMA) : are used to get confirmation that a minor trend in the opposite direction of the main trend is ending and therefore are used to get further confirmation of the trade (i.e., Bounce, Viagra, Return to Highs/Minimums).
c. Breakout Patterns : identify the optimal price levels for trade entry (i.e., Third Touch, Bud, Maxi Bud, Color Change).
Details on how the specific patterns are computed can be found below in the description of this indicator.
5. Definition of Stop Loss and Take Profit
Once the entry price is calculated, different types of Stop Loss (e.g., relative minimum of Tot candles, first or second average below price, price levels) and Take Profit (relative maximum of Tot candles, first or second average above price, price levels) can be considered. A risk/reward ratio of at least 1.2 should always be considered, depending on one's risk appetite.
6. Define the position management strategy
Normally, when a mock breakout is executed, the advice is to exit the trade as soon as possible or at least to bring the stop-loss to break even. A trailing stop on relative lows or the nearest average is also possible.
7. Enter the position
Usually, with a stop order, follow the rules defined in the previous steps.
Configuration :
Graphical configuration :
Show ROC filter : turns the background green when the asset has enough volatility to activate patterns.
Show Legend : enables the description on the lines of the trigger points.
Show Table : displays the volatility table where the GAP and ROC (Rate of Change) information is present.
Show Take Profit % - Automatic : shows the percentage scale that automatically adjusts to the volatility of the chart to identify the Take Profit and Stop Loss at a glance.
Label color : adjusts the color of the labels.
Trigger Point Colors : Adjust the colors of the trigger points.
Trigger Points
Today's highs and lows : draw on the chart the closing price of Yesterday, the opening price of the daily candlestick, and the highs and lows of the day (high in purple, low in red, Yesterday's close in green, and open in orange).
Yesterday's highs and lows : draw on the chart the highs and lows of the previous day (high in yellow, low in red). An alert can be activated with a % offset.
Weekly highs and lows : draw the highs and lows of the previous week on the chart (high in white, low in red). An alert can be activated with a % offset.
Price Patterns :
Gap : a label and an alert can be activated.
Pay..!! : a label and an alert can be activated.
Third Touch and Third Touch on EMA : a label and an alert can be activated.
Return to Highs : a label and an alarm can be activated.
Return to Lows : a label and an alarm can be activated.
Long and Short Color Change : a label and an alert can be activated.
EMA Patterns :
Viagra long and short : a label and an alert can be activated for the specific market and EMA situations.
Shimano : a label and an alert can be activated with a configurable candlestick threshold.
Emergence - Dive : a label and an alert can be activated.
Anti-crossing - Anti-crossing short : a label and an alarm can be activated.
Bounce on EMA long and short : a label and an alert can be activated with a configurable tick tolerance.
Bud - Maxi Bud - Bud Short : a label and an alert can be activated on all timeframes.
Alerts :
Activate all alerts : you can activate alerts by clicking on Alerts, then on the condition "BullBot" and then on "Any alert() function.". So that you know, creating alerts on the price-EMA crossing is also possible.
Patterns :
The list of patterns that are automatically recognized by the indicator follows.
Gap : indicates when a Gap Up or Gap Down occurs at the opening of a session, particularly useful in the equity markets.
Pay : signals when the stock has risen by a sufficient percentage to be tradable, adjusts the triggering of many bounce and breakout patterns.
Viagra : signaled for both a long and short setup, indicates an overbought or oversold situation by the appearance of gaps and a series of consecutive candles contained by the fast EMAs (5 -10) depending on the market of reference.
Third touch and third touch EMA : signals a breakout conformation, indicated when three touches occur at the same price level or below one of the slow EMAs (50 - 200).
Shimano : detects lateralization between Ema 50 and Ema 200, indicating that we are in a retracement phase and that a new impulsive move may soon develop.
Emergence - Dive : these are the main patterns for identifying the trend. The indicator signals when the EMA 50 and 200 are approaching to anticipate their crossing to the top or bottom.
Anti-crossing long - Anti-crossing short : occurs when the price, after an important impulse, makes a retracement to the EMA 200, bringing the EMA 50 to approach it without ever touching it, but before the cross, an opposite impulse determines the end of the retracement and the resumption of the trend in place.
Rebound : signals in the first rebound on the EMA 50 and EMA 200 after an impulse that recorded new highs or lows.
Return to the Highs - Return to the Lows : this pattern is closely related to rebounds. It indicates that the price is approaching the highs or lows again after a rebound on a slow EMA.
Change Color : is based on the previous session's closing price. It indicates when the price is approaching either from above or below this level, which determines the Color of the daily candlestick.
Bud - Maxi Bud - Bud Short : Bud occurs when the price breaks above EMA 10, and there are at least two consecutive candles between the high and low of the breakout impulse. Maxi Bud signals near the day's highs when this situation occurs, and Bud Short signals the breakout levels for a short trade.

CE - Market Performance TableThe 𝓜𝓪𝓻𝓴𝓮𝓽 𝓟𝓮𝓻𝓯𝓸𝓻𝓶𝓪𝓷𝓬𝓮 𝓣𝓪𝓫𝓵𝓮 is a sophisticated market tool designed to provide valuable insights into the current market trends and the approximate current position in the Macroeconomic Regime.
Furthermore the 𝓜𝓪𝓻𝓴𝓮𝓽 𝓟𝓮𝓻𝓯𝓸𝓻𝓶𝓪𝓷𝓬𝓮 𝓣𝓪𝓫𝓵𝓮 provides the Correlation Implied Trend for the Asset on the Chart. Lastly it provides information about current "RISK ON" or "RISK OFF" periods.
Methodology:
𝓜𝓪𝓻𝓴𝓮𝓽 𝓟𝓮𝓻𝓯𝓸𝓻𝓶𝓪𝓷𝓬𝓮 𝓣𝓪𝓫𝓵𝓮 tracks the 15 underlying Stock ETF's to identify their performance and puts the combined performances together to visualize 42MACRO's GRID Equity Model.
For this it uses the below ETF's:
Dividends (SPHD)
Low Beta (SPLV)
Quality (QUAL)
Defensives (DEF)
Growth (IWF)
High Beta (SPHB)
Cyclicals (IYT, IWN)
Value (IWD)
Small Caps (IWM)
Mid Caps (IWR)
Mega Cap Growth (MGK)
Size (OEF)
Momentum (MTUM)
Large Caps (IWB)
Overall Settings:
The main time values you want to change are:
Correlation Length
- Defines the time horizon for the Correlation Table
ROC Period
- Defines the time horizon for the Performance Table
Normalization lookback
- Defines the time horizon for the Trend calculation of the ETF's
- For longer term Trends over weeks or months a length of 50 is usually pretty accurate
Visuals:
There is a variety of options to change the visual settings of what is being plotted and the two table positions and additional considerations.
Everything that is relevant in the underlying logic that can help comprehension can be visualized with these options.
Market Correlation:
The Market Correlation Table takes the Correlation of the above ETF's to the Asset on the Chart, it furthermore uses the Normalized KAMA Oscillator by IkkeOmar to analyse the current trend of every single ETF.
It then Implies a Correlation based on the Trend and the Correlation to give a probabilistically adjusted expectation for the future Chart Asset Movement. This is strengthened by taking the average of all Implied Trends.
With this the Correlation Table provides valuable insights about probabilistically likely Movement of the Asset, for Traders and Investors alike, over the defined time duration.
Market Performance:
𝓜𝓪𝓻𝓴𝓮𝓽 𝓟𝓮𝓻𝓯𝓸𝓻𝓶𝓪𝓷𝓬𝓮 𝓣𝓪𝓫𝓵𝓮 is the actual valuable part of this Indicator.
It provides valuable information about the current market environment (whether it's risk on or risk off), the rough GRID models from 42MACRO and the actual market performance.
This allows you to obtain a deeper understanding of how the market works and makes it simple to identify the actual market direction.
Utility:
The 𝓜𝓪𝓻𝓴𝓮𝓽 𝓟𝓮𝓻𝓯𝓸𝓻𝓶𝓪𝓷𝓬𝓮 𝓣𝓪𝓫𝓵𝓮 is divided in 4 Sections which are the GRID regimes:
Economic Growth:
Goldilocks
Reflation
Economic Contraction:
Inflation
Deflation
Top 5 Equity Style Factors:
Are the values green for a specific Column? If so then the market reflects the corresponding GRID behavior.
Bottom 5 Equity Style Factors:
Are the values red for a specific Column? If so then the market reflects the corresponding GRID behavior.
So if we have Goldilocks as current regime we would see green values in the Top 5 Goldilocks Cells and red values in the Bottom 5 Goldilocks Cells.
You will find that Reflation will look similar, as it is also a sign of Economic Growth.
Same is the case for the two Contraction regimes.

kyle algo v1
Integration of multiple technical indicators: The strategy mainly combines two technical indicators - Keltner Channels and Supertrend, to generate trading signals. It also calculates fifteen exponential moving averages (EMAs) for the high price with different periods ranging from 9 to 51.
Unique combination of indicators: The traditional Supertrend typically uses Average True Range (ATR) to calculate its upper and lower bands. In contrast, this script modifies the approach to use Keltner Channels instead.
Flexible sensitivity adjustment: This strategy provides a "sensitivity" input parameter for users to adjust, which controls the multiplier for the range in the Supertrend calculation. This can make the signals more or less sensitive to price changes, allowing users to tailor the strategy to their own risk tolerance and trading style.
EMA Energy Representation: The code offers a visualization of "EMA Energy", which color-codes the EMA lines based on whether the closing price is above or below the EMA line. This can provide an intuitive understanding of market trends.
Clear visual signals: The strategy generates clear "BUY" and "SELL" signals, represented as labels on the chart. This makes it easy to identify potential entry and exit points in the market.
Customizable: The script provides several user inputs, making it possible to fine-tune the strategy according to different market conditions and individual trading preferences.
EMA (Exponential Moving Average) Principle:
The EMA is a type of moving average that assigns more weight to the most recent data.
It responds more quickly to recent price changes and is used to capture short-term price trends.
Principle of Color Change :
In this trading strategy, the color of the EMA line changes based on whether the closing price is above or below the EMA. If the closing price is above the EMA, the EMA line turns green,
indicating an upward price trend. Conversely, if the closing price is below the EMA, the EMA line turns red,
indicating a downward price trend. These color changes help traders to more intuitively identify price trends
In short, our team provides a lot of practical space
That is your development space

Output7The "Output7" indicator is designed to guide traders in identifying potential buy and sell signals. This is achieved through the calculation of a custom indicator named `output7` and its derived moving averages. `output7` is defined as `c_1 - c_20 * (ohlcSq / hlSq)`. Here, `ohlcSq` stands for the square of the average of open, high, low, and close prices, while `hlSq` signifies the square of the average of high and low prices. `c_20` and `c_1` correspond to the closing price 20 periods ago and the current closing price, respectively.
**Interpreting the Indicator:**
**1. Support and Resistance**: This indicator calculates the support and resistance levels for the `output7` over a predefined lookback period. These levels are essential in the identification of potential price reversals in the market. When the `output7` line approaches or crosses these levels, it may suggest significant market shifts.
**2. Moving Averages of `output7`**: The indicator also generates short-term (5 periods by default) and long-term (10 periods by default) simple moving averages (SMAs) of the `output7` value. These SMAs can be helpful in determining market trends. When the short-term SMA lies above the long-term SMA, it indicates an upward trend. Conversely, when it falls below, it suggests a downward trend.
**3. Buy and Sell Signals**: The Output7 indicator generates two types of buy and sell signals based on the crossover of different moving averages. Yellow signals are produced when the simple moving average of close prices (7 periods by default) crosses the exponential moving average of close prices (14 periods by default). The blue signals are generated when the short-term SMA of `output7` crosses the long-term SMA of `output7`.
It is important to note that like all technical analysis tools, the Output7 indicator should not be used in isolation. Instead, it should be combined with other forms of analysis and indicators to validate its signals and minimize the likelihood of false signals. Factors such as the overall market trend, price patterns, volume, and fundamental analysis can provide additional context to the signals provided by the Output7 indicator. The interpretation of these signals should align with a trader's overall trading strategy, risk tolerance, and financial goals.
And finally. If you discover something else regarding this indicator. Please let me know in the comment section.

Rainbow Drift BetaRainbow Drift Beta is an indicator that detects the triggers of long and short positions at any TF.
It's based on two different type of approaches to the EMAs periods:
- Classic EMAs periods: 10 and 50
- Cycle EMAs perdios: 16, 64 and 256
The 256 period EMA (Annual Cycle) detects the trend: if the EMA 64 (Three-Weekly Cycle) is above, it shows an uptrend; while the EMA 64 is below, it means that the price action is in downtrend.
10 and 16 periods EMAs are working together as well as the 50 and the 64. The first couple reacts faster than the second one and as soon as the 10 is above the 16, the band shows the first attempt of the price action to go in the uptrend direction. The same concept is applied to the second couple (50, 64): when EMA 50 > EMA 64 it's a confirmation of the faster EMAs long direction. Viceverca happens for the downtrend but with the same concept.
As the EMA periods taken in consideration are quite often a sensitive level of reaction of the price, the indicator detects when there is trigger of a long or a short set up and plots a label on the chart. It's possibile to set up an alert as well.
Quite important, the indicator is looking for sideways patterns as the breakout of them shows a clear direction of the price.
Moreover, in order to privide the first and the best entry possibile, the indicator has a function that is triggering only one time as the trend reverted: for example, a long entry on the EMA 10-16 happens only one time since they crossover the EMA 64.
As included in the name, this is a beta version and new improvements will be added in the near future like suggested price entry, SL and TP, and the focus of the development is to avoid as much as possibile the false triggers.
Of course the best way to improve the code is to receive the users' feedbacks, so please feel free to post your comments and questions.

Rocket Grid Algorithm - The Quant ScienceThe Rocket Grid Algorithm is a trading strategy that enables traders to engage in both long and short selling strategies. The script allows traders to backtest their strategies with a date range of their choice, in addition to selecting the desired strategy - either SMA Based Crossunder or SMA Based Crossover.
The script is a combination of trend following and short-term mean reversing strategies. Trend following involves identifying the current market trend and riding it for as long as possible until it changes direction. This type of strategy can be used over a medium- to long-term time horizon, typically several months to a few years.
Short-term mean reversing, on the other hand, involves taking advantage of short-term price movements that deviate from the average price. This type of strategy is usually applied over a much shorter time horizon, such as a few days to a few weeks. By rapidly entering and exiting positions, the strategy seeks to capture small, quick gains in volatile market conditions.
Overall, the script blends the best of both worlds by combining the long-term stability of trend following with the quick gains of short-term mean reversing, allowing traders to potentially benefit from both short-term and long-term market trends.
Traders can configure the start and end dates, months, and years, and choose the length of the data they want to work with. Additionally, they can set the percentage grid and the upper and lower destroyers to manage their trades effectively. The script also calculates the Simple Moving Average of the chosen data length and plots it on the chart.
The trigger for entering a trade is defined as a crossunder or crossover of the close price with the Simple Moving Average. Once the trigger is activated, the script calculates the total percentage of the side and creates a grid range. The grid range is then divided into ten equal parts, with each part representing a unique grid level. The script keeps track of each grid level, and once the close price reaches the grid level, it opens a trade in the specified direction.
The equity management strategy in the script involves a dynamic allocation of equity to each trade. The first order placed uses 10% of the available equity, while each subsequent order uses 1% less of the available equity. This results in the allocation of 9% for the second order, 8% for the third order, and so on, until a maximum of 10 open trades. This approach allows for risk management and can help to limit potential losses.
Overall, the Rocket Grid Algorithm is a flexible and powerful trading strategy that can be customized to meet the specific needs of individual traders. Its user-friendly interface and robust backtesting capabilities make it an excellent tool for traders looking to enhance their trading experience.
