Bjorgum RSIRSI output signals are displayed with color change to reflect the plotted value. This makes evaluating RSI conditions require but a glance.
RSI momentum buy signals are given on the cross of the 50 level, whereas sell signals are given on a fall below.
Default values a 5 period RSI which gives more timely entrances and exits for swing traders. This can be adjusted to the typical 14 period if the viewer desires slower signals.
Bullish and bearish area is shaded to accentuate the signal to the eye.
Excellent results can be found when coupling BJ RSI, with BJ TSI, and the reversal system using all 3 as a complete together simultaneously
Default color changes are plotted as a recorded value falls within the following levels:
RSI < 30 = green
RSI 30-50 = red
RSI 50-70 = blue
RSI 70-80 = yellow
RSI 80-90 = orange
RSI 90-100 = white hot
Stochastic RSI (STOCH RSI)

MACD Trend CandlesThe script combines 2 indicators (MACD and Stoch-RSI) and puts them visually directly on the candles - can be used with normal OHLC candles or Heiken Ashi candles. Furthermore, you can derive divergences exremely easy directly visually from the candles as well. Lastly, a SMA 20 high and a SMA 20 low line build a trend channel.
Script is best used in trending markets to trade with the trend.
1) SMA trend channel:
* uptrend: close above
* downtrend: close below
* aggressive entry (uptrend) closing inside channel from below
* conservative entry (uptrend) closing above channel from inside
* hold (uptrend) until close below channel
* can be used accordingly for the downtrend
2) MACD candles
* visualization of the MACD histogram directly on the candles
* dark blue: histogram > 0 and histogram > histogram of previous candle
* light blue: histogram > 0 and histogram < histogram of previous candle
* orange: histogram < 0 and histogram < histogram of previous candle
* light blue: histogram < 0 and histogram > histogram of previous candle
* hold uptrend (dark/light blue candles) - combined with trend channel (above channel)
* hold downtrend (orange /yellow candles) - combined with trend channel (below channel)
* Color divergence: light blue candle > dark blue candle (price and MACD show divergence (bearish)
* Color divergence: yellow candle < orange candle (price and MACD show divergence (bullish)
* Trend change (0 line cross to upside) yellow or orange to dark blue
* Trend change (0 line cross to downside) dark or light blue to orange
3) Stoch RSI diamonds
* visualization of the STOCH-RSI as diamonds above or below the candle
* k, d line > 80: diamond above the candle
* k, d line < 20: diamond below the candle
* divergence caldle without diamond above > candle with diamond above (bearish divergence)
* divergence caldle without diamond below < candle with diamond below (bullish divergence)
Feel free to test each part individually and combine it with other indicators, e.g. BBands and Ichimoku Cloud - you will see it is a powerful visualization script
HAVE FUN

Cyclic Smoothed RSI with Divergence IndicatorI created a single indicator that combines 1) Cyclic Smoothed RSI and 2) the Divergence indicator (bull, bear). It is very handy when used with the MACD and crossover points.
Please refer to for info on how to use the cRSI indicator.
Info on the chart.
1) Red dotted lines = cRSI crossed back from overbought and crossover in MACD
2) Red solid lines = Bear divergence and crossover in MACD
3) Green dotted lines = cRSI crossed back from oversold and crossover in MACD
4) Green solid lines = Bull divergence and crossover in MACD
5) Black transition = cRSI crossover but NO crossover in MACD

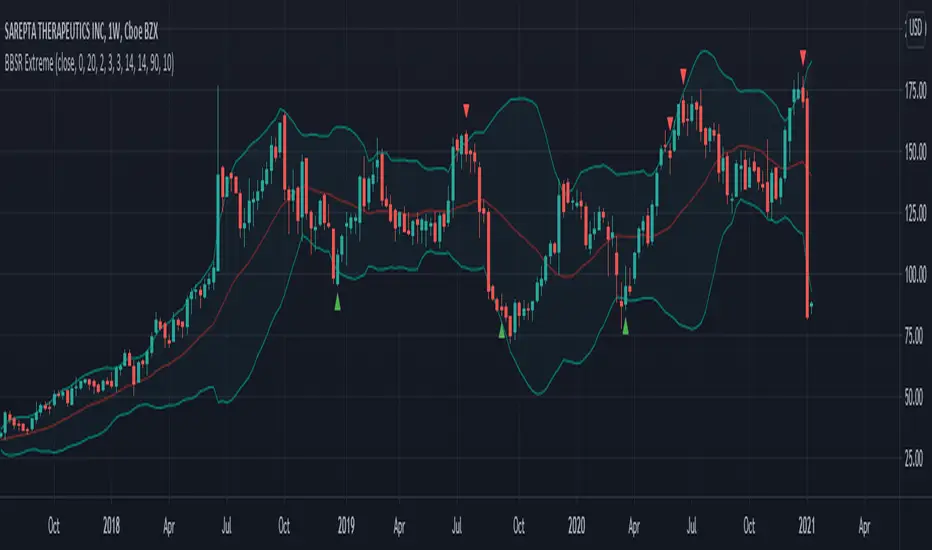
Bollinger Bands Stochastic RSI Extreme SignalThis is the finalized code released to the public that I created in a video linked here.
This indicators combines a Bollinger Band and Stochastic RSI to produce signals for possible price reversal. The signals are displayed by default as green arrows for bullish and red arrows for bearish.
To trigger a signal the indicator checks for the following:
(Bullish)
A candle closes above the upper Bollinger Band
The following candle closes within the upper Bollinger Band
The RSI Stochastic is below the set threshold (10 by default)
(Bearish)
A candle closes below the lower Bollinger Band
The following candle closes within the lower Bollinger Band
The RSI Stochastic is above the set threshold (90 by default)
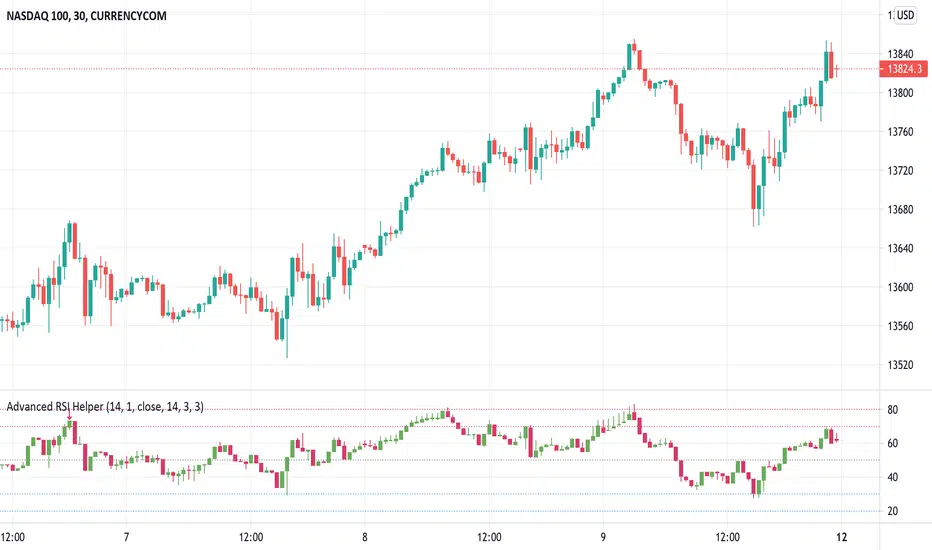
Advanced RSI HelperHere is Advanced RSI Helper. An advanced RSI represented in a candle type chart. It contains a Stochastic and a Pivot Detector (High-Low) and RSI divergences.
It also contains a Filter which you can configure the upper, lower zone to colorize the bars on the chart only when you are overbought or oversold, when you are in range the bars appear "transparent".
You also have the option of placing alerts for divergences or when the rsi exceeds the upper zone 1 / 2 or lower zone 1 / 2.
if you encounter any bugs do not hesitate to let me know in the comment area. The same goes for your suggestions.
Cheers and remember, risk management is the most important!
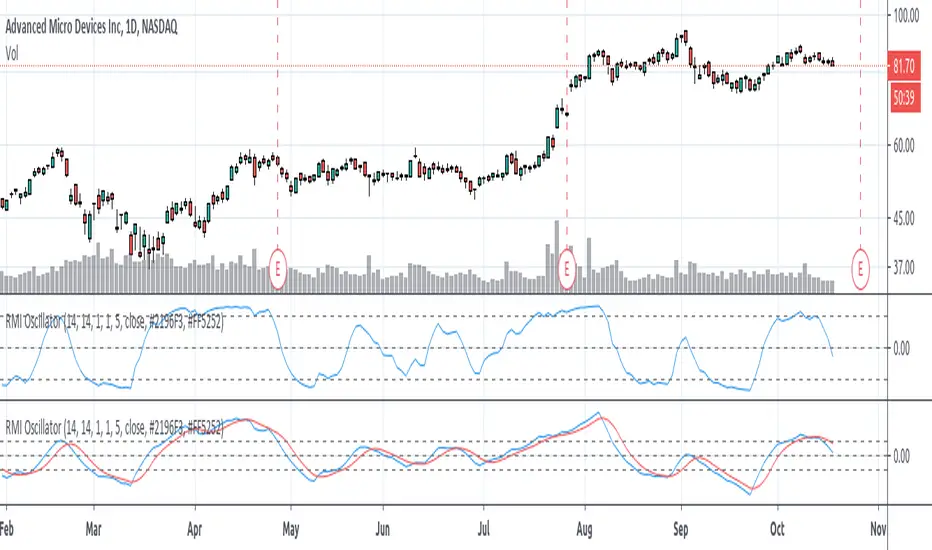
Relative Momentum Index (RMI) OscillatorThe Relative Momentum Index (RMI) is a sibling to the RSI. Where the RSI measures trend based on the average (RMA) of gains and draws over a length of time , the RMI measures based on the SUM of gains and draws . Myself and many others have found that the RMI oscillates better than the RSI does.
I paired the RMI with the oscillation method the Fisher Transformation uses to oscillate the value from -1.0 to 1.0 instead of the Stochastic way of 0 to 100. This way you can enable the Fisher transform, if desired. But I also just prefer the appearance of that.
Some options and features I have coded in-
RMI Length: This is the length of the Relative Momentum Index itself. Like the length of RSI, default 14
Oscillation Length: This is your oscillation length, like a Stochastic. If you put the length at 1 it will turn the indicator into the straight up RMI indicator. (If you select to use the Fisher Transform, the overbought/oversold lines will not show nicely)
Source Pre-Smoothing: The option of smoothing out the source, ie close, before you even run it through the RMI, oscillation, and/or transform
Oscillator Post-Smoothing: The option of smoothing the output of the script
Trailing MA: If desired, you can check the box to Use a Trailing Signal, and enter the length of lookback for a Simple Moving Average (SMA) of the RMI Osc value
Use Fill Colors on MA: If enabled, it will fill the area between the RMI Osc and the trailing MA. I chose to use colors that are similar to some educational ideas I have published, whereby nearing the bottom of the oscillation you get Green to signal Accumulation, and near the top you get Red to signal Distribution. Following red is Black, where you typically get late signal sellers that Capitulate and sell stops trigger. Blue is where traders tend to Chase price up.
The most primitive way of using this indicator would be sell when the value exceeds the overbought/top line and buy when it falls below the oversold/bottom line. You can find ways to use the fill colors, or MA crossovers, rising lows or rising highs, etc. for signals.
Here's a comparison of this indicator to the Stochastic RSI, using similar values-
Here's showing the indicator on intraday values at defaults with some pre- and post-smoothing-
Same thing, but with Fisher Transform enabled-
And an example of the fill bands in action-
Please feel free to use any part of this code as desired.
Stochastics and RSI HybridThis is an interesting study. We know bollinger bands can be a useful tool for price action, but what if we applied them to other indicators?
The top chart is the Stochastics and bottom chart represents RSI. We can see a relationship between the two indicators, where the signal line bounces of the bollinger bands.
The strategy is simple, when the signal lines bounce of their bollinger bands together, review price action and then take the trade. If you see one indicator going in the opposite direction to the other, or opposite to price action, then you may be observing divergence in which case a big move is about to happen.
If you wish to have this indicator further customised, please do not hesitate to contact me.

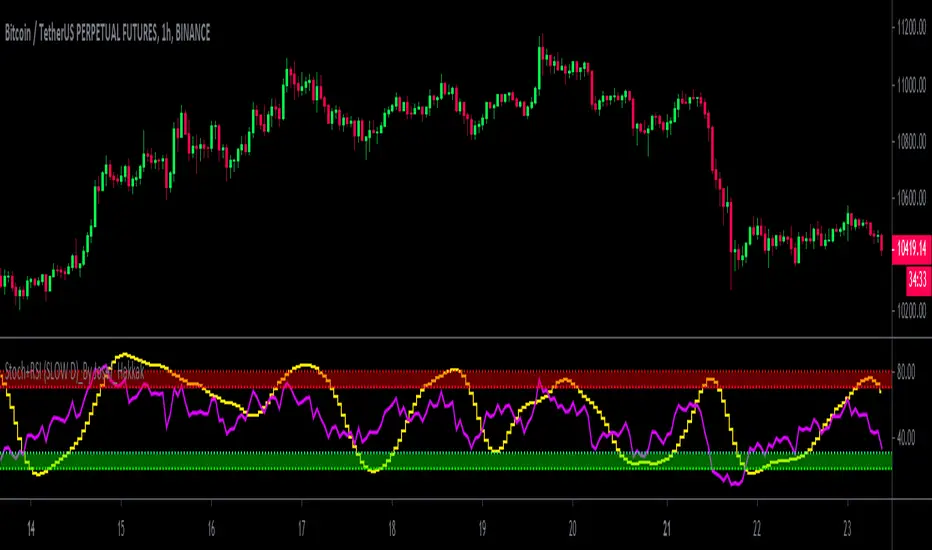
Stoch+RSI (SLOW D)_By Josef_HakkakStoch+RSI (SLOW D)_By Josef_Hakkak
Stochastic and RSI by SLOW D%
-> How to use:
B UY = When the yellow line (D of Slow Stoch ) goes out of the green range, it is better that the purple line ( RSI ) is be low
SELL = When the yellow line (D of Slow Stoch ) goes out of the red range, it is better to have the purple line ( RSI ) is be high
This script was previously written by RRanjanFX and has now been edited by me and changes have been made to optimize for shorter timeframes.
Edited and updated and optimized from:
RRanjanFX
Many thanks and loyal to RRanjanFX
MTF Stoch RSI ScreenerDisplays when multiple timeframes of Stochastic RSI are overbought/oversold. Multiple consecutive timeframes being overbought/oversold can signify a short term top or bottom.
Thanks to Micse in Pinescripters telegram who helped remove a few errors from this.

GnG - WaveTrend with RSIShow WaveTrend Line and Stochastic RSI line Indicator in one script
When Stochastic RSI Line cross will show signal.
Helping users to know the signal of reversal.
Disclaimer On and Take your Own Risk.

RSI2 with alerts by Mr.TuanDoan for Binary OptionIdea was developed from Larry Connors RSI2.
The 2-period RSI strategy is a fairly simple mean-reversion trading strategy designed to buy or sell securities after a corrective period.
You should look for buying opportunities when 2-period RSI moves below Lower Band (5), which is considered deeply oversold. Conversely, you can look for short-selling opportunities when 2-period RSI moves above Upper Band (95).
This is a rather aggressive short-term strategy for Binary Option.
Best use with Stoch RSI x 2.
The settings for Stoch RSI are
- Slow: 3 3 14 14
- Fast: 3 3 5 5
Only consider a PUT/CALL when both Stoch RSI are in the same state (overbought/oversold).
When arrow appears on the candle, it likely reverse the current trend.
Note
This is not a holy-grail.
Please follow your risk management
Confirmations must be met before entering a trade
It's for Binary Option

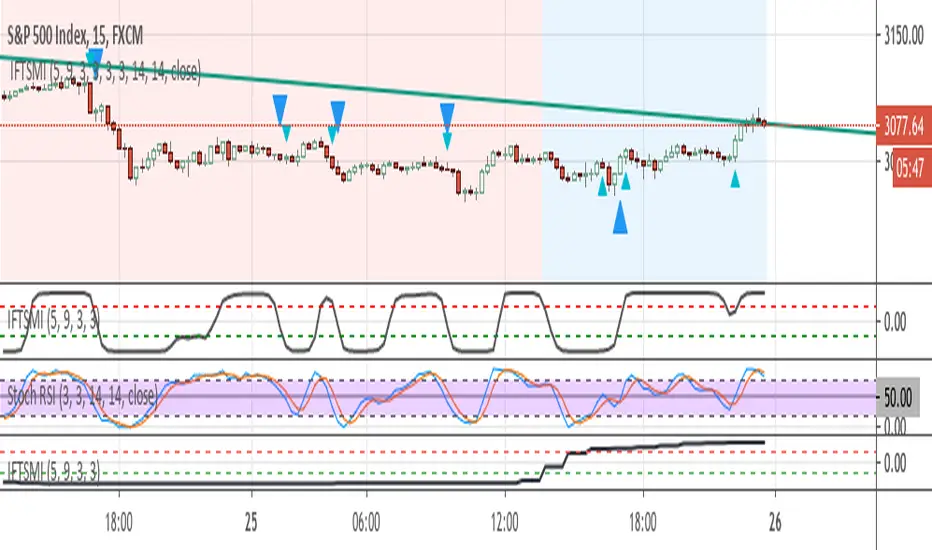
Inverse Fisher Transform of SMI and sto. RSI, MTF confirmedThe system uses 1 hour and 15 min timeframe data. Signals coming from 15 min Inverse Fisher Transform of SMI and stochastic RSI are confirmed by 1 hour Inverse Fisher Transform SMI, according to the following rules:
long cond.: 15 min IFTSMI crosses ABOVE -0.5 or SRSI k-line crosses ABOVE 50 while 1-hour IFTSMI is already ABOVE -0.5
short cond.:15 min IFTSMI crosses BELOW 0.5 or SRSI k-line crosses BELOW 50 while 1-hour IFTSMI is already BELOW 0.5
SMI and Inverse Fisher Transform of SMI codes belong to @kivancozbilgic.
Sto RSI and kijun-sen line to determine and follow the trend This script uses 25-75 treshold of stochastic RSI with the help of kijun-sen as confirmation, to find entry points to any trend either newly developed or an established one. I just realized it on the 1 hour SPX chart. Sure it can be used on other symbols. Crossing above/below 25/75 line of sto RSI is considered as buy/sell signal. Signals are evaluated whether price be above/below kijun-sen line. If a sell signal below kijun-sen is generated it is a continuation signal for downtrend, otherwise it is a countertrend signal (maybe a signal for a new downtrend). A countertrend signal must be evaluated carefully and only accepted in the right side of kijun-sen. e.g entering a sell signal generated above kijun-sen should be accepted only below the kijun-sen, vice-versa.

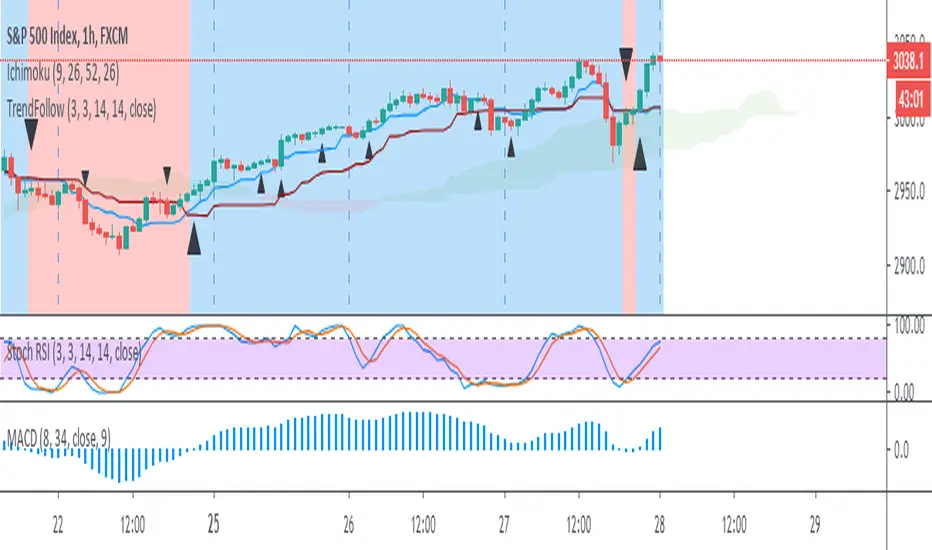
Trend Follow with kijun-sen/tenkan sen for 1 Hour SPX
This script determines, plots and alerts on probable trend initiation and continuation points, using tenkan-sen(conversion line of ichimoku), kijun-sen(baseline of ichimoku) and stochastic RSI, for 1 H SPX.
New long/short trend initiates when prices cross above/below kijun sen. The trend continues when prices cross above/below tenkan-sen or stochastic RSI crosses up/down its signal line, while prices are above/below kijun-sen.
It is good to take partial profit between 10-15 points gain and trail the left with stops below kijun-sen line.
While placing the order, using 2-3 points buffer above/below of signal bars is recommended. Additionally, please be careful about clouds and do not place long/short orders below/above clouds.

Trend Follow with 8/34 EMA and Stoch RSI for 1 Hour SPX
The script determines and plots entry points for 1 hour S&P index using 8/34 emas and stochastic RSI. When 8 ema above/below 34 ema up/down crosses of stochastic RSI are considered as long/short entries. Entry prices should be above/below high/low of the signal bars accordingly. Ichimoku cloud can be used as extra filtering.
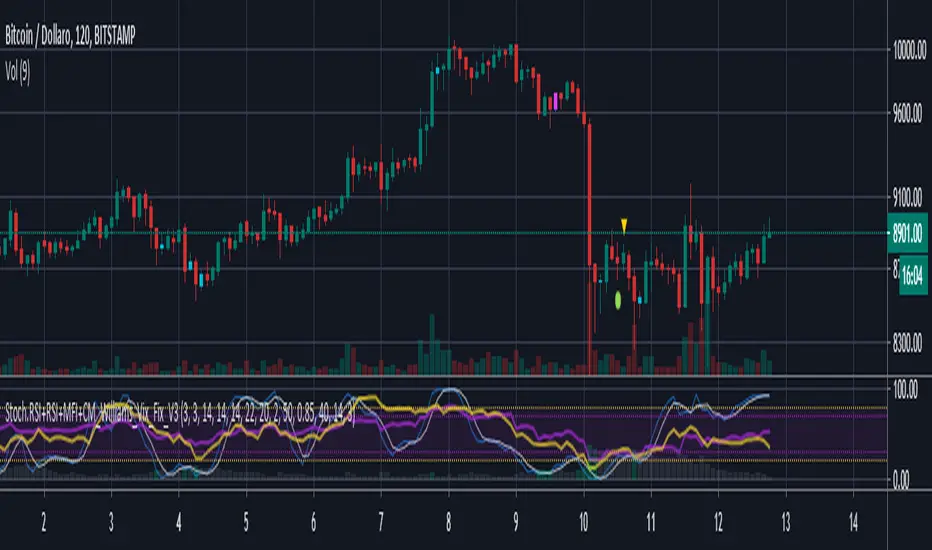
Stoch.RSI+RSI+MFI+CM_Williams_Vix_Fix_V3An update of my previous code "Stoch.RSI+RSI+DoubleStrategy+CMWilliamsVixFix+MFI".
Updates:
- Script converted to v4 and to study version
- Removed the "Double strategy" code because it doesn't work much well
- Replaced the "CM_Williams_Vix_Fix" (by ChrisMoody) code with its updated version "CM_Williams_Vix_Fix_V3" that also features custom filtered alerts directly onto candlesticks (don't forget to check its author's profile)
- Other minor graphical adjustments
Stochastic RSI with Overbought OverSold Crosses coloredColored Stoch Rsi .
It is possible to show Oberbought and Oversold Crosses only or all Crosses via Checkbox .
It is a script for Beginner. Stochastic RSI is more readable.
Have Fun

RSI & StochasticA combination of RSI and Stochastic using default settings.
- RSI or Relative Strength Index is the white line.
- Stochastic %K is the aqua line
- Stochastic %D is the orange line
- The purple rectangle is the RSI range going from 30 (oversold) at the bottom to 70 (overbought)
- The top dotted line indicates the price being overbought on the stochastic
- The bottom dotted line indicates the price oversold on the stochastic
I mainly use both indicators to spot divergence/ potential upcoming turning points (tops or bottoms).
For example on the chart the white line shows the price of Bitcoin Rising
While the yellow line shows the stochastic declining and the red RSI stayed more or less at the same level.
Another way to use this indicator is to use the aqua line crossing above the orange line as an entry for a long trade this strategy is most useful when both are near the bottom of the range. The opposite is true for short trades but
both should be combined with other indicators such as moving averages support levels or volume for best results.
Generally RSI is more useful in trending markets & the stochastic is more useful in sideways or choppy markets.

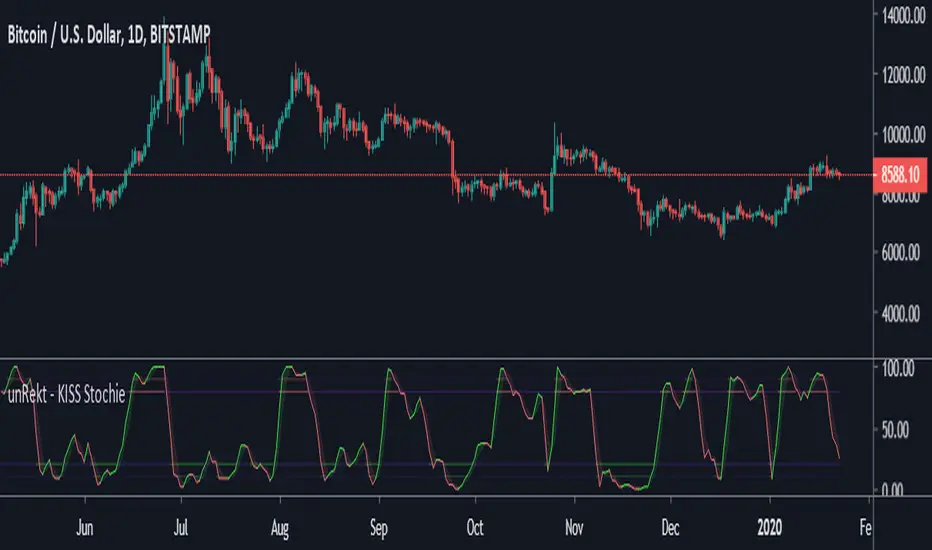
unRekt - KISS StochieStochie is the StochRSI indicator and is part of the ''keeping it simple' series that have a similar color scheme. The Stochastic RSI technical indicator applies the Stochastic Oscillator to values of the Relative Strength Index (RSI). The indicator thus produces two main plots FullK and FullD oscillating between oversold and overbought levels. The StochRSI can also be used to detect divergence and trend.
Scoring Development Sample [BigBitsIO]This script shows a sample of how to do confidence weighted scoring indicators and for loops with Pine. This indicator may or may not be found useful, it's intent is to provide a sample on how to create such an indicator and use certain Pine features.
Features:
- Defined points based on the confidence of RSI and Stochastic indicator
- Defined points based on candle color and sma trend direction
- For loops used to calculate bonus points for "extended periods" of confidence.
*** DISCLAIMER: For educational and entertainment purposes only. Nothing in this content should be interpreted as financial advice or a recommendation to buy or sell any sort of security or investment including all types of crypto. DYOR, TYOB. ***

[fikira] MACD & RSI+Stoch + DivergencesThis is a new version of my "Divergences"
Compared to my "Divergences (Pivots)", this is calculated totally different
There are 3 options:
- MACD
- RSI
- Stoch RSI
Since this script is very heavy in calculation it is limited in time (= inspired from a script of "Che_Trader")
Also it uses "max_bars_back" (=1000)
For MACD and Stoch RSI there is a "custom Divergences Period", which compares more then 7 Pivot Points,
the higher the number, the less reliable, it is not necessary to use this, but it is there,
also you can change the "leftbars" and "rightbars", again, it is not necessary to change, but you can...
Linewidth and style of the Divergences lines can be changed
Thank you!

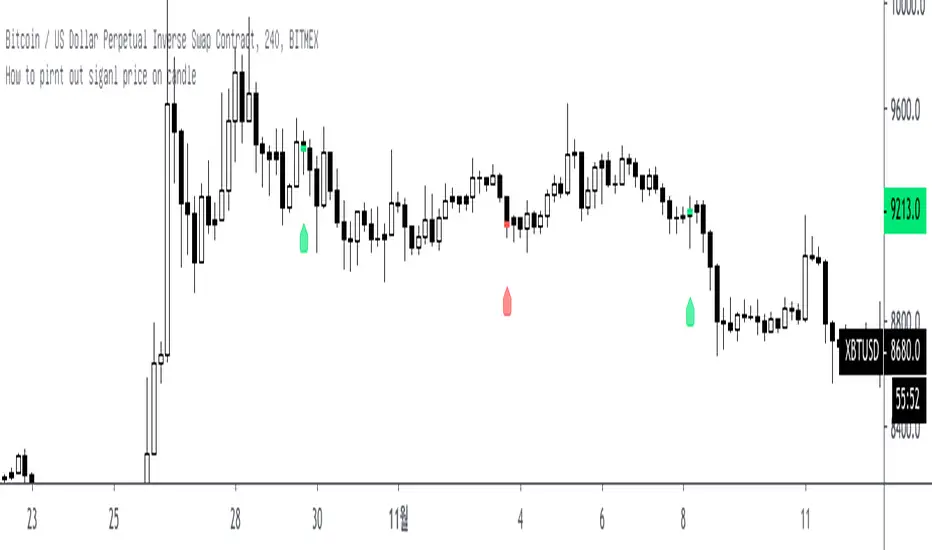
How to pirnt out siganl price on candleHi, this is Yong from Mby_lab
this codes explain how print out signal price on candles.
only working on 4H timeframe.
Core code based on 3H timeframe so This time close show on 4H, realtime close.
if 3H close fixed, then it will show on 4H line break style and this is not show twice on candle cause like this
When 3H closed / 4H = realtime
4H closed / 3H = realtime
then like this
3am close show 4am candle
6am close show next 4H candle for 8am~
..
.....
enjoy this!
this codes can help solve timeframe / security issues.
//
Open Interest Stochastic Money Flow IndexThis is the improved version of Stochastic Money Flow Index script that uses Open Interest instead of volume in Future markets.
I think it will make a difference especially in Future and CFD markets.
Since the system will pull data from Quandl, CFTC reports may cause repaint when disclosed.
So if you use it during the weekly time frame (1W), it will definitely not repaint.
You can also use the volume by selecting "Others" from the menu.This option applies to each instrument, you can use it on any financial instrument with or without COT data.
Bitcoin is included in the "Futures" option.
In Futures, you can observe the difference of Open Interest's success by comparing, since it counts exchanges between the two parties singularly, it reacts more firmly to speculative movements.
This script also includes alerts and bar color options, you can use from the menu.
It is also suitable for mutable variables.This script was freed from the integer loads.You can modify it in any adaptive or fractional period.
I hope it will help your analyzes, regards .
