Cari skrip untuk "screener"
Tillson T3 Moving Average - ScreenerScreener version of Tillson T3 Moving Average:
The T3 Moving Average generally produces entry signals similar to other moving averages and, thus, is mainly traded in the same manner. Here are several assumptions:
Suppose the price action is above the T3 Moving Average, and the indicator is upward. In that case, we have a bullish trend and should only enter long trades (advisable for novice/intermediate traders). If the price is below the T3 Moving Average and edging lower, we have a bearish trend and should limit entries to short.
About Screener Panel:
Users can explore 20 different and user-defined tickers, which can be changed from the SETTINGS (shares, crypto, commodities...) on this screener version.
The screener panel shows up right after the bars on the right side of the chart.
Tickers seen in green are the ones that are in an uptrend, according to T3.
The ones that appear in red are those in the SELL signal, in a downtrend.
The numbers in front of each Ticker indicate how many bars passed after the last BUY or SELL signal of T3.
For example, according to the indicator, when BTCUSDT appears (3) in GREEN, Bitcoin switched to a BUY signal 3 bars ago.
-In this screener version of Tillson T3 Moving Average, users can define the number of demanded tickers (symbols) from 1 to 20 by checking the relevant boxes on the settings tab.
-All selected tickers can be screened in different timeframes.
-Also, different timeframes of the same Ticker can be screened.
IMPORTANT NOTICE:
Screener shows the results in 2 different logic:
-Screener shows the information about the color changes of the T3 Moving Average with default settings.
-Users can check the "Change Screener to show T3 & Price Flips" button to activate the screener giving information about price flips.
If this option is preferred, users are advised to enlarge the length to have better signals.
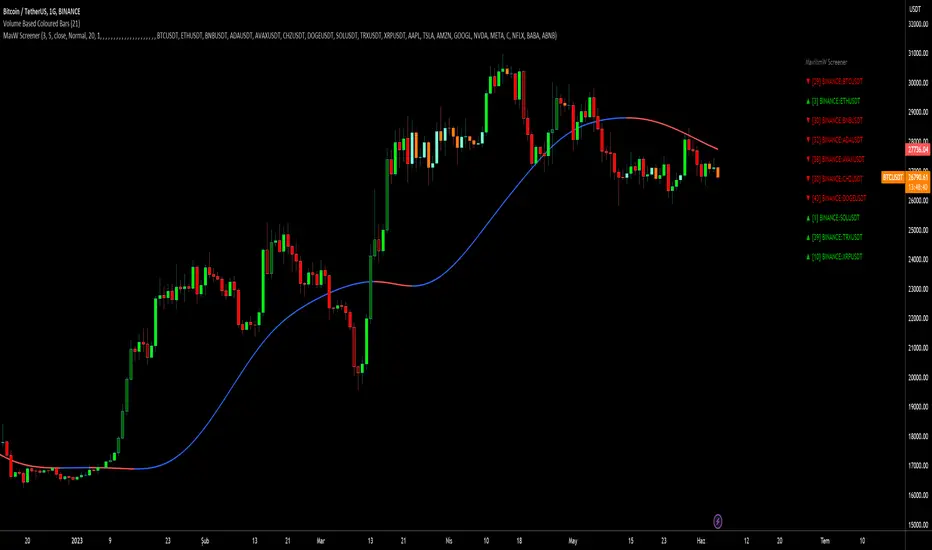
MavilimW ScreenerScreener version of MavilimW Moving Average :
Short-Term Examples (by decreasing 3 and 5 default values to have trading signals from color changes)
BUY when MavilimW turns blue from red.
SELL when MavW turns red from blue.
Long-Term Examples (with Default values 3 and 5)
BUY when the price crosses over the MavilimW line
SELL when the price crosses below the MavW line
MavilimW can also define significant SUPPORT and RESISTANCE levels in every period with its default values 3 and 5.
Screener Panel:
You can explore 20 different and user-defined tickers, which can be changed from the SETTINGS (shares, crypto, commodities...) on this screener version.
The screener panel shows up right after the bars on the right side of the chart.
Tickers seen in green are the ones that are in an uptrend, according to MavilimW.
The ones that appear in red are those in the SELL signal, in a downtrend.
The numbers in front of each Ticker indicate how many bars passed after the last BUY or SELL signal of MavW.
For example, according to the indicator, when BTCUSDT appears (3) in GREEN, Bitcoin switched to a BUY signal 3 bars ago.
-In this screener version of MavilimW, users can define the number of demanded tickers (symbols) from 1 to 20 by checking the relevant boxes on the settings tab.
-All selected tickers can be screened in different timeframes.
-Also, different timeframes of the same Ticker can be screened.
IMPORTANT NOTICE:
-Screener shows the information about the color changes of MavilimW Moving Average with default settings (as explained in the Short-Term Example section).
-Users can check the "Change Screener to show MavilimW & Price Flips" button to activate the screener as explained in the Short-Term Example section. Then the screener will give information about price flips.
AlphaTrend - ScreenerScreener version of AlphaTrend indicator:
BUY / LONG when AlphaTrend line crosses above its 2 bars offsetted line, and there would be a green filling between them
SELL / SHORT when AlphaTrend line crosses below its 2 bars offsetted line, and filling would be red then.
Default values:
Coefficient: 1, which is the factor of the trailing ATR value
Common Period: 14, which is the length of ATR MFI and RSI
AlphaTrend default uses MFI in the calculation, and MFI (Money Flow Index) needs the volume data of the chart.
If your chart doesn't have the volume data, please select the "Change Calculation" option to use RSI instead of MFI.
Screener Panel:
You can explore 20 different and user-defined tickers, which can be changed from the SETTINGS (shares, crypto, commodities...) on this screener version.
The screener panel shows up right after the bars on the right side of the chart.
Tickers seen in green are the ones that are in an uptrend, according to AlphaTrend.
The ones that appear in red are those in the SELL signal, in a downtrend.
The numbers in front of each Ticker indicate how many bars passed after the last BUY or SELL signal of AlphaTrend.
For example, according to the indicator, when BTCUSDT appears in (3) and in GREEN, Bitcoin switched to BUY signal 3 bars ago.
Screener - Multi Timeframe [WYCKOFF ARSENAL]Screener - Multi Timeframe WYCKOFF ARSENAL
The general idea of The Wyckoff Method is that the trader can see the market as well-structured periods of Accumulation , Markup , Distribution and Markdown .
The price of an asset depends on its supply and demand .
There is more than one stock available for trading, and there is more than just Bitcoin on the Cryptocurrency market.
This means that one may choose to trade more than one asset and this perspective opens up a world of opportunities in which Supply and Demand are the masters.
For example, you have invested some money in a cryptocurrency, and you wait for it to Markup already.
But it is still in a long period of accumulation - it doesn't move much.
You should leave it and find another crypto that is moving.
To aid in the discovery of such opportunities, a Market Screener is available.
Method used: The Wyckoff Method of course.
The indicators used:
• Optimism Pessimism
• Force
• Technometer
• Momentum
The Wyckoff Arsenal Indicators can be used individually, and they are very useful when trading a single pair.
But the Market Screener can scan for opportunities in a wide range of pairs, or same asset but different trading platforms.
The indicators are based on volume, so the symbols must have volume data for the Screener to work.
Multiple indicator instances can be used to track a specific asset, like Bitcoin.
This way, all Bitcoin data available on TradingView could be used instead of data coming from a single trading platform.
Alerts: Overbought/Oversold conditions, Bollinger Bands crossings, Divergence detection.
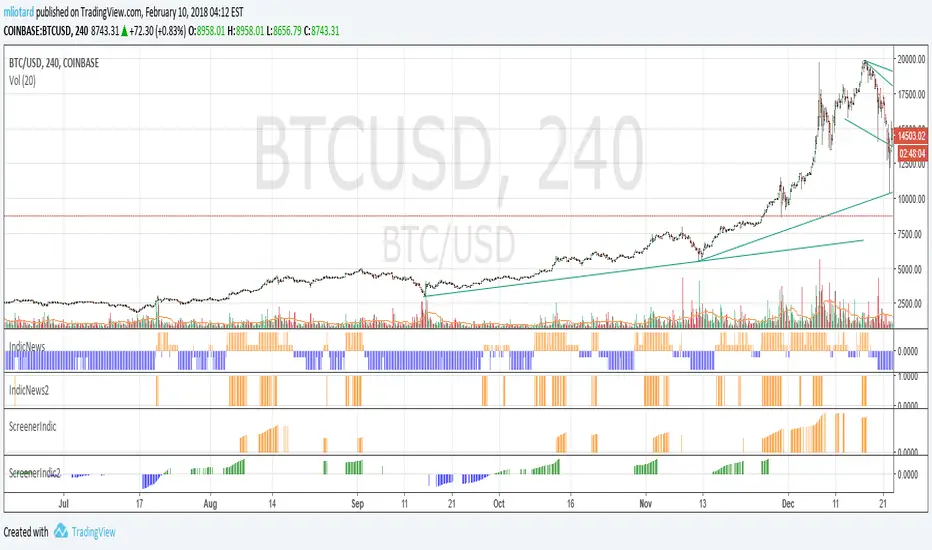
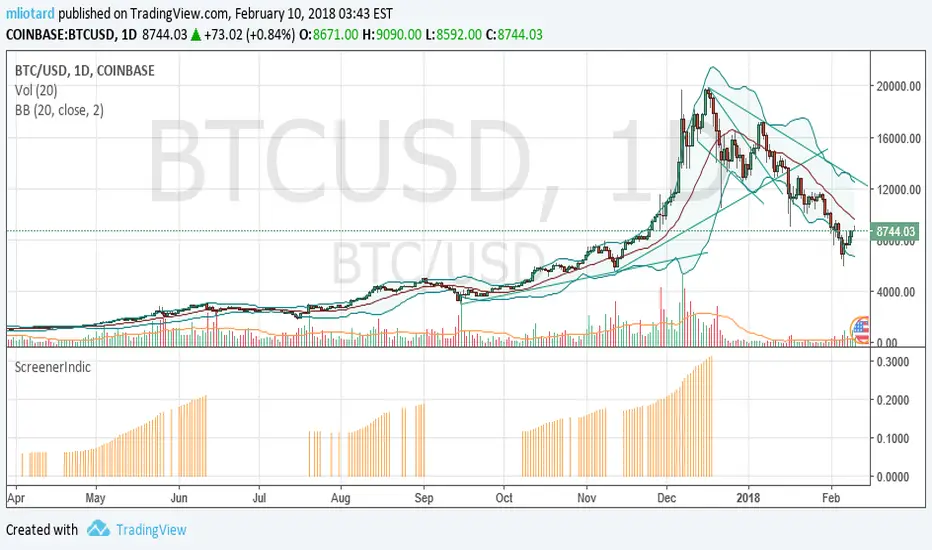
ScreenerIndic [mliotard]This is an histogram.
Orange bar : the security is in the first part of ScreenerTA.
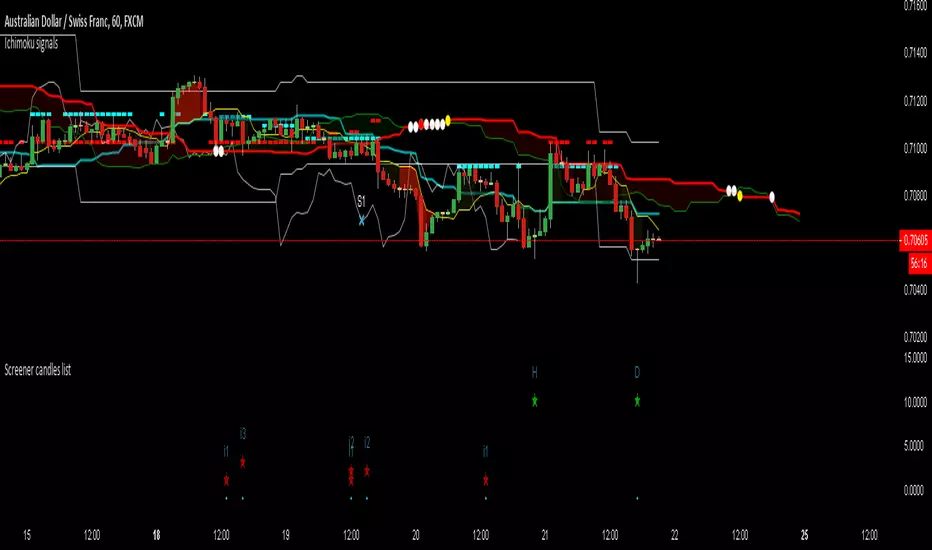
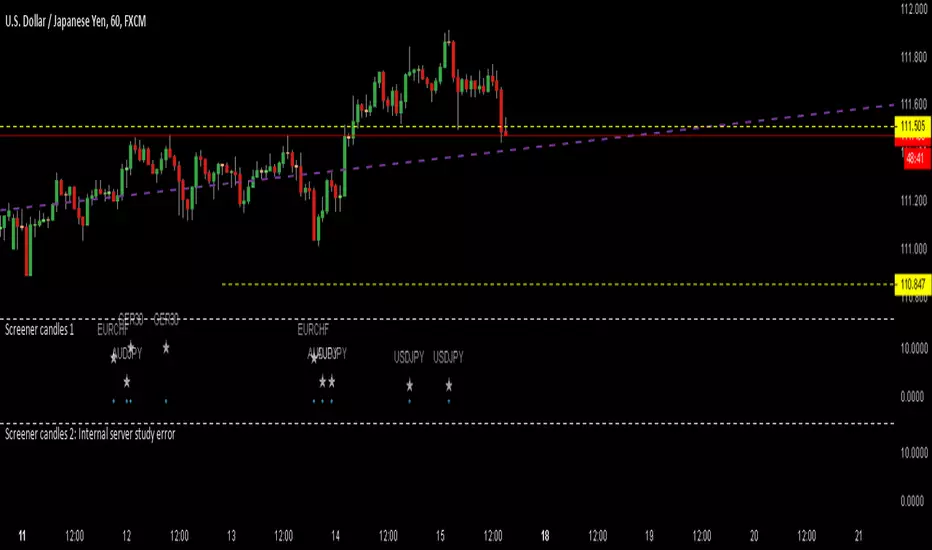
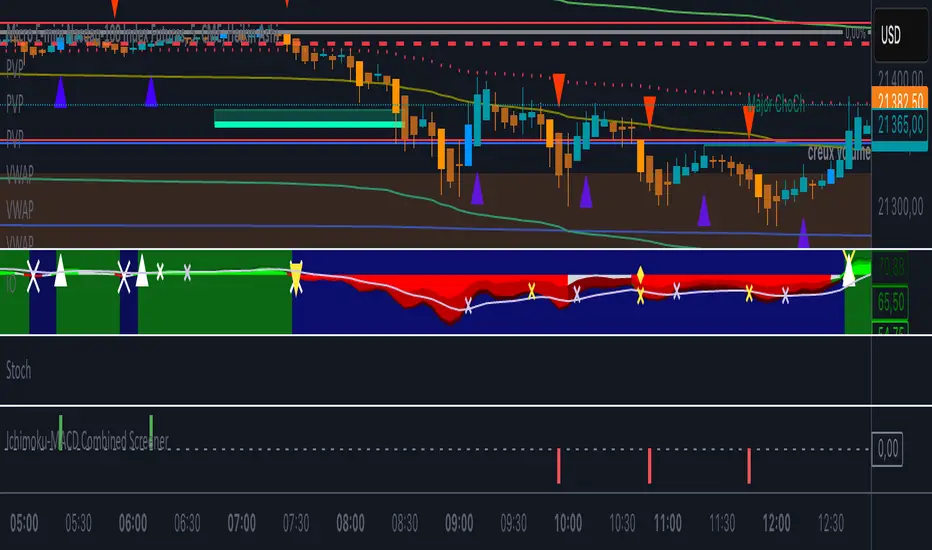
Ichimoku-MACD Combined ScreenerScreener Combiné Ichimoku-MACD : Détection de signaux de retournement confirmés
Cet indicateur combine la puissance de l'Ichimoku Oscillator et du MACD/MM pour identifier des opportunités de trading de haute probabilité.
FONCTIONNEMENT :
- Détecte les signaux MACDUP (achat) uniquement lorsque la tendance Ichimoku est haussière
- Détecte les signaux MACDDOWN (vente) uniquement lorsque la tendance Ichimoku est baissière
- Filtre les faux signaux en exigeant une confirmation de tendance
SIGNAUX :
- Signal d'achat (barre verte) : MACDUP se produit pendant une tendance Ichimoku positive
- Signal de vente (barre rouge) : MACDDOWN se produit pendant une tendance Ichimoku négative
- Les signaux récents sont suivis pendant une période configurable pour faciliter le filtrage
UTILISATION COMME SCREENER :
- Dans le filtre, recherchez les valeurs "Signal Achat" > 0 pour les opportunités d'achat
- Dans le filtre, recherchez les valeurs "Signal Vente" > 0 pour les opportunités de vente
- Idéal pour détecter les retournements de tendance ou les reprises de tendance après consolidation
PARAMÈTRES AJUSTABLES :
- Configuration Ichimoku : personnalisez les périodes de calcul et la protection contre les faux signaux
- Configuration MACD/MM : ajustez les paramètres pour adapter la sensibilité
- Période de recherche : définissez combien de temps un signal reste actif pour le screener
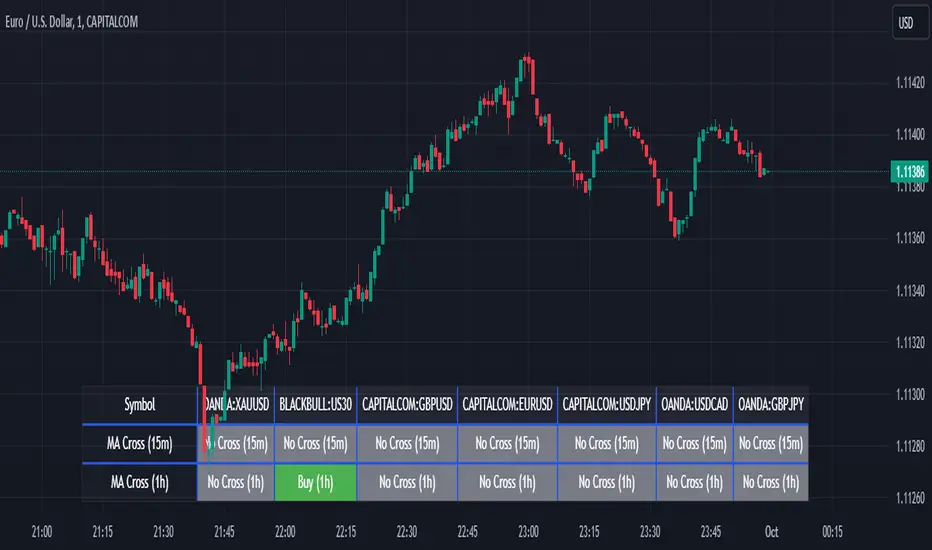
Screener MA CrossThe Screener MA Cross is an efficient tool designed to help traders quickly identify potential buy and sell signals across multiple currency pairs and timeframes. This script monitors the crossover behavior of two moving averages (MA8 and MA50) to determine possible entry points for trades.
Key Features:
Multi-Pair Monitoring: The indicator allows users to screen popular assets, including XAUUSD, US30, GBPUSD, EURUSD, USDJPY, USDCAD, and GBPJPY. You can add or remove symbols based on your preference.
Dual Timeframe Analysis: It tracks moving average crossovers on both 15-minute and 1-hour charts, giving users insights into short-term and medium-term trends without switching between timeframes.
Color-Coded Signals:
Green: Indicates a bullish "Buy" signal when the MA8 crosses above the MA50, suggesting upward momentum.
Red: Indicates a bearish "Sell" signal when the MA8 crosses below the MA50, signaling downward momentum.
Gray: Represents a neutral or no-cross state, indicating no clear trend.
Clean Table Format: Displays all relevant signals directly on your chart in a structured, easy-to-read table format, allowing you to quickly scan and assess trading opportunities.
How It Works: The script uses moving averages (MA8 and MA50) to analyze crossover patterns, a common method for identifying trend changes. A crossover occurs when a shorter moving average (MA8) crosses above or below a longer moving average (MA50). By requesting data from the 15-minute and 1-hour timeframes, the Screener MA Cross provides a clear overview of the market situation across various assets, helping you decide on potential trades.
This tool is particularly useful for trend-following strategies and can be used to spot momentum shifts on smaller timeframes, making it ideal for day traders and scalpers.
How to Use:
Add the indicator to your chart and customize the asset symbols to match your trading preferences.
Monitor the signals on the table. Green signals indicate potential buying opportunities, while red signals suggest possible selling points.
Use alongside other analysis: While the Screener MA Cross offers valuable insights, it's best used in combination with other indicators and analysis techniques to confirm trade setups.
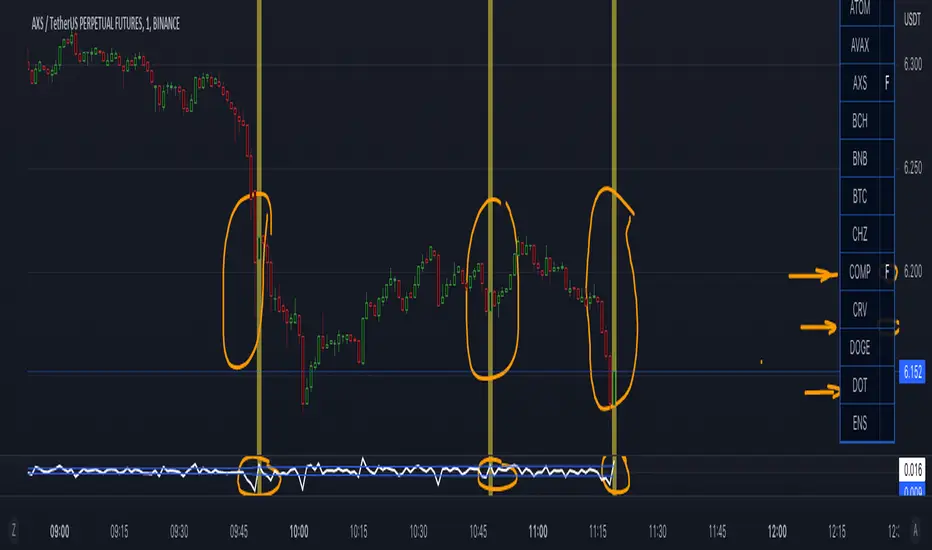
Screener _-_ FVVO by SavosRUIt is my first attempt to make SCREENER
Screener by 20 coins to detect Filter of Volatility Oscilator & Volume Threshold
Now - without ALERTS!
But it will be added ASAP...
==================
Это первая моя попытка сделать СКРИНЕР.
Проверяет наличие сигнала всплеска волатильности и объема на 20 монетах.
Монеты - настраиваются.
Алерты - пока отсутствуют, но планируются в будущем.
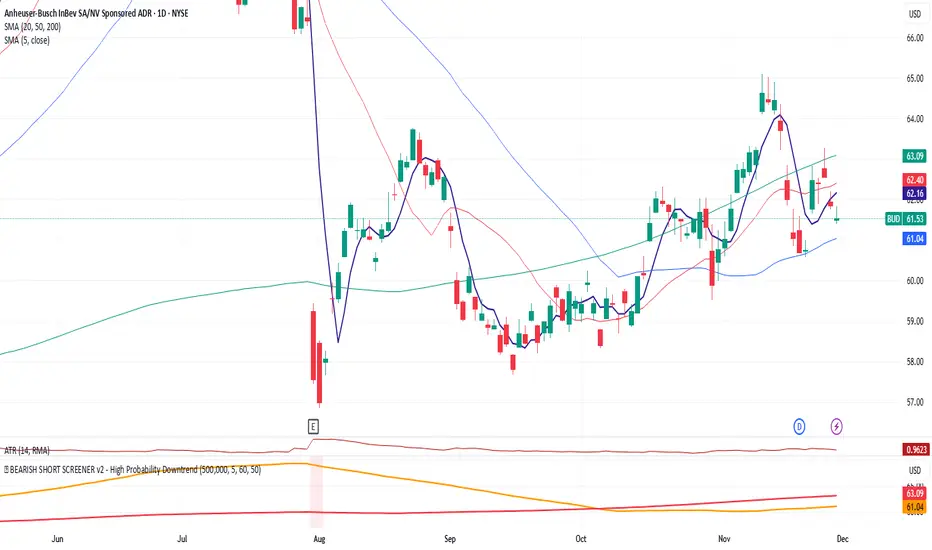
[SCREENER] TAD SYSTEM (Shariah MYX)TAD SYSTEM
TAD stands for TURTLE, ATOM and DUCK
With the three BUY arrows aligned accordingly with the TURTLE, ATOM and DUCK indicators, this triggers BUY signal
With the three SELL arrows aligned accordingly with the TURTLE, ATOM and DUCK indicators, this triggers SELL signal
F1 TURTLE
F1 ATOM
F1 DUCK
Screener Outside BarsBased on the teachings of Rob Smith
1= Inside Candle
2= Goes past the previous candle's price up or down
3= Goes past the previous candle's price on both sides
Outside Bar (3) is a bar that has broken the price of both sides of the previous bar.
Ability to change the timeframe and the symbols this indicator is scanning through in the input tab under settings of this indicator. Maximum symbols 40.
Looking for outside bars within 40 symbols. By default some symbols are entered in the indicator already. They cannot be left empty. If left empty, the script might not work properly.
By changing the timeframe, outside bars can be looked under many timeframes like Monthly, Weekly, Dialy, Intraday, etc.
First label is for all of the symbols the indicator is scanning.
Second label is the result of the scan. Text is bigger than in this label than the first label to differentiate from the first label and for ease of use.
Please DM me on how to access this indicator.
Screener Potential 312 / 212 / 122Based on the teachings of Rob Smith
1= Inside Candle
2= Goes past the previous candle's price up or down
3= Goes past the previous candle's price on both sides
Ability to change the timeframe and the symbols this indicator is scanning through in the input tab under settings of this indicator. Maximum symbols 40.
Looking for short or long setups within 40 symbols. By default some symbols are entered in the indicator already. They cannot be left empty. If left empty, an error comes up and the script doesn't load.
The reversal setups this indicator is looking for
212
312
122
Can look through many timeframes like monthly, weekly, daily, intraday by changing the timeframe in the input tab under settings.
Default timeframe is set to 1 Day.
First label is for all of the symbols the indicator is scanning.
Second label is the result of the scan. Text is bigger than in this label than the first label to differentiate from the first label and for ease of use.
Please DM me on how to access this indicator.
Screener Inside BarsBased on the teachings of Rob Smith
1= Inside Candle
2= Goes past the previous candle's price up or down
3= Goes past the previous candle's price on both sides
Ability to change the timeframe and the symbols this indicator is scanning through in the input tab under settings of this indicator. Maximum symbols 40.
Looking for inside bars within 40 symbols. By default some symbols are entered in the indicator already. They cannot be left empty. If left empty, an error comes up and the script doesn't load.
By changing the timeframe, inside bars can be looked under many timeframes like Monthly, Weekly, Dialy, Intraday, etc.
First label is for all of the symbols the indicator is scanning.
Second label is the result of the scan. Text is bigger than in this label than the first label to differentiate from the first label and for ease of use.
Please DM me on how to access this indicator.
Auto Harmonic Screener - UltimateX [Trendoscope®]🎲 Introduction to Auto Harmonic Screener UltimateX
The Auto Harmonic Screener UltimateX is a sophisticated TradingView indicator designed to automatically detect and screen for a wide range of harmonic patterns across multiple zigzag levels. It builds on the foundation of harmonic trading principles, using recursive zigzag analysis to identify potential reversal zones based on Fibonacci ratios. This indicator complements the Auto Harmonic Pattern UltimateX by focusing on screening functionality rather than isolated pattern detection. This is script is designed and optimized to be used with Pine Screener
The indicator produces harmonic patterns on the chart. As an indicator, it does not offer more than what Auto Harmonic Pattern UltimateX offers. However, the major difference is that Auto Harmonic Pattern UltimateX concentrates on the usage as indicator and providing stats and back test data based on historical patterns whereas this script is optimized to be used with Pine Screener to screen across 100s of symbols at once to find out potential patterns across the market.
🎲 Core Mechanics: How the Indicator Works
🎯 Zigzag Pivot Detection
The indicator starts by calculating zigzag pivots. Zigzag identifies swing highs and lows by filtering price movements based on a minimum length (default: 8 bars) and depth (default: 100 pivots).
You can opt to use close prices instead of high/low for zigzag calculation (via Use Close Prices ), which smooths out noise in volatile markets but may miss extreme swings.
Zigzag is recursive: It begins with a base level (level 0) and generates higher levels by combining pivots from lower levels. This allows scanning for patterns at various scales, from short-term to long-term structures.
New pivots trigger pattern scans only when confirmed
🎯 Harmonic Pattern Scanning
Patterns are scanned using the last 5 zigzag pivots: X (oldest), A, B, C, D (newest)
The scan compares price ratios (e.g., AB/XA, BC/AB, CD/BC, XD/XA) against predefined Fibonacci-based ranges for each pattern type, with an adjustable error threshold (default: 8%).
Log scale scanning (Scanning under Log Scale ) can be enabled for assets with exponential growth (e.g., cryptocurrencies), ensuring ratios are calculated proportionally.
Strict mode ( Strict Ratio Scanning Mode ) disables error additions when ratio ranges vary, prioritizing accuracy over quantity of detections.
Detected patterns are stored in an array and checked for duplicates (based on pivot indices) to avoid redundancy.
The Potential Reversal Zone (PRZ) is calculated as a range where the D point should land for pattern completion.
🎯 Pattern Categories and Types
Classic Patterns : Standard harmonic formations like Gartley, Bat, Butterfly, Crab, Deep Crab, Cypher, Shark, Nenstar,
Anti/Alternate Patterns : Variations with inverted or extended ratios, such as Anti Gartley, Anti Bat, Anti Butterfly, Anti Crab, Anti Cypher, Anti Shark, Anti Nenstar, Navarro.
Non-Standard Patterns : Less common structures like 5-0, Three Drives, or Black Swan, White Swan, 121, Sea Pony, Leonardo, Total.
You can enable/disable categories or individual patterns via inputs. The indicator uses a map to track active patterns and scans only those selected
🎯 Trade Monitoring and Confirmation
Patterns identified are monitored for entry, failure and success. Patterns are kept on the chart until they are either invalidated, stopped or reaches the target. The status of the pattern is also used during the filtering of patterns using Pine Screener
🎯 Output and Signals
The following plots are displayed in data window mode. These plots are used in Pine Screener for filtering symbols based on the presence of patterns.
Bullish (Awaiting Entry) : Plots 1 if there is a bullish pattern awaiting entry
Bullish (In Trade) : Plots 1 if there is a bullish pattern that has reached Entry and in trade.
Bearish (Awaiting Entry) : Plots 1 if there is a bearish pattern awaiting entry
Bearish (In Trade) : Plots 1 if there is a bearish pattern that has reached Entry and in trade.
🎲 Detailed Input Parameters
The indicator offers extensive customization through grouped inputs. Here's a breakdown:
🎯 Zigzag Parameters :
Use Close Prices (bool, default: false): Switches zigzag to use close prices for pivots, reducing sensitivity to wicks.
Length (int, default: 8, min: 3): Minimum bars between pivots; higher values filter more noise but may miss small patterns.
Depth (int, default: 100, max: 500): Maximum pivots stored; affects recursive zigzag levels and performance.
🎯 Generic Settings
Base (string, default: 'correction'): Determines the wave (impulse/correction) used for target projections. Options include 'min'/'max' for conservative/aggressive targets, or 'AD'/'CD' for specific legs.
Error Percent (int, default: 8, 0-20): Tolerance for ratio matches; lower = fewer but more accurate patterns.
Strict Ratio Scanning Mode (bool, default: false): Enforces exact ratios without error buffer for varying ranges.
Log Scale (two bools): Separate toggles for scanning patterns vs. projecting targets.
🎯 Trade Settings
Stop/Entry/Target (floats): Ratios for trade levels (stop=0.0 default, entry=0.3, target=0.618). Stop at 0.0 means no stop (use with caution); entry/target based on PRZ extension.
🎯 Display Settings
Draw (bool, default: true): Enables pattern drawings. When running in pine screener, this can be turned off
Theme (enum, default: DARK): Auto-generates colors (light/dark shades); or CUSTOM with 22 user-defined colors.
XABCD/Ratios (bools, default: true): Show/hide pivot labels and ratio annotations.
Label Size (string, default: small): Size for on-chart labels (tiny to huge).
🎲 Using with Pine Screener
Pine Screener is a powerful tradingview utility that allows users to build complex programmable screeners using Pinescript®. This script is designed in an optimized way in order to work with Pine Screener. Hence, the display of the indicator is limited. In order to use this script with pine screener, we need to follow these steps.
Prepare your watchlist
Pine screener works on a watchlist with less than 1000 symbols in them. We can use built-in tradingview screeners to perform initial screening based on broad categories. This can be as simple as filtering based on market cap. This initial filtering is only required if the number of symbols are more than 1000.
Load the watchlist and indicator to pine screener
Go to screener menu and load Pine Screener.
Once done, load the watchlist and indicator. Set filtering criteria, timeframe and indicator settings. And then press Scan to filter the symbols that match given criteria.
For more details, please watch the video published under the below idea.
Divergence Screener [Trendoscope®]🎲Overview
The Divergence Screener is a powerful TradingView indicator designed to detect and visualize bullish and bearish divergences, including hidden divergences, between price action and a user-selected oscillator. Built with flexibility in mind, it allows traders to customize the oscillator type, trend detection method, and other parameters to suit various trading strategies. The indicator is non-overlay, displaying divergence signals directly on the oscillator plot, with visual cues such as lines and labels on the chart for easy identification.
This indicator is ideal for traders seeking to identify potential reversal or continuation signals based on price-oscillator divergences. It supports multiple oscillators, trend detection methods, and alert configurations, making it versatile for different markets and timeframes.
🎲Features
🎯Customizable Oscillator Selection
Built-in Oscillators : Choose from a variety of oscillators including RSI, CCI, CMO, COG, MFI, ROC, Stochastic, and WPR.
External Oscillator Support : Users can input an external oscillator source, allowing integration with custom or third-party indicators.
Configurable Length : Adjust the oscillator’s period (e.g., 14 for RSI) to fine-tune sensitivity.
🎯Divergence Detection
The screener identifies four types of divergences:
Bullish Divergence : Price forms a lower low, but the oscillator forms a higher low, signaling potential upward reversal.
Bearish Divergence : Price forms a higher high, but the oscillator forms a lower high, indicating potential downward reversal.
Bullish Hidden Divergence : Price forms a higher low, but the oscillator forms a lower low, suggesting trend continuation in an uptrend.
Bearish Hidden Divergence : Price forms a lower high, but the oscillator forms a higher high, suggesting trend continuation in a downtrend.
🎯Flexible Trend Detection
The indicator offers three methods to determine the trend context for divergence detection:
Zigzag : Uses zigzag pivots to identify trends based on higher highs (HH), higher lows (HL), lower highs (LH), and lower lows (LL).
MA Difference : Calculates the trend based on the difference in a moving average (e.g., SMA, EMA) between divergence pivots.
External Trend Signal : Allows users to input an external trend signal (positive for uptrend, negative for downtrend) for custom trend analysis.
🎯Zigzag-Based Pivot Analysis
Customizable Zigzag Length : Adjust the zigzag length (default: 13) to control the sensitivity of pivot detection.
Repaint Option : Choose whether divergence lines repaint based on the latest data or wait for confirmed pivots, balancing responsiveness and reliability.
🎯Visual and Alert Features
Divergence Visualization : Divergence lines are drawn between price pivots and oscillator pivots, color-coded for easy identification:
Bullish Divergence : Green
Bearish Divergence : Red
Bullish Hidden Divergence : Lime
Bearish Hidden Divergence : Orange
Labels and Tooltips : Labels (e.g., “D” for divergence, “H” for hidden) appear on price and oscillator pivots, with tooltips providing detailed information such as price/oscillator values, ratios, and pivot directions.
Alerts : Configurable alerts for each divergence type (bullish, bearish, bullish hidden, bearish hidden) trigger on bar close, ensuring timely notifications.
🎲 How It Works
🎯Oscillator Calculation
The indicator calculates the selected oscillator (or uses an external source) and plots it on the chart.
Oscillator values are stored in a map for reference during divergence calculations.
🎯Pivot Detection
A zigzag algorithm identifies pivots in the oscillator data, with configurable length and repainting options.
Price and oscillator pivots are compared to detect divergences based on their direction and ratio.
🎯Divergence Identification
The indicator compares price and oscillator pivot directions (HH, HL, LH, LL) to identify divergences.
Trend context is determined using the selected method (Zigzag, MA Difference, or External).
Divergences are classified as bullish, bearish, bullish hidden, or bearish hidden based on price-oscillator relationships and trend direction.
🎯Visualization and Alerts
Valid divergences are drawn as lines connecting price and oscillator pivots, with corresponding labels.
Alerts are triggered for allowed divergence types, providing detailed information via tooltips.
🎯Validation
Divergence lines are validated to ensure no intermediate bars violate the divergence condition, enhancing signal reliability.
🎲 Usage Instructions as Indicator
🎯Add to Chart:
Add the “Divergence Screener ” to your TradingView chart.
The indicator appears in a separate pane below the price chart, plotting the oscillator and divergence signals.
🎯Configure Settings:
Adjust the oscillator type and length to match your trading style.
Select a trend detection method and configure related parameters (e.g., MA type/length or external signal).
Set the zigzag length and repainting preference.
Enable/disable alerts for specific divergence types.
I🎯nterpret Signals:
Bullish Divergence (Green) : Look for potential buy opportunities in a downtrend.
Bearish Divergence (Red) : Consider sell opportunities in an uptrend.
Bullish Hidden Divergence (Lime) : Confirm continuation in an uptrend.
Bearish Hidden Divergence (Orange): Confirm continuation in a downtrend.
Use tooltips on labels to review detailed pivot and divergence information.
🎯Set Alerts:
Create alerts for each divergence type to receive notifications via TradingView’s alert system.
Alerts include detailed text with price, oscillator, and divergence information.
🎲 Example Scenarios as Indicator
🎯 With External Oscillator (Use MACD Histogram as Oscillator)
In order to use MACD as an oscillator for divergence signal instead of the built in options, follow these steps.
Load MACD Indicator from Indicator library
From Indicator settings of Divergence Screener, set Use External Oscillator and select MACD Histograme from the dropdown
You can now see that the oscillator pane shows the data of selected MACD histogram and divergence signals are generated based on the external MACD histogram data.
🎯 With External Trend Signal (Supertrend Ladder ATR)
Now let's demonstrate how to use external direction signals using Supertrend Ladder ATR indicator. Please note that in order to use the indicator as trend source, the indicator should return positive integer for uptrend and negative integer for downtrend. Steps are as follows:
Load the desired trend indicator. In this example, we are using Supertrend Ladder ATR
From the settings of Divergence Screener, select "External" as Trend Detection Method
Select the trend detection plot Direction from the dropdown. You can now see that the divergence signals will rely on the new trend settings rather than the built in options.
🎲 Using the Script with Pine Screener
The primary purpose of the Divergence Screener is to enable traders to scan multiple instruments (e.g., stocks, ETFs, forex pairs) for divergence signals using TradingView’s Pine Screener, facilitating efficient comparison and identification of trading opportunities.
To use the Divergence Screener as a screener, follow these steps:
Add to Favorites : Add the Divergence Screener to your TradingView favorites to make it available in the Pine Screener.
Create a Watchlist : Build a watchlist containing the instruments (e.g., stocks, ETFs, or forex pairs) you want to scan for divergences.
Access Pine Screener : Navigate to the Pine Screener via TradingView’s main menu: Products -> Screeners -> Pine, or directly visit tradingview.com/pine-screener/.
Select Watchlist : Choose the watchlist you created from the Watchlist dropdown in the Pine Screener interface.
Choose Indicator : Select Divergence Screener from the Choose Indicator dropdown.
Configure Settings : Set the desired timeframe (e.g., 1 hour, 1 day) and adjust indicator settings such as oscillator type, zigzag length, or trend detection method as needed.
Select Filter Criteria : Select the condition on which the watchlist items needs to be filtered. Filtering can only be done on the plots defined in the script.
Run Scan : Press the Scan button to display divergence signals across the selected instruments. The screener will show which instruments exhibit bullish, bearish, bullish hidden, or bearish hidden divergences based on the configured settings.
🎲 Limitations and Possible Future Enhancements
Limitations are
Custom input for oscillator and trend detection cannot be used in pine screener.
Pine screener has max 500 bars available.
Repaint option is by default enabled. When in repaint mode expect the early signal but the signals are prone to repaint.
Possible future enhancements
Add more built-in options for oscillators and trend detection methods so that dependency on external indicators is limited
Multi level zigzag support
SIP Evaluator and Screener [Trendoscope®]The SIP Evaluator and Screener is a Pine Script indicator designed for TradingView to calculate and visualize Systematic Investment Plan (SIP) returns across multiple investment instruments. It is tailored for use in TradingView's screener, enabling users to evaluate SIP performance for various assets efficiently.
🎲 How SIP Works
A Systematic Investment Plan (SIP) is an investment strategy where a fixed amount is invested at regular intervals (e.g., monthly or weekly) into a financial instrument, such as stocks, mutual funds, or ETFs. The goal is to build wealth over time by leveraging the power of compounding and mitigating the impact of market volatility through disciplined, consistent investing. Here’s a breakdown of how SIPs function:
Regular Investments : In an SIP, an investor commits to investing a fixed sum at predefined intervals, regardless of market conditions. This consistency helps inculcate a habit of saving and investing.
Cost Averaging : By investing a fixed amount regularly, investors purchase more units when prices are low and fewer units when prices are high. This approach, known as dollar-cost averaging, reduces the average cost per unit over time and mitigates the risk of investing a large amount at a peak price.
Compounding Benefits : Returns generated from the invested amount (e.g., capital gains or dividends) are reinvested, leading to exponential growth over the long term. The longer the investment horizon, the greater the potential for compounding to amplify returns.
Dividend Reinvestment : In some SIPs, dividends received from the underlying asset can be reinvested to purchase additional units, further enhancing returns. Taxes on dividends, if applicable, may reduce the reinvested amount.
Flexibility and Accessibility : SIPs allow investors to start with small amounts, making them accessible to a wide range of individuals. They also offer flexibility in terms of investment frequency and the ability to adjust or pause contributions.
In the context of the SIP Evaluator and Screener , the script simulates an SIP by calculating the number of units purchased with each fixed investment, factoring in commissions, dividends, taxes and the chosen price reference (e.g., open, close, or average prices). It tracks the cumulative investment, equity value, and dividends over time, providing a clear picture of how an SIP would perform for a given instrument. This helps users understand the impact of regular investing and make informed decisions when comparing different assets in TradingView’s screener. It offers insights into key metrics such as total invested amount, dividends received, equity value, and the number of installments, making it a valuable resource for investors and traders interested in understanding long-term investment outcomes.
🎲 Key Features
Customizable Investment Parameters: Users can define the recurring investment amount, price reference (e.g., open, close, HL2, HLC3, OHLC4), and whether fractional quantities are allowed.
Commission Handling: Supports both fixed and percentage-based commission types, adjusting calculations accordingly.
Dividend Reinvestment: Optionally reinvests dividends after a user-specified period, with the ability to apply tax on dividends.
Time-Bound Analysis: Allows users to set a start year for the analysis, enabling historical performance evaluation.
Flexible Dividend Periods: Dividends can be evaluated based on bars, days, weeks, or months.
Visual Outputs: Plots key metrics like total invested amount, dividends, equity value, and remainder, with customizable display options for clarity in the data window and chart.
🎲 Using the script as an indicator on Tradingview Supercharts
In order to use the indicator on charts, do the following.
Load the instrument of your choice - Preferably a stable stocks, ETFs.
Chose monthly timeframe as lower timeframes are insignificant in this type of investment strategy
Load the indicator SIP Evaluator and Screener and set the input parameters as per your preference.
Indicator plots, investment value, dividends and equity on the chart.
🎲 Visualizations
Installments : Displays the number of SIP installments (gray line, visible in the data window).
Invested Amount : Shows the cumulative amount invested, excluding reinvested dividends (blue area plot).
Dividends : Tracks total dividends received (green area plot).
Equity : Represents the current market value of the investment based on the closing price (purple area plot).
Remainder : Indicates any uninvested cash after each installment (gray line, visible in the data window).
🎲 Deep dive into the settings
The SIP Evaluator and Screener offers a range of customizable settings to tailor the Systematic Investment Plan (SIP) simulation to your preferences. Below is an explanation of each setting, its purpose, and how it impacts the analysis:
🎯 Duration
Start Year (Default: 2020) : Specifies the year from which the SIP calculations begin. When Start Year is enabled via the timebound option, the script only considers data from the specified year onward. This is useful for analyzing historical SIP performance over a defined period. If disabled, the script uses all available data.
Timebound (Default: False) : A toggle to enable or disable the Start Year restriction. When set to False, the SIP calculation starts from the earliest available data for the instrument.
🎯 Investment
Recurring Investment (Default: 1000.0) : The fixed amount invested in each SIP installment (e.g., $1000 per period). This represents the regular contribution to the SIP and directly influences the total invested amount and quantity purchased.
Allow Fractional Qty (Default: True) : When enabled, the script allows the purchase of fractional units (e.g., 2.35 shares). If disabled, only whole units are purchased (e.g., 2 shares), with any remaining funds carried forward as Remainder. This setting impacts the precision of investment allocation.
Price Reference (Default: OPEN): Determines the price used for purchasing units in each SIP installment. Options include:
OPEN : Uses the opening price of the bar.
CLOSE : Uses the closing price of the bar.
HL2 : Uses the average of the high and low prices.
HLC3 : Uses the average of the high, low, and close prices.
OHLC4 : Uses the average of the open, high, low, and close prices. This setting affects the cost basis of each purchase and, consequently, the total quantity and equity value.
🎯 Commission
Commission (Default: 3) : The commission charged per SIP installment, expressed as either a fixed amount (e.g., $3) or a percentage (e.g., 3% of the investment). This reduces the amount available for purchasing units.
Commission Type (Default: Fixed) : Specifies how the commission is calculated:
Fixed ($) : A flat fee is deducted per installment (e.g., $3).
Percentage (%) : A percentage of the investment amount is deducted as commission (e.g., 3% of $1000 = $30). This setting affects the net amount invested and the overall cost of the SIP.
🎯 Dividends
Apply Tax On Dividends (Default: False) : When enabled, a tax is applied to dividends before they are reinvested or recorded. The tax rate is set via the Dividend Tax setting.
Dividend Tax (Default: 47) : The percentage of tax deducted from dividends if Apply Tax On Dividends is enabled (e.g., 47% tax reduces a $100 dividend to $53). This reduces the amount available for reinvestment or accumulation.
Reinvest Dividends After (Default: True, 2) : When enabled, dividends received are reinvested to purchase additional units after a specified period (e.g., 2 units of time, defined by Dividends Availability). If disabled, dividends are tracked but not reinvested. Reinvestment increases the total quantity and equity over time.
Dividends Availability (Default: Bars) : Defines the time unit for evaluating when dividends are available for reinvestment. Options include:
Bars : Based on the number of chart bars.
Weeks : Based on weeks.
Months : Based on months (approximated as 30.5 days). This setting determines the timing of dividend reinvestment relative to the Reinvest Dividends After period.
🎯 How Settings Interact
These settings work together to simulate a realistic SIP. For example, a $1000 recurring investment with a 3% commission and fractional quantities enabled will calculate the number of units purchased at the chosen price reference after deducting the commission. If dividends are reinvested after 2 months with a 47% tax, the script fetches dividend data, applies the tax, and adds the net dividend to the investment amount for that period. The Start Year and Timebound settings ensure the analysis aligns with the desired timeframe, while the Dividends Availability setting fine-tunes dividend reinvestment timing.
By adjusting these settings, users can model different SIP scenarios, compare performance across instruments in TradingView’s screener, and gain insights into how commissions, dividends, and price references impact long-term returns.
🎲 Using the script with Pine Screener
The main purpose of developing this script is to use it with Tradingview Pine Screener so that multiple ETFs/Funds can be compared.
In order to use this as a screener, the following things needs to be done.
Add SIP Evaluator and Screener to your favourites (Required for it to be added in pine screener)
Create a watch list containing required instruments to compare
Open pine screener from Tradingview main menu Products -> Screeners -> Pine or simply load the URL - www.tradingview.com
Select the watchlist created from Watchlist dropdown.
Chose the SIP Evaluator and Screener from the "Choose Indicator" dropdown
Set timeframe to 1 month and update settings as required.
Press scan to display collected data on the screener.
🎲 Use Case
This indicator is ideal for educational purposes, allowing users to experiment with SIP strategies across different instruments. It can be applied in TradingView’s screener to compare SIP performance for stocks, ETFs, or other assets, helping users understand how factors like commissions, dividends, and price references impact returns over time.
Options SCREENER [Lite] - IVRank, IVx, Deltas, Exp.move, Skew
𝗢𝗽𝘁𝗶𝗼𝗻 𝘀𝗰𝗿𝗲𝗲𝗻𝗲𝗿 𝗼𝗻 𝗧𝗿𝗮𝗱𝗶𝗻𝗴𝗩𝗶𝗲𝘄 𝘄𝗶𝘁𝗵 𝗿𝗲𝗮𝗹 𝗱𝗮𝘁𝗮, 𝗼𝗻𝗹𝘆 𝗳𝗼𝗿 𝟱 𝗹𝗶𝗾𝘂𝗶𝗱 𝗨𝗦 𝗺𝗮𝗿𝗸𝗲𝘁 𝘀𝘆𝗺𝗯𝗼𝗹𝘀
𝗢𝘂𝗿 𝘀𝗰𝗿𝗲𝗲𝗻𝗲𝗿 𝗽𝗿𝗼𝘃𝗶𝗱𝗲𝘀 𝗲𝘀𝘀𝗲𝗻𝘁𝗶𝗮𝗹 𝗸𝗲𝘆 𝗺𝗲𝘁𝗿𝗶𝗰𝘀 𝘀𝘂𝗰𝗵 𝗮𝘀:
✅ IVRank
✅ IVx
✅ 5-Day IVx Change
✅ Vertical Pricing Skew
✅ Horizontal IVx Skew
✅ Delta Skew
like TastyTrade, TOS, IBKR etc.
Designed to help you assess option market conditions and make well-informed trading decisions, this tool is an essential addition for every serious options trader!
Ticker Information:
This screener is currently implemented only for 5 liquid US market tickers:
NASDAQ:AAPL NASDAQ:AMZN AMEX:DIA NYSE:ORCL and NASDAQ:TSLA
How does the screener work and why is it unique?
This Pine Script screener is an expert tool created to provide various option metrics and visualization tools for options market traders. The screener extracts raw options data from an external data provider (ORATS), processes, and refines the delayed data package using pineseed, and sends it to TradingView. The data is calculated using specific formulas or interpolated values, such as delta distances. This method of integrating options data into a screener framework is unique and innovative on TradingView.
The screener aims to offer a comprehensive view of the current state of options for the implemented instruments, including implied volatility index (IVx), IV rank (IVR), options skew, and expected market movements, which are objectively measured as detailed below.
The options metrics displayed may be familiar to options traders from various major brokerage platforms such as TastyTrade, IBKR, TOS, Tradier, TD Ameritrade, Schwab, etc.
🟨 𝗗𝗘𝗧𝗔𝗜𝗟𝗘𝗗 𝗗𝗢𝗖𝗨𝗠𝗘𝗡𝗧𝗔𝗧𝗜𝗢𝗡 🟨
~~~~~~~~~~~~~~~~~~~~~~~~~~~~~~~~~~~~~~~~~~~~~~~~~~
~~~~~~~~~~~~~~~~~~~~~~~~~~~~~~~~~~~~~~~~~~~~~~~~~~
🔶 Auto-Updating Option Metrics
~~~~~~~~~~~~~~~~~~~~~~~~~~~~~~~~~~~~~~~~~~~~~~~~~~
~~~~~~~~~~~~~~~~~~~~~~~~~~~~~~~~~~~~~~~~~~~~~~~~~~
🔹 IVR (IV Rank)
The Implied Volatility Rank (IVR) indicator helps options traders assess the current level of implied volatility (IV) in comparison to the past 52 weeks. IVR is a useful metric to determine whether options are relatively cheap or expensive. This can guide traders on whether to buy or sell options. We calculate IVrank, like TastyTrade does.
IVR Calculation: IV Rank = (current IV - 52 week IV low) / (52 week IV high - 52 week IV low)
IVR Levels and Interpretations:
IVR 0-10 (Green): Very low implied volatility rank. Options might be "cheap," potentially a good time to buy options.
IVR 10-35 (White): Normal implied volatility rank. Options pricing is relatively standard.
IVR 35-50 (Orange): Almost high implied volatility rank.
IVR 50-75 (Red): Definitely high implied volatility rank. Options might be "expensive," potentially a good time to sell options for higher premiums.
IVR above 75 (Highlighted Red): Ultra high implied volatility rank. Indicates very high levels, suggesting a favorable time for selling options.
Extra: If the IVx value is also greater than 30, the background will be dark highlighted, because a high IVR alone doesn’t mean much without high IVx.
🔹IVx (Implied Volatility Index)
The Implied Volatility Index (IVx) displayed in the option chain is calculated similarly to the VIX. The Cboe employs standard and weekly SPX options to measure the expected volatility of the S&P 500. A similar method is utilized to calculate IVx for each option expiration cycle.
For our purposes, we aggregate the IVx values specifically for the 35-70 day monthly expiration cycle . This aggregated value is then presented in the screener and info panel, providing a clear and concise measure of implied volatility over this period.
We will display a warning if the option chain is heavily skewed and valid, symmetric 16 delta options are not found at optimal monthly expirations.
IVx Color coding:
IVx above 30 is displayed in orange.
IVx above 60 is displayed in red
Important Note: The IVx value alone does not provide sufficient context. There are stocks that inherently exhibit high IVx values. Therefore, it is crucial to consider IVx in conjunction with the Implied Volatility Rank (IVR), which measures the IVx relative to its own historical values. This combined view helps in accurately assessing the significance of the IVx in relation to the specific stock's typical volatility behavior.
This indicator offers traders a comprehensive view of implied volatility, assisting them in making informed decisions by highlighting both the absolute and relative volatility measures.
🔹IVx 5 days change %
We are displaying the five-day change of the IV Index (IVx value). The IV Index 5-Day Change column provides quick insight into recent expansions or decreases in implied volatility over the last five trading days.
Traders who expect the value of options to decrease might view a decrease in IVX as a positive signal. Strategies such as Strangle and Ratio Spread can benefit from this decrease.
On the other hand, traders anticipating further increases in IVX will focus on the rising IVX values. Strategies like Calendar Spread or Diagonal Spread can take advantage of increasing implied volatility.
This indicator helps traders quickly assess changes in implied volatility, enabling them to make informed decisions based on their trading strategies and market expectations.
🔹 Vertical Pricing Skew
At TanukiTrade, Vertical Pricing Skew refers to the difference in pricing between put and call options with the same expiration date at the same distance (at expected move). We analyze this skew to understand market sentiment. This is the same formula used by TastyTrade for calculations.
PUT Skew (red): Put options are more expensive than call options, indicating the market expects a downward move (▽). If put options are more expensive by more than 20% at the same expected move distance, we color it lighter red.
CALL Skew (green): Call options are more expensive than put options, indicating the market expects an upward move (△). If call options are priced more than 30% higher at the examined expiration, we color it lighter green.
We focus on options with 35-70 days to expiration (DTE) for optimal analysis. We always evaluate the skew at the expected move using linear interpolation to determine the theoretical pricing of options. If the pricing have more than C50%/P35% we are highlighting the cell.
This approach helps us gauge market expectations accurately, providing insights into potential price movements.
🔹 Horizontal IVx Skew
In options pricing, it is typically expected that the implied volatility (IVx) increases for options with later expiration dates. This means that options further out in time are generally more expensive. At TanukiTrade, we refer to the phenomenon where this expectation is reversed—when the IVx decreases between two consecutive expirations—as Horizontal Skew or IVx Skew.
Horizontal IVx Skew occurs when: Front Month IVx < Back Month IVx
This scenario can create opportunities for traders who prefer diagonal or calendar strategies. Based on our experience, we categorize Horizontal Skew into two types:
Weekly Horizontal Skew: When IVx skew is observed between two consecutive non-monthly expirations , the displayed value is the rounded-up percentage difference. On hover, the approximate location of this skew is also displayed. The precise location can be seen on the Overlay indicator.
Monthly Horizontal Skew: When IVx skew is observed between two consecutive monthly expirations , the displayed value is the rounded-up percentage difference. On hover, the approximate location of this skew is also displayed. The precise location can be seen on the Overlay indicator.
The Monthly Vertical IVx skew is consistently stronger (more liquid) on average symbols than the weekly vertical IVx skew. Weekly Horizontal IVx Skew may not carry relevant information for symbols not included in the 'Weeklies & Volume Masters' preset.
If the options chain follows the normal IVx pattern, no skew value is displayed.
Additionally , if the Implied Volatility Rank (IVR) is low (indicated by green), the Horizontal Skew background turns black, because this environment is good for Calendar+Diagonal.
Additionally , if the % of the skew is greater than 10, the Horizontal Skew font color turns lighter.
🔹 Delta Skew 🌪️ (Twist)
We have a metric that examines which monthly expiration indicates a "Delta Skew Twist" where the 16 delta deviates from the monthly STD. This is important because, under normal circumstances, the 16 delta is positioned between the expected move and the standard deviation (STD1) line. However, if the interpolated 16 delta line exceeds the STD1 line either upwards or downwards, it represents a special case of vertical skew.
Normal case : exp.move < delta16 < std1
Delta Skew Twist: exp.move < std1 < delta16
If the Days to Expiration of the twist is less than 75, we use a lighter color.
~~~~~~~~~~~~~~~~~~~~~~~~~~~~~~~~~~~~~~~~~~~~~~~~~~
~~~~~~~~~~~~~~~~~~~~~~~~~~~~~~~~~~~~~~~~~~~~~~~~~~
🔶 HOW WE CALCULATE
~~~~~~~~~~~~~~~~~~~~~~~~~~~~~~~~~~~~~~~~~~~~~~~~~~
~~~~~~~~~~~~~~~~~~~~~~~~~~~~~~~~~~~~~~~~~~~~~~~~~~
🔹 Expected Move
The expected move is the predicted dollar change in the underlying stock's price by a given option's expiration date, with 68% certainty. It is calculated using the expiration's pricing and implied volatility levels.
Expected Move Calculation
Expected Move = (ATM straddle price x 0.6) + (1st OTM strangle price x 0.3) + (2nd OTM strangle price x 0.1)
For example , if stock XYZ is trading at 121 and the ATM straddle is 4.40, the 120/122 strangle is 3.46, and the 119/123 strangle is 2.66, the expected move is calculated as follows: 4.40 x 0.60 = 2.64; 3.46 x 0.30 = 1.04; 2.66 x 0.10 = 0.27; Expected move = 2.64 + 1.04 + 0.27 = ±3.9
🔹 Standard deviation
One standard deviation of a stock encompasses approximately 68.2% of outcomes in a distribution of occurrences based on current implied volatility.
We use the expected move formula to calculate the one standard deviation range of a stock. This calculation is based on the days-to-expiration (DTE) of our option contract, the stock price, and the implied volatility of a stock:
Calculation:
Standard Deviation = Closing Price * Implied Volatility * sqrt(Days to Expiration / 365)
According to options literature, there is a 68% probability that the underlying asset will fall within this one standard deviation range at expiration.
∑ Quant Observation: The values of the expected move and the 1st standard deviation (1STD) will not match because they use different calculation methods, even though both are referred to as representing 68% of the underlying asset's movement in options literature. The expected move is based on direct market pricing of ATM options. The 1STD, on the other hand, uses the averaged implied volatility (IVX) for the given expiration to determine its value. Based on our experience, it is better to consider the area between the expected move and the 1STD as the true representation of the original 68% rule.
~~~~~~~~~~~~~~~~~~~~~~~~~~~~~~~~~~~~~~~~~~~~~~~~~~
~~~~~~~~~~~~~~~~~~~~~~~~~~~~~~~~~~~~~~~~~~~~~~~~~~
🔶 USAGE
~~~~~~~~~~~~~~~~~~~~~~~~~~~~~~~~~~~~~~~~~~~~~~~~~~
~~~~~~~~~~~~~~~~~~~~~~~~~~~~~~~~~~~~~~~~~~~~~~~~~~
🔹 Create a new empty layout for the screener!
You can access this from the dropdown menu in the upper right corner. In the popup window, name it as you like, for example, "Option Screener."
🔹 Hide the candlestick chart
Make the chart invisible using the "Hide" option from the three-dot dropdown menu located in the upper left corner.
🔹 Other Unwanted Elements
If other unnecessary elements are distracting you (e.g., economic data, volume, default grid), you can easily remove them from the layout. Right-click on the empty chart area. Here, click on the gear (Settings) icon and remove everything from the "Events" tab, as well as from the "Trading" tab. Under the "Canvas" tab, it is recommended to set the "Grid lines" setting to "None."
~~~~~~~~~~~~~~~~~~~~~~~~~~~~~~~~~~~~~~~~~~~~~~~~~~
~~~~~~~~~~~~~~~~~~~~~~~~~~~~~~~~~~~~~~~~~~~~~~~~~~
🔶 Screener Settings
~~~~~~~~~~~~~~~~~~~~~~~~~~~~~~~~~~~~~~~~~~~~~~~~~~
~~~~~~~~~~~~~~~~~~~~~~~~~~~~~~~~~~~~~~~~~~~~~~~~~~
Naturally, the font size and position can be easily adjusted.
Additionally, there are two basic usage modes: manual input or using the preset list.
🔹If you selected “Manual Below” in the preset dropdown, the tickers you chose from the dropdown (up to a maximum of 40) will be displayed. The panel name will be the one you specified.
🔹If you selected a pre-assembled list , the manually entered list will be ignored, and the preset list will be displayed. (In the future, we will expand the preset list based on your feedback!).
~~~~~~~~~~~~~~~~~~~~~~~~~~~~~~~~~~~~~~~~~~~~~~~~~~
~~~~~~~~~~~~~~~~~~~~~~~~~~~~~~~~~~~~~~~~~~~~~~~~~~
🔶 Best Practices for TanukiTrade Option Screener:
~~~~~~~~~~~~~~~~~~~~~~~~~~~~~~~~~~~~~~~~~~~~~~~~~~
~~~~~~~~~~~~~~~~~~~~~~~~~~~~~~~~~~~~~~~~~~~~~~~~~~
🔹 Every Preset on a New Layout:
If you following the steps above, you easy can setup this screener in one window with one split layout:
🔹 Split Layout:
- Left Side: The underlying asset with our Options IV Overlay (IVR, Deltas, Expected Move, STD1, Skew visualized) along with the Enhanced Murrey Math Indicator and Option Expiry.
- Right Side: Searching for opportunities using our Options Screener.
Opportunities Search
🔹 Everything in One Layout + One Window:
This is the all-in-one view:
- The underlying asset with our Options IV Overlay (IVR, Deltas, Expected Move, STD1, Skew visualized)
- Enhanced Murrey Math Indicator and Option Expiry
- Options Screener on the left
~~~~~~~~~~~~~~~~~~~~~~~~~~~~~~~~~~~~~~~~
🔶 ADDITIONAL IMPORTANT COMMENTS
- U.S. market only:
Since we only deal with liquid option chains: this option indicator only works for the USA options market and do not include future contracts; we have implemented each selected symbol individually.
- Why is there a slight difference between the displayed data and my live brokerage data? There are two reasons for this, and one is beyond our control.
- Brokerage Calculation Differences:
Every brokerage has slight differences in how they calculate metrics like IV and IVx. If you open three windows for TOS, TastyTrade, and IBKR side by side, you will notice that the values are minimally different. We had to choose a standard, so we use the formulas and mathematical models described by TastyTrade when analyzing the options chain and drawing conclusions.
- Option-data update frequency:
According to TradingView's regulations and guidelines, we can update external data a maximum of 5 times per day. We strive to use these updates in the most optimal way:
(1st update) 15 minutes after U.S. market open
(2nd, 3rd, 4th updates) 1.5–3 hours during U.S. market open hours
(5th update) 10 minutes before market close.
You don’t need to refresh your window, our last refreshed data-pack is always automatically applied to your indicator , and you can see the time elapsed since the last update at the bottom of your indicator.
- Weekly illiquid expiries:
The Weekly Horizontal IVx Skew may not carry relevant information for instruments not included in the 'Weeklies & Volume Masters' preset package.
-Timeframe Issues:
Our option indicator visualizes relevant data on a daily resolution. If you see strange or incorrect data (e.g., when the options data was last updated), always switch to a daily (1D) timeframe. If you still see strange data, please contact us.
Disclaimer:
Our option indicator uses approximately 15min-3 hour delayed option market snapshot data to calculate the main option metrics. Exact realtime option contract prices are never displayed; only derived metrics and interpolated delta are shown to ensure accurate and consistent visualization. Due to the above, this indicator can only be used for decision support; exclusive decisions cannot be made based on this indicator . We reserve the right to make errors.This indicator is designed for options traders who understand what they are doing. It assumes that they are familiar with options and can make well-informed, independent decisions. We work with public data and are not a data provider; therefore, we do not bear any financial or other liability.
Waterfall ScreenerHow to Use This to Screen Stocks: A Step-by-Step Guide
Save the Screener Script: Open the Pine Editor, paste the code above, and save it with a clear name like "Waterfall Screener".
Open the Stock Screener: Go to the TradingView homepage or any chart page and click the "Screener" tab at the bottom. Make sure you are on the "Stock" screener.
Set Your Market: Choose the market you want to scan (e.g., NASDAQ, NYSE).
Add Your Custom Filter (The Magic Step):
Click the "Filters" button on the right side of the screener panel.
In the search box that appears, type the name of your new script: "Waterfall Screener".
It will appear as a selectable filter. Click it.
Configure the Filter:
A new filter will appear in your screener list named "Waterfall Screener".
You can now set conditions for the "ScreenerSignal" value we plotted.
To find stocks with a new, actionable trade plan, set the filter to:
Waterfall Screener | Equal | 1
Refine and Scan:
Add other essential filters to reduce noise, such as:
Volume > 1M (to find liquid stocks)
Market Cap > 1B (to find established companies)
The screener will now automatically update and show you a list of all stocks that currently have a "PENDING_ENTRY" setup according to the indicator's logic and your chosen timeframe (e.g., Daily).
TraderJoe's Vol ScreenerA professional-grade volatility indicator that displays real-time volatility calculations as a clean overlay on your chart. Features multiple volatility calculation methods, multi-symbol screening capabilities, and extensive customization options. Perfect for volatility-based trading strategies, risk management, and market analysis.
Key Features:
4 Volatility Calculation Methods: Choose from Close-to-Close, Parkinson, Garman-Klass, or ATR-based volatility
Multi-Symbol Screener: Monitor volatility across up to 5 symbols simultaneously
Fixed Chart Overlay: Clean, non-intrusive display that doesn't interfere with price action
Lookback Period Highlighting: Visualize exactly which price data is being analyzed
Debug Mode: Deep dive into volatility components with detailed statistics
Fully Customizable: Colors, positions, text size, and display options
Volatility Methods Explained
Close-to-Close (Traditional)
Uses only closing prices
Standard deviation of logarithmic returns
Most common but ignores intraday movement
Parkinson (Default)
Uses high-low range
More efficient than close-to-close
Better captures intraday volatility
Ideal for trending markets
Garman-Klass
Uses OHLC data
Most efficient estimator
Captures overnight gaps and intraday movement
Best for 24/7 markets like crypto
ATR-Based
Uses Average True Range
Intuitive for traders familiar with ATR
Includes gaps between periods
Shown as percentage of price
Instructions
Basic Setup:
Add the indicator to your chart
The volatility will display in the top-right corner by default
Default settings use Parkinson volatility with 20-period lookback
Configuration Options:
Volatility Settings:
Lookback Period: Number of bars to calculate volatility (2-500)
Volatility Method: Choose your preferred calculation method
Annualize Volatility: Toggle to show annualized volatility
Decimal Places: Precision of volatility display (0-4)
Display Settings:
Text Size: From tiny to huge
Text/Background Colors: Customize appearance
Table Position: 9 positions available (corners, edges, center)
Highlight Lookback: Shows shaded area for calculation period
Screener Settings:
Show Volatility Screener: Enable multi-symbol monitoring
Screener Symbols: Enter up to 5 comma-separated symbols
Screener Position: Independent positioning from main display
Debug Mode:
Shows calculation method
Average, max, and min returns
Total price range over lookback period
Use Cases:
For Day Traders:
Use 10-20 period lookback on 5-15 minute charts
Parkinson or Garman-Klass methods recommended
Monitor volatility spikes for breakout opportunities
For Swing Traders:
Use 20-50 period lookback on hourly/daily charts
Compare volatility across correlated assets
Identify low volatility consolidations
For Options Traders:
Enable annualized volatility
Compare implied vs. historical volatility
Use screener to find high/low volatility assets
For Risk Management:
Scale position sizes based on volatility
Set stops using volatility multiples
Monitor portfolio volatility exposure
Tips & Best Practices:
Timeframe Matters: The indicator automatically adjusts calculations for your chart timeframe
Annualized vs. Raw:
Annualized: Compare across different timeframes
Raw: Actual volatility for the specific period
Method Selection:
Crypto/Forex (24/7): Use Garman-Klass
Stocks (with gaps): Use Parkinson or ATR-based
Quick analysis: Use default Parkinson
Screener Usage:
Enter symbols without exchange suffix for some brokers
All symbols use the same timeframe as your main chart
Great for finding relative volatility leaders/laggards
Common Questions:
Q: Why does volatility seem low during strong trends?
A: Volatility measures price variability, not direction. Steady trends can have low volatility.
Q: What's a "normal" volatility reading?
A: Varies by asset class:
Major forex pairs: 5-15% annualized
Large-cap stocks: 15-30% annualized
Cryptocurrencies: 50-100%+ annualized
Meme coins: 100-200%+ annualized
Q: How do I add more symbols to the screener?
A: Currently supports 5 symbols. Add them as comma-separated values (e.g., "BTCUSDT,ETHUSDT,SOLUSDT").
Example Setups:
Crypto Volatility Dashboard:
Method: Garman-Klass
Lookback: 24 (for hourly = 1 day)
Screener: Top cryptos
Position both tables on left side
Stock Market Scanner:
Method: ATR-Based
Lookback: 20
Annualized: On
Highlight lookback period
Forex Precision:
Method: Parkinson
Lookback: 50
Decimal places: 3
Debug mode for deep analysis
Prime Multi-Ticker Screener: Real-Time Market StructurePrime Multi-Ticker Screener: Real-Time Market Structure and Trend Detection Tool
Prime Multi-Ticker Screener is designed to track multiple tickers simultaneously, providing real-time insights into market trends and structure changes such as CHoCH (Change of Character) and BOS (Break of Structure). This tool is perfect for traders looking to monitor multiple assets across different timeframes while receiving clear signals that highlight critical market shifts. The indicator delivers instant visual feedback with color-coded backgrounds to make interpreting signals easy and efficient.
Core Features of Prime Multi-Ticker Screener
Multi-Ticker Monitoring: Track up to 5 tickers across multiple timeframes in a single dashboard. This makes it easy to watch several assets at once without cluttering your chart.
CHoCH and BOS Detection: The screener automatically detects and highlights significant market structure shifts. CHoCH signals are shown when a trend reverses or consolidates, while BOS signals indicate a break in previous highs or lows, helping traders catch potential trend reversals early.
Color-Coded Visuals: The background of each signal cell dynamically changes color to represent bullish or bearish signals. Green indicates bullish activity, while red highlights bearish market shifts, making it easy for traders to identify key movements at a glance.
Close Price and ATR Data: For each ticker, the screener displays both the current close price and the 14-period Average True Range (ATR), providing important volatility information to support decision-making.
Detailed Explanation of How Prime Multi-Ticker Screener Works
Prime Multi-Ticker Screener combines trend detection with real-time market structure analysis to deliver comprehensive market insights. It analyzes the following components:
CHoCH Detection: Change of Character occurs when the market switches from trending to ranging or vice versa. This indicator catches these moments by identifying when prices cross pivot levels, providing traders with a valuable signal of potential market phase changes.
BOS Detection: The Break of Structure function highlights moments when the price breaks a significant high or low, often indicating the start of a new trend or the continuation of an existing one.
Close Price & ATR Monitoring: Alongside market structure signals, the screener provides real-time data on the close price and the Average True Range (ATR), ensuring traders have a complete picture of the price and volatility landscape for each asset they are tracking.
Why It's Useful for Traders
Prime Multi-Ticker Screener is a versatile tool that offers substantial benefits to traders who want to stay informed about multiple assets and trends simultaneously:
Comprehensive Monitoring: Track multiple assets in real time, all from a single indicator. Whether you trade crypto, forex, or stocks, this tool helps you stay on top of market movements across different assets and timeframes.
Market Structure Analysis: The automatic detection of CHoCH and BOS signals gives traders an edge by identifying potential reversals and trend continuations as they happen, allowing for more timely and informed trading decisions.
Efficient and Intuitive Design: The screener is designed with simplicity in mind. The color-coded backgrounds quickly alert traders to market structure shifts without overwhelming them with data, making it ideal for those who need to act fast.
How It Works: Practical Usage
Prime Multi-Ticker Screener is ideal for:
Day traders: The real-time tracking of multiple assets allows day traders to quickly spot trading opportunities across different markets.
Swing traders: CHoCH and BOS detection help swing traders catch key market structure shifts, helping them align trades with emerging trends.
Trend followers: The screener provides instant feedback on when a trend is continuing or breaking, helping trend-following traders maintain their positions or exit early when needed.
By combining multiple key metrics—price, volatility, and market structure—Prime Multi-Ticker Screener ensures traders are well-equipped to manage their positions across a variety of assets.
Risk Disclaimer
While Prime Multi-Ticker Screener provides valuable market insights, it's important to remember:
Past performance is not indicative of future results: This screener provides analysis based on historical data, and no indicator can predict future market movements with certainty.
Market Conditions: The effectiveness of Prime Multi-Ticker Screener may vary in different market conditions, so traders should always use proper risk management when trading.
Trading Risks: Like any trading tool, Prime Multi-Ticker Screener should be used as part of a comprehensive trading strategy, including risk management techniques such as stop-loss orders and position sizing.
Strat Assistant Screener MiniStrat Assistant Screener Mini
----------------------------
█ OVERVIEW
This script is intended to provide screening/scanning functionality for the strat for the time period provided in the input (Day is the default).
When added, the script provides a chart with labels separated for each type of candle (2 up, 2 down, outside, inside) as well as actionable signals (inside already provided, hammer, shooter). This script functions the same way as the other strat assistant screener however is limited to 5 tickers and is used more for intraday trading and speed.
█ DETAIL
Inputs
----------
Security/Screener Time Frame: The screener will only run for one time frame, the time frame selected and this can be changed
Actionable Wick Percentage: The percentage of the WICK to determine a hammer or a shooter. For example, the default is .75 or 75%, which means 75% of the candle must be a WICK (top wick 75% for shooter, bottom wick 75% for hammer). If you wish to be more conservative scale it down or more aggressive scale it up
Label Index Offset Factor: There are 6 separate labels that will appear at the bottom separated by this indicator. If you feel like things are too tight or too narrow you can adjust this to spread things out further, or push them closer together.
Security/SXX: The various securities that can be input to track. If you find this is a pain, you can always copy the source code, put it in the pine editor yourself, and manually modify them there. This is the mini version limited to 5 stocks for performance and intraday trading.
Outputs
----------
The screener will provide a second chart at the bottom of the primary chart with labels for the types of candles and actionable signals
Each label will be present even if no results are found.
The label will display the time frame selected toward the end of the header - Strat Assistant Screener:
Each label is colored for quick reference to indicate the various bull/bear/inside/outside "patterns"
Best Practices
----------
While it's limited, it's still not instant. So give it time.
This screener is best used for intraday. If you want something with more data, try the the non mini versino.
The bottom chart can be scaled and moved just like the top one, play around with it to determine what works best for you. I recommend decreasing the scale and then moving it up so you can see it better.
When the time frame is changed, it will take a minute, you can verify the results by seeing the time frame change in the label - Strat Assistant Screener:
I have not played with this thoroughly intraday yet. So it may be buggy/slower.