Stock Scanner - 38 AssetsPullback Scanner and Trading Strategy:
The Scanner's Purpose:
This tool helps identify stocks and futures from a set-list that are in a strong uptrend (above 200 SMA) but experiencing a temporary pullback (RSI below 38), creating potential buying opportunities.
Load 38 Favourite Stocks. They need to be bullish ie: Trading usually above 200 SMA. A drop down switch lets you choose which group. You can find suitable stocks using the filter at FINVIZ:
use on 4hr Timeframes and Above
You must use this on at least the 4hr timeframe, otherwise the 200SMA is not truly placed correctly and a valid trade depends upon the price action being ABOVE the 200SMA.
finviz.com
Key Components:
200 Simple Moving Average (SMA)
Acts as a trend filter
Price above 200 SMA indicates a long-term uptrend
Helps avoid trading against the main trend
Relative Strength Index (RSI)
Set to 38 as the oversold threshold
Identifies temporary weakness in strong trends
Acts as the pullback confirmation. You could add an RSI indicator to the chart for monitoring.
Visual Signals:
Green row: Indicates both conditions are met (price > 200 SMA and RSI < 38)
Yellow triangle: Appears at price bottom when RSI drops below 38
Yellow 200 SMA line: Shows the trend direction and potential support
Trade Setup:
First Requirement: Price must be trading above the 200 SMA
Second Requirement: Wait for RSI to drop below 38
Entry Trigger: When both conditions align (row turns green)
Risk Management: Set stop loss below recent swing low
Exit: When RSI moves above 53 or price crosses below 200 SMA
The scanner monitors multiple instruments simultaneously, allowing traders to identify setups across different markets without manually checking each chart. When a row turns green, that instrument deserves closer attention for potential trade setup.
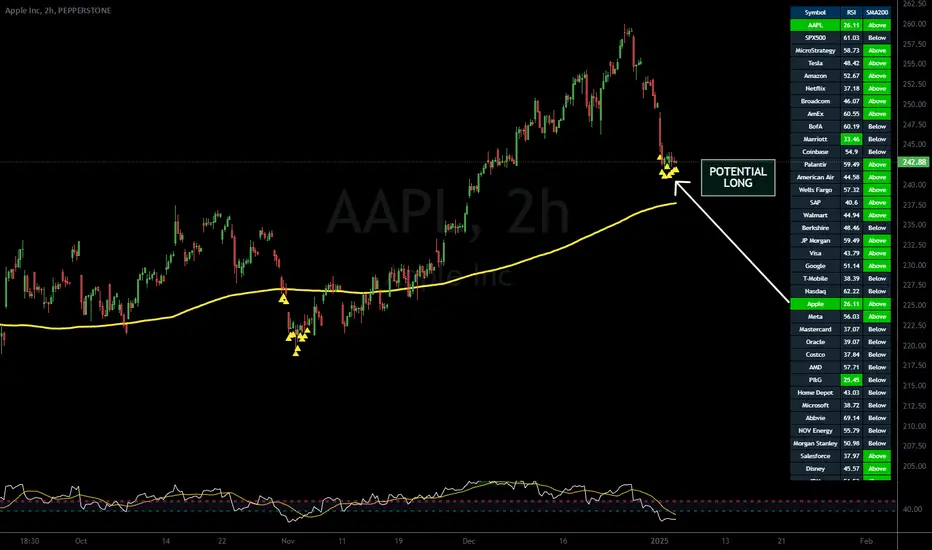
Example Trade:
Looking at the chart of Apple (AAPL), the yellow triangles show where RSI dropped below 38 while price remained above the rising 200 SMA, providing multiple long entry opportunities in an established uptrend. Actually Apple may be better with RSI below 26.
If you use ctrader, I have made a cbot version of this to automatically take trades on the ctrader platform: eg: XAUUSD i.postimg.cc
Cari skrip untuk "screener"
Demand Supply Zone AlertsDemand Supply Zone Alert Indicator
This indicator functions as a scanner/screener and is designed to identify symbols with potential demand and supply zones and generate alerts based on your customized settings. It does not visually plot anything on the chart but is used to place alerts.
Key Features:
1. Demand Supply Zone Patterns:
- Drop Base Rally
- Rally Base Rally
- Rally Base Drop
- Drop Base Drop
2. Zoning Methods:
- Wick to Wick: In a demand zone, this method uses the highest high of the basing as the proximal line. For supply zones, it uses the lowest low of the basing.
- Body to Wick: In a demand zone, this method uses the highest body of the basing as the proximal line. For supply zones, it uses the lowest body of the basing.
3. Legin Methods:
- Candle Type: Based on the candle's bullish or bearish structure.
- Candle Color: Uses the candle color to determine the legin, with green indicating a rally and red indicating a drop.
4. Additional Zone Options:
- Follow Through Pattern: Zones with one legout followed by another legout, based on user-defined strength settings.
- Overnight Gap Zones: Zones formed due to overnight gaps after the basing.
- All Demand Supply Zone Structures: Includes all zones, even if they are not considered quality zones.
5. Zone Settings:
- Number of Candles in Basing: Customize the number of candles in the basing phase. For example, setting it to 3 will only identify zones with 3 or fewer basing candles.
- Legout Strength for Single Legout Pattern: Defines how strong a legout candle must be to qualify as a zone.
- Legout Strength for Follow-Through Pattern: Specifies the strength required for two consecutive legout candles to qualify as a follow-through pattern.
Functionality:
The indicator identifies zones based on a three-component structure: legin, basing, and legout. It uses an algorithm that categorizes candles as legin, basing, or legout based on their range compared to the average candle on the chart. Quality zones are defined by legout candles that are significantly larger than the average candle, while basing candles are smaller.
Once a valid zone structure is identified, the indicator will generate an alert from the list of symbols provided in the settings. Alerts will notify users according to their alert notification settings.
Usage Recommendations:
- This indicator works as a real-time scanner or screener to shortlist symbols when a valid zone is formed based on user settings.
- It aids in identifying potential demand and supply zones, but does not provide explicit buy or sell signals.
- Users should integrate this tool with their own trading plan and thoroughly evaluate any identified symbols before making trades.
Limitations:
This indicator does not provide explicit buy or sell signals. It is intended to aid in identifying symbols where demand and supply zones are being created. Users should use this tool in conjunction with their own trade plan and thoroughly evaluate any identified symbols before making any trades.
Disclaimer:
Please ensure you thoroughly evaluate and qualify any identified symbols according to your individual trade plan before making any trades.

Options Overlay [Pro] IVR IV Skew Delta Exp.mv MurreyMath Expiry
𝗧𝗵𝗲 𝗳𝗶𝗿𝘀𝘁 𝗿𝗲𝗮𝗹 𝗼𝗽𝘁𝗶𝗼𝗻𝘀 𝗱𝗮𝘁𝗮 𝗶𝗻𝗱𝗶𝗰𝗮𝘁𝗼𝗿 𝗼𝗻 𝗧𝗿𝗮𝗱𝗶𝗻𝗴𝗩𝗶𝗲𝘄, 𝗮𝘃𝗮𝗶𝗹𝗮𝗯𝗹𝗲 𝗳𝗼𝗿 𝗼𝘃𝗲𝗿 𝟭𝟱𝟬+ 𝗹𝗶𝗾𝘂𝗶𝗱 𝗨𝗦 𝗺𝗮𝗿𝗸𝗲𝘁 𝘀𝘆𝗺𝗯𝗼𝗹𝘀.
🔃 Auto-Updating Option Metrics without refresh!
🍒 Developed and maintained by option traders for option traders.
📈 Specifically designed for TradingView users who trade options.
Our indicator provides essential key metrics such as:
✅ IVRank
✅ IVx
✅ 5-Day IVx Change
✅ Delta curves and interpolated distances
✅ Expected move curve
✅ Standard deviation (STD1) curve
✅ Vertical Pricing Skew
✅ Horizontal IVx Skew
✅ Delta Skew
like TastyTrade, TOS, IBKR etc, but in a much more visually intuitive way. See detailed descriptions below.
If this isn't enough, we also include a unique grid system designed specifically for options traders. This package features our innovative dynamic grid system:
✅ Enhanced Murrey Math levels (horizontal scale)
✅ Options expirations (vertical scale)
Designed to help you assess market conditions and make well-informed trading decisions, this tool is an essential addition for every serious options trader!
Ticker Information:
This indicator is currently implemented for more than 150 liquid US market tickers and we are continuously expanding the list:
SP:SPX AMEX:SPY NASDAQ:QQQ NASDAQ:TLT AMEX:GLD
NYSE:AA NASDAQ:AAL NASDAQ:AAPL NYSE:ABBV NASDAQ:ABNB NASDAQ:AMD NASDAQ:AMZN AMEX:ARKK NASDAQ:AVGO NYSE:AXP NYSE:BA NYSE:BABA NYSE:BAC NASDAQ:BIDU AMEX:BITO NYSE:BMY NYSE:BP NASDAQ:BYND NYSE:C NYSE:CAT NYSE:CCJ NYSE:CCL NASDAQ:COIN NYSE:COP NASDAQ:COST NYSE:CRM NASDAQ:CRWD NASDAQ:CSCO NYSE:CVNA NYSE:CVS NYSE:CVX NYSE:DAL NASDAQ:DBX AMEX:DIA NYSE:DIS NASDAQ:DKNG NASDAQ:EBAY NASDAQ:ETSY NASDAQ:EXPE NYSE:F NYSE:FCX NYSE:FDX AMEX:FXI AMEX:GDX AMEX:GDXJ NYSE:GE NYSE:GM NYSE:GME NYSE:GOLD NASDAQ:GOOG NASDAQ:GOOGL NYSE:GPS NYSE:GS NASDAQ:HOOD NYSE:IBM NASDAQ:IEF NASDAQ:INTC AMEX:IWM NASDAQ:JD NYSE:JNJ NYSE:JPM NYSE:JWN NYSE:KO NYSE:LLY NYSE:LOW NYSE:LVS NYSE:MA NASDAQ:MARA NYSE:MCD NYSE:MET NASDAQ:META NYSE:MGM NYSE:MMM NYSE:MPC NYSE:MRK NASDAQ:MRNA NYSE:MRO NASDAQ:MRVL NYSE:MS NASDAQ:MSFT AMEX:MSOS NYSE:NCLH NASDAQ:NDX NYSE:NET NASDAQ:NFLX NYSE:NIO NYSE:NKE NASDAQ:NVDA NASDAQ:ON NYSE:ORCL NYSE:OXY NASDAQ:PEP NYSE:PFE NYSE:PINS NYSE:PLTR NASDAQ:PTON NASDAQ:PYPL NASDAQ:QCOM NYSE:RBLX NYSE:RCL NASDAQ:RIOT NASDAQ:RIVN NASDAQ:ROKU NASDAQ:SBUX NYSE:SHOP AMEX:SLV NASDAQ:SMCI NASDAQ:SMH NYSE:SNAP NYSE:SQ NYSE:T NYSE:TGT NASDAQ:TQQQ NASDAQ:TSLA NYSE:TSM NASDAQ:TTD NASDAQ:TXN NYSE:U NASDAQ:UAL NYSE:UBER AMEX:UNG NYSE:UPS NASDAQ:UPST AMEX:USO NYSE:V AMEX:VXX NYSE:VZ NASDAQ:WBA NYSE:WFC NYSE:WMT NASDAQ:WYNN NYSE:X AMEX:XHB AMEX:XLE AMEX:XLF AMEX:XLI AMEX:XLK AMEX:XLP AMEX:XLU AMEX:XLV AMEX:XLY NYSE:XOM NYSE:XPEV CBOE:XSP NASDAQ:ZM
How does the indicator work and why is it unique?
This Pine Script indicator is a complex tool designed to provide various option metrics and visualization tools for options market traders. The indicator extracts raw options data from an external data provider (ORATS), processes and refines the delayed data package using pineseed, and sends it to TradingView, visualizing the data using specific formulas (see detailed below) or interpolated values (e.g., delta distances). This method of incorporating options data into a visualization framework is unique and entirely innovative on TradingView.
The indicator aims to offer a comprehensive view of the current state of options for the implemented instruments, including implied volatility (IV), IV rank (IVR), options skew, and expected market movements, which are objectively measured as detailed below.
The options metrics we display may be familiar to options traders from various major brokerage platforms such as TastyTrade, IBKR, TOS, Tradier, TD Ameritrade, Schwab, etc.
🟨 𝗗𝗘𝗧𝗔𝗜𝗟𝗘𝗗 𝗗𝗢𝗖𝗨𝗠𝗘𝗡𝗧𝗔𝗧𝗜𝗢𝗡 🟨
🔶 Auto-Updating Option Metrics and Curved Lines
🔹 Interpolated DELTA Curves (16,20,25,30,40)
In our indicator, the curve layer settings allow you to choose the delta value for displaying the delta curve: 16, 20, 25, 30, or even 40. The color of the curve can be customized, and you can also hide the delta curve by selecting the "-" option.
It's important to mention that we display interpolated deltas from the actual option chain of the underlying asset using the Black-Scholes model. This ensures that the 16 delta truly reflects the theoretical, but accurate, 16 delta distance. (For example, deltas shown by brokerages for individual strikes are rounded; a 0.16 delta might actually be 0.1625.)
🔹 Expected Move Curve (Exp.mv)
The expected move is the predicted dollar change in the underlying stock's price by a given option's expiration date, with 68% certainty. It is calculated using the expiration's pricing and implied volatility levels. We chose the TastyTrade method for calculating expected move, as we found it to be the most expressive.
Expected Move Calculation
Expected Move = (ATM straddle price x 0.6) + (1st OTM strangle price x 0.3) + (2nd OTM strangle price x 0.1)
For example , if stock XYZ is trading at 121 and the ATM straddle is 4.40, the 120/122 strangle is 3.46, and the 119/123 strangle is 2.66, the expected move is calculated as follows: 4.40 x 0.60 = 2.64; 3.46 x 0.30 = 1.04; 2.66 x 0.10 = 0.27; Expected move = 2.64 + 1.04 + 0.27 = ±3.9
In this example below, the TastyTrade platform indicates the expected move on the option chain with a brown color, and the exact value is displayed behind the ± symbol for each expiration. By default, we also use brown for this indication, but this can be changed or the curve display can be turned off.
🔹 Standard Deviation Curve (1 STD)
One standard deviation of a stock encompasses approximately 68.2% of outcomes in a distribution of occurrences based on current implied volatility.
We use the expected move formula to calculate the one standard deviation range of a stock. This calculation is based on the days-to-expiration (DTE) of our option contract, the stock price, and the implied volatility of a stock:
Calculation:
Standard Deviation = Closing Price * Implied Volatility * sqrt(Days to Expiration / 365)
According to options literature, there is a 68% probability that the underlying asset will fall within this one standard deviation range at expiration.
If the 1 STD and Exp.mv displays are both enabled, the indicator fills the area between them with a light gray color. This is because both represent probability distributions that appear as a "bell curve" when graphed, making it visually appealing.
Tip and Note:
The 1 STD line might appear jagged at times , which does not indicate a problem with the indicator. This is normal immediately after market open (e.g., during the first data refresh of the day) or if the expirations are illiquid (e.g., weekly expirations). The 1 STD value is calculated based on the aggregated IVx for the expirations, and the aggregated IVx value for weekly expirations updates less frequently due to lower trading volume. In such cases, we recommend enabling the "Only Monthly Expirations" option to smooth out the bell curve.
∑ Quant Observation:
The values of the expected move and the 1st standard deviation (1STD) will not match because they use different calculation methods, even though both are referred to as representing 68% of the underlying asset's movement in options literature. The expected move is based on direct market pricing of ATM options. The 1STD, on the other hand, uses the averaged implied volatility (IVX) for the given expiration to determine its value. Based on our experience, it is better to consider the area between the expected move and the 1STD as the true representation of the original 68% rule.
🔶 IVR Dashboard Panel Rows
🔹 IVR (IV Rank)
The Implied Volatility Rank (IVR) indicator helps options traders assess the current level of implied volatility (IV) in comparison to the past 52 weeks. IVR is a useful metric to determine whether options are relatively cheap or expensive. This can guide traders on whether to buy or sell options. We calculate IVrank, like TastyTrade does.
IVR Calculation:
IV Rank = (current IV - 52 week IV low) / (52 week IV high - 52 week IV low)
IVR Levels and Interpretations:
IVR 0-10 (Green): Very low implied volatility rank. Options might be "cheap," potentially a good time to buy options.
IVR 10-35 (White): Normal implied volatility rank. Options pricing is relatively standard.
IVR 35-50 (Orange): Almost high implied volatility rank.
IVR 50-75 (Red): Definitely high implied volatility rank. Options might be "expensive," potentially a good time to sell options for higher premiums.
IVR above 75 (Highlighted Red): Ultra high implied volatility rank. Indicates very high levels, suggesting a favorable time for selling options.
The panel refreshes automatically if the symbol is implemented. You can hide the panel or change the position and size.
🔹IVx (Implied Volatility Index)
The Implied Volatility Index (IVx) displayed in the option chain is calculated similarly to the VIX. The Cboe uses standard and weekly SPX options to measure the expected volatility of the S&P 500. A similar method is utilized to calculate IVx for each option expiration cycle.
For our purposes on the IVR Panel, we aggregate the IVx values specifically for the 35-70 day monthly expiration cycle . This aggregated value is then presented in the screener and info panel, providing a clear and concise measure of implied volatility over this period.
IVx Color coding:
IVx above 30 is displayed in orange.
IVx above 60 is displayed in red
IVx on curve:
The IVx values for each expiration can be viewed by hovering the mouse over the colored tooltip labels above the Curve.
IVx avg on IVR panel :
If the option is checked in the IVR panel settings, the IVR panel will display the average IVx values up to the optimal expiration.
Important Note:
The IVx value alone does not provide sufficient context. There are stocks that inherently exhibit high IVx values. Therefore, it is crucial to consider IVx in conjunction with the Implied Volatility Rank (IVR), which measures the IVx relative to its own historical values. This combined view helps in accurately assessing the significance of the IVx in relation to the specific stock's typical volatility behavior.
This indicator offers traders a comprehensive view of implied volatility, assisting them in making informed decisions by highlighting both the absolute and relative volatility measures.
🔹IVx 5 days change %
We are displaying the five-day change of the IV Index (IVx value). The IV Index 5-Day Change column provides quick insight into recent expansions or decreases in implied volatility over the last five trading days.
Traders who expect the value of options to decrease might view a decrease in IVX as a positive signal. Strategies such as Strangle and Ratio Spread can benefit from this decrease.
On the other hand, traders anticipating further increases in IVX will focus on the rising IVX values. Strategies like Calendar Spread or Diagonal Spread can take advantage of increasing implied volatility.
This indicator helps traders quickly assess changes in implied volatility, enabling them to make informed decisions based on their trading strategies and market expectations.
🔹 Vertical Pricing Skew
At TanukiTrade, Vertical Pricing Skew refers to the difference in pricing between put and call options with the same expiration date at the same distance (at expected move). We analyze this skew to understand market sentiment. This is the same formula used by TastyTrade for calculations.
We calculate the interpolated strike price based on the expected move , taking into account the neighboring option prices and their distances. This allows us to accurately determine whether the CALL or PUT options are more expensive.
PUT Skew (red): Put options are more expensive than call options, indicating the market expects a downward move (▽). If put options are more expensive by more than 20% at the same expected move distance, we color it lighter red.
CALL Skew (green): Call options are more expensive than put options, indicating the market expects an upward move (△). If call options are priced more than 30% higher at the examined expiration, we color it lighter green.
Vertical Skew on Curve:
The degree of vertical pricing skew for each expiration can be viewed by hovering over the points above the curve. Hover with mouse for more information.
Vertical Skew on IVR panel:
We focus on options with 35-70 days to expiration (DTE) for optimal analysis in case of vertical skew. Hover with mouse for more information.
This approach helps us gauge market expectations accurately, providing insights into potential price movements. Remember, we always evaluate the skew at the expected move using linear interpolation to determine the theoretical pricing of options.
🔹 Delta Skew 🌪️ (Twist)
We have a new metric that examines which monthly expiration indicates a "Delta Skew Twist" where the 16 delta deviates from the monthly STD. This is important because, under normal circumstances, the 16 delta is positioned between the expected move and the standard deviation (STD1) line (see Exp.mv & 1STD exact definitions above). However, if the interpolated 16 delta line exceeds the STD1 line either upwards or downwards, it represents a special case of vertical skew on the option chain.
Normal case : exp.move < delta16 < std1
Delta Skew Twist: exp.move < std1 < delta16
We indicate this with direction-specific colors (red/green) on the delta line. We also color the section of the delta curve affected by the delta skew in this case, even if you choose to display a lower delta, such as 30, instead of 16.
If "Colored Labels with Tooltips" is enabled, we also display a 🌪️ symbol in the tooltip for the expirations affected by Delta Skew.
If you have enabled the display of 'Vertical Pricing Skew' on the IVR Panel, a 🌪️ symbol will also appear next to the value of the vertical skew, and the tooltip will indicate from which expiration Delta Skew is observed.
🔹 Horizontal IVx Skew
In options pricing, it is typically expected that the implied volatility (IVx) increases for options with later expiration dates. This means that options further out in time are generally more expensive. At TanukiTrade, we refer to the phenomenon where this expectation is reversed—when the IVx decreases between two consecutive expirations—as Horizontal Skew or IVx Skew.
Horizontal IVx Skew occurs when: Front Expiry IVx < Back Expiry IVx
This scenario can create opportunities for traders who prefer diagonal or calendar strategies . Based on our experience, we categorize Horizontal Skew into two types:
Weekly Horizontal Skew:
When IVx skew is observed between two consecutive non-monthly expirations, the displayed value is the rounded-up percentage difference. On hover, the approximate location of this skew is also displayed. The precise location can be seen on this indicator.
Monthly Horizontal Skew:
When IVx skew is observed between two consecutive monthly expirations , the displayed value is the rounded-up percentage difference. On hover, the approximate location of this skew is also displayed. The precise location can be seen on our Overlay indicator.
The Monthly Vertical IVx skew is consistently more liquid than the weekly vertical IVx skew. Weekly Horizontal IVx Skew may not carry relevant information for symbols not included in the 'Weeklies & Volume Masters' preset in our Options Screener indicator.
If the options chain follows the normal IVx pattern, no skew value is displayed.
Color codes or tooltip labels above curve:
Gray - No horizontal skew;
Purple - Weekly horizontal skew;
BigBlue - Monthly horizontal skew
The display of monthly and weekly IVx skew can be toggled on or off on the IVR panel. However, if you want to disable the colored tooltips above the curve, this can only be done using the "Colored labels with tooltips" switch.
We indicate this range with colorful information bubbles above the upper STD line.
🔶 The Option Trader’s GRID System: Adaptive MurreyMath + Expiry Lines
At TanukiTrade, we utilize Enhanced MurreyMath and Expiry lines to create a dynamic grid system, unlike the basic built-in vertical grids in TradingView, which provide no insight into specific price levels or option expirations.
These grids are beneficial because they provide a structured layout, making important price levels visible on the chart. The grid automatically resizes as the underlying asset's volatility changes, helping traders identify expected movements for various option expirations.
The Option Trader’s GRID System part of this indicator can be used without limitations for all instruments . There are no type or other restrictions, and it automatically scales to fit every asset. Even if we haven't implemented the option metrics for a particular underlying asset, the GRID system will still function!
🔹 SETUP OF YOUR OPTIONS GRID SYSTEM
You can setup your new grid system in 3 easy steps!
STEP1: Hide default horizontal grid lines in TradingView
Right-click on an empty area of your chart, then select “Settings.” In the Chart settings -> Canvas -> Grid lines section, disable the display of horizontal lines to avoid distraction.
SETUP STEP2: Scaling fix
Right-click on the price scale on the right side, then select "Scale price chart only" to prevent the chart from scaling to the new horizontal lines!
STEP3: Enable Tanuki Options Grid
As a final step, make sure that both the vertical (MurreyMath) and horizontal (Expiry) lines are enabled in the Grid section of our indicator.
You are done, enjoy the new grid system!
🔹 HORIZONTAL: Enhanced MurreyMath Lines
Murrey Math lines are based on the principles observed by William Gann, renowned for his market symmetry forecasts. Gann's techniques, such as Gann Angles, have been adapted by Murrey to make them more accessible to ordinary investors. According to Murrey, markets often correct at specific price levels, and breakouts or returns to these levels can signal good entry points for trades.
At TanukiTrade, we enhance these price levels based on our experience , ensuring a clear display. We acknowledge that while MurreyMath lines aren't infallible predictions, they are useful for identifying likely price movements over a given period (e.g., one month) if the market trend aligns.
Our opinion: MurreyMath lines are not crystal balls (like no other tool). They should be used to identify that if we are trading in the right direction, the price is likely to reach the next unit step within a unit time (e.g. monthly expiration).
One unit step is the distance between Murrey Math lines, such as between the 0/8 and 1/8 lines. This interval helps identify different quadrants and is crucial for recognizing support and resistance levels.
Some option traders use Murrey Math lines to gauge the movement speed of an instrument over a unit time. A quadrant encompasses 4 unit steps.
Key levels, according to TanukiTrade, include:
Of course, the lines can be toggled on or off, and their default color can also be changed.
🔹 VERTICAL: Expiry Lines
The indicator can display monthly and weekly expirations as dashed lines, with customizable colors. Weekly expirations will always appear in a lighter shade compared to monthly expirations.
Monthly Expiry Lines:
You can turn off the lines indicating monthly expirations, or set the direction (past/future/both) and the number of lines to be drawn.
Weekly Expiry Lines:
You can display weekly expirations pointing to the future. You can also turn them off or specify how many weeks ahead the lines should be drawn.
Of course, the lines can be toggled on or off, and their default color can also be changed.
TIP: Hide default vertical grid lines in TradingView
Right-click on an empty area of your chart, then select “Settings.” In the Chart settings -> Canvas -> Grid lines section, disable the display of vertical lines to avoid distraction. Same, like steps above at MurreyMath lines.
🔶 ADDITIONAL IMPORTANT COMMENTS
- U.S. market only:
Since we only deal with liquid option chains: this option indicator only works for the USA options market and do not include future contracts; we have implemented each selected symbol individually.
- Why is there a slight difference between the displayed data and my live brokerage data? There are two reasons for this, and one is beyond our control.
- Brokerage Calculation Differences:
Every brokerage has slight differences in how they calculate metrics like IV and IVx. If you open three windows for TOS, TastyTrade, and IBKR side by side, you will notice that the values are minimally different. We had to choose a standard, so we use the formulas and mathematical models described by TastyTrade when analyzing the options chain and drawing conclusions.
- Option-data update frequency:
According to TradingView's regulations and guidelines, we can update external data a maximum of 5 times per day. We strive to use these updates in the most optimal way:
(1st update) 15 minutes after U.S. market open
(2nd, 3rd, 4th updates) 1.5–3 hours during U.S. market open hours
(5th update) 10 minutes before market close.
You don’t need to refresh your window, our last refreshed data-pack is always automatically applied to your indicator , and you can see the time elapsed since the last update at the bottom of your indicator.
- Skewed Curves:
The delta, expected move, and standard deviation curves also appear relevantly on a daily or intraday timeframe. Data loss is experienced above a daily timeframe: this is a TradingView limitation.
- Weekly illiquid expiries:
Especially for instruments where weekly options are illiquid: the weekly expiration STD1 data is not relevant. In these cases, we recommend checking in the "Display only Monthly labels" checkbox to avoid displaying not relevant weekly options expirations.
-Timeframe Issues:
Our option indicator visualizes relevant data on a daily resolution. If you see strange or incorrect data (e.g., when the options data was last updated), always switch to a daily (1D) timeframe. If you still see strange data, please contact us.
Disclaimer:
Our option indicator uses approximately 15min-3 hour delayed option market snapshot data to calculate the main option metrics. Exact realtime option contract prices are never displayed; only derived metrics and interpolated delta are shown to ensure accurate and consistent visualization. Due to the above, this indicator can only be used for decision support; exclusive decisions cannot be made based on this indicator . We reserve the right to make errors.This indicator is designed for options traders who understand what they are doing. It assumes that they are familiar with options and can make well-informed, independent decisions. We work with public data and are not a data provider; therefore, we do not bear any financial or other liability.

Options Overlay [Lite] IVR IV Skew Delta Expmv MurreyMath Expiry𝗡𝗼𝗻-𝗼𝗳𝗳𝗶𝗰𝗶𝗮𝗹 𝗧𝗢𝗦 𝗮𝗻𝗱 𝗧𝗮𝘀𝘁𝘆𝗧𝗿𝗮𝗱𝗲 𝗹𝗶𝗸𝗲 𝗜𝗩𝗥 𝗢𝗽𝘁𝗶𝗼𝗻𝘀 𝘃𝗶𝘀𝘂𝗮𝗹𝗶𝘇𝗮𝘁𝗶𝗼𝗻 𝘁𝗼𝗼𝗹 𝘄𝗶𝘁𝗵 𝗱𝗲𝗹𝗮𝘆𝗲𝗱 𝗼𝗽𝘁𝗶𝗼𝗻 𝗰𝗵𝗮𝗶𝗻 𝗱𝗮𝘁𝗮
Are you an options trader who uses TradingView for technical analysis for the US market?
➡️ Do you want to see the IV Rank of an instrument on TradingView?
➡️ Can’t you check the key options metrics while charting?
➡️ Have you never visualized the options chain before?
➡️ Would you like to see how the IVx has changed for a specific ticker?
If you answered "yes" to any of these questions, then we have the solution for you!
🔃 Auto-Updating Option Metrics without refresh!
🍒 Developed and maintained by option traders for option traders.
📈 Specifically designed for TradingView users who trade options.
Our indicator provides essential key metrics such as:
✅ IVRank
✅ IVx
✅ 5-Day IVx Change
✅ Delta curves and interpolated distances
✅ Expected move curve
✅ Standard deviation (STD1) curve
✅ Vertical Pricing Skew
✅ Horizontal IVx Skew
✅ Delta Skew
like TastyTrade, TOS, IBKR etc, but in a much more visually intuitive way. See detailed descriptions below.
If this isn't enough, we also include a unique grid system designed specifically for options traders. This package features our innovative dynamic grid system:
✅ Enhanced Murrey Math levels (horizontal scale)
✅ Options expirations (vertical scale)
Designed to help you assess market conditions and make well-informed trading decisions, this tool is an essential addition for every serious options trader!
Ticker Information:
This indicator is currently implemented for 5 liquid tickers: NASDAQ:AAPL NASDAQ:AMZN AMEX:DIA NYSE:ORCL and NASDAQ:TSLA
How does the indicator work and why is it unique?
This Pine Script indicator is a complex tool designed to provide various option metrics and visualization tools for options market traders. The indicator extracts raw options data from an external data provider (ORATS), processes and refines the delayed data package using pineseed, and sends it to TradingView, visualizing the data using specific formulas (see detailed below) or interpolated values (e.g., delta distances). This method of incorporating options data into a visualization framework is unique and entirely innovative on TradingView.
The indicator aims to offer a comprehensive view of the current state of options for the implemented instruments, including implied volatility (IV), IV rank (IVR), options skew, and expected market movements, which are objectively measured as detailed below.
The options metrics we display may be familiar to options traders from various major brokerage platforms such as TastyTrade, IBKR, TOS, Tradier, TD Ameritrade, Schwab, etc.
Key Features:
IV Rank (IVR) : The implied volatility rank compares the current IV to the lowest and highest values over the past 52 weeks. The IVR indicator helps determine whether options are relatively cheap or expensive.
IV Average (IVx) : The implied volatility displayed in the options chain, calculated similarly to the VIX. IVx values are aggregated within the 35-70 day expiration cycle.
IV Change (5 days) : The change in implied volatility over the past five trading days. This indicator provides a quick insight into the recent changes in IV.
Expected Move (Exp. Move) : The expected movement for the options expiration cycle, calculated using the price of the ATM (at-the-money) straddle, the first OTM (out-of-the-money) strangle, and the second OTM strangle.
Options Skew : The price difference between put and call options with the same expiration date. Vertical and horizontal skew indicators help understand market sentiment and potential price movements.
Visualization Tools:
Informational IVR Panel : A tabular display mode that presents the selected indicators on the chart. The panel’s placement, size, and content are customizable, including color and tooltip settings.
1 STD, Delta, and Expected Move : Visualization of fundamental classic options metrics corresponding to expirations with bell curves.
Colored Label Tooltips : Detailed tooltips above the bell curves showing options metrics for each expiration.
Adaptive Murrey Math Lines : A horizontal line system based on the principles of Murrey Math Lines, helping identify important price levels and market structures.
Expiration Lines : Displays both monthly and weekly options expirations. The indicator supports various color and style settings, as well as the regulation of the number of expirations displayed.
🟨 𝗗𝗘𝗧𝗔𝗜𝗟𝗘𝗗 𝗗𝗢𝗖𝗨𝗠𝗘𝗡𝗧𝗔𝗧𝗜𝗢𝗡 🟨
🔶 Auto-Updating Option Metrics and Curved Lines
🔹 Interpolated DELTA Curves (16,20,25,30,40)
In our indicator, the curve layer settings allow you to choose the delta value for displaying the delta curve: 16, 20, 25, 30, or even 40. The color of the curve can be customized, and you can also hide the delta curve by selecting the "-" option.
It's important to mention that we display interpolated deltas from the actual option chain of the underlying asset using the Black-Scholes model. This ensures that the 16 delta truly reflects the theoretical, but accurate, 16 delta distance. (For example, deltas shown by brokerages for individual strikes are rounded; a 0.16 delta might actually be 0.1625.)
🔹 Expected Move Curve (Exp.mv)
The expected move is the predicted dollar change in the underlying stock's price by a given option's expiration date, with 68% certainty. It is calculated using the expiration's pricing and implied volatility levels. We chose the TastyTrade method for calculating expected move, as we found it to be the most expressive.
Expected Move Calculation
Expected Move = (ATM straddle price x 0.6) + (1st OTM strangle price x 0.3) + (2nd OTM strangle price x 0.1)
For example , if stock XYZ is trading at 121 and the ATM straddle is 4.40, the 120/122 strangle is 3.46, and the 119/123 strangle is 2.66, the expected move is calculated as follows: 4.40 x 0.60 = 2.64; 3.46 x 0.30 = 1.04; 2.66 x 0.10 = 0.27; Expected move = 2.64 + 1.04 + 0.27 = ±3.9
In this example below, the TastyTrade platform indicates the expected move on the option chain with a brown color, and the exact value is displayed behind the ± symbol for each expiration. By default, we also use brown for this indication, but this can be changed or the curve display can be turned off.
🔹 Standard Deviation Curve (1 STD)
One standard deviation of a stock encompasses approximately 68.2% of outcomes in a distribution of occurrences based on current implied volatility.
We use the expected move formula to calculate the one standard deviation range of a stock. This calculation is based on the days-to-expiration (DTE) of our option contract, the stock price, and the implied volatility of a stock:
Calculation:
Standard Deviation = Closing Price * Implied Volatility * sqrt(Days to Expiration / 365)
According to options literature, there is a 68% probability that the underlying asset will fall within this one standard deviation range at expiration.
If the 1 STD and Exp.mv displays are both enabled, the indicator fills the area between them with a light gray color. This is because both represent probability distributions that appear as a "bell curve" when graphed, making it visually appealing.
Tip and Note:
The 1 STD line might appear jagged at times , which does not indicate a problem with the indicator. This is normal immediately after market open (e.g., during the first data refresh of the day) or if the expirations are illiquid (e.g., weekly expirations). The 1 STD value is calculated based on the aggregated IVx for the expirations, and the aggregated IVx value for weekly expirations updates less frequently due to lower trading volume. In such cases, we recommend enabling the "Only Monthly Expirations" option to smooth out the bell curve.
∑ Quant Observation:
The values of the expected move and the 1st standard deviation (1STD) will not match because they use different calculation methods, even though both are referred to as representing 68% of the underlying asset's movement in options literature. The expected move is based on direct market pricing of ATM options. The 1STD, on the other hand, uses the averaged implied volatility (IVX) for the given expiration to determine its value. Based on our experience, it is better to consider the area between the expected move and the 1STD as the true representation of the original 68% rule.
🔶 IVR Dashboard Panel Rows
🔹 IVR (IV Rank)
The Implied Volatility Rank (IVR) indicator helps options traders assess the current level of implied volatility (IV) in comparison to the past 52 weeks. IVR is a useful metric to determine whether options are relatively cheap or expensive. This can guide traders on whether to buy or sell options. We calculate IVrank, like TastyTrade does.
IVR Calculation:
IV Rank = (current IV - 52 week IV low) / (52 week IV high - 52 week IV low)
IVR Levels and Interpretations:
IVR 0-10 (Green): Very low implied volatility rank. Options might be "cheap," potentially a good time to buy options.
IVR 10-35 (White): Normal implied volatility rank. Options pricing is relatively standard.
IVR 35-50 (Orange): Almost high implied volatility rank.
IVR 50-75 (Red): Definitely high implied volatility rank. Options might be "expensive," potentially a good time to sell options for higher premiums.
IVR above 75 (Highlighted Red): Ultra high implied volatility rank. Indicates very high levels, suggesting a favorable time for selling options.
The panel refreshes automatically if the symbol is implemented. You can hide the panel or change the position and size.
🔹IVx (Implied Volatility Index)
The Implied Volatility Index (IVx) displayed in the option chain is calculated similarly to the VIX. The Cboe uses standard and weekly SPX options to measure the expected volatility of the S&P 500. A similar method is utilized to calculate IVx for each option expiration cycle.
For our purposes on the IVR Panel, we aggregate the IVx values specifically for the 35-70 day monthly expiration cycle . This aggregated value is then presented in the screener and info panel, providing a clear and concise measure of implied volatility over this period.
IVx Color coding:
IVx above 30 is displayed in orange.
IVx above 60 is displayed in red
IVx on curve:
The IVx values for each expiration can be viewed by hovering the mouse over the colored tooltip labels above the Curve.
IVx avg on IVR panel :
If the option is checked in the IVR panel settings, the IVR panel will display the average IVx values up to the optimal expiration.
Important Note:
The IVx value alone does not provide sufficient context. There are stocks that inherently exhibit high IVx values. Therefore, it is crucial to consider IVx in conjunction with the Implied Volatility Rank (IVR), which measures the IVx relative to its own historical values. This combined view helps in accurately assessing the significance of the IVx in relation to the specific stock's typical volatility behavior.
This indicator offers traders a comprehensive view of implied volatility, assisting them in making informed decisions by highlighting both the absolute and relative volatility measures.
🔹IVx 5 days change %
We are displaying the five-day change of the IV Index (IVx value). The IV Index 5-Day Change column provides quick insight into recent expansions or decreases in implied volatility over the last five trading days.
Traders who expect the value of options to decrease might view a decrease in IVX as a positive signal. Strategies such as Strangle and Ratio Spread can benefit from this decrease.
On the other hand, traders anticipating further increases in IVX will focus on the rising IVX values. Strategies like Calendar Spread or Diagonal Spread can take advantage of increasing implied volatility.
This indicator helps traders quickly assess changes in implied volatility, enabling them to make informed decisions based on their trading strategies and market expectations.
🔹 Vertical Pricing Skew
At TanukiTrade, Vertical Pricing Skew refers to the difference in pricing between put and call options with the same expiration date at the same distance (at expected move). We analyze this skew to understand market sentiment. This is the same formula used by TastyTrade for calculations.
We calculate the interpolated strike price based on the expected move , taking into account the neighboring option prices and their distances. This allows us to accurately determine whether the CALL or PUT options are more expensive.
PUT Skew (red): Put options are more expensive than call options, indicating the market expects a downward move (▽). If put options are more expensive by more than 20% at the same expected move distance, we color it lighter red.
CALL Skew (green): Call options are more expensive than put options, indicating the market expects an upward move (△). If call options are priced more than 30% higher at the examined expiration, we color it lighter green.
Vertical Skew on Curve:
The degree of vertical pricing skew for each expiration can be viewed by hovering over the points above the curve. Hover with mouse for more information.
Vertical Skew on IVR panel:
We focus on options with 35-70 days to expiration (DTE) for optimal analysis in case of vertical skew. Hover with mouse for more information.
This approach helps us gauge market expectations accurately, providing insights into potential price movements. Remember, we always evaluate the skew at the expected move using linear interpolation to determine the theoretical pricing of options.
🔹 Delta Skew 🌪️ (Twist)
We have a new metric that examines which monthly expiration indicates a "Delta Skew Twist" where the 16 delta deviates from the monthly STD. This is important because, under normal circumstances, the 16 delta is positioned between the expected move and the standard deviation (STD1) line (see Exp.mv & 1STD exact definitions above). However, if the interpolated 16 delta line exceeds the STD1 line either upwards or downwards, it represents a special case of vertical skew on the option chain.
Normal case : exp.move < delta16 < std1
Delta Skew Twist: exp.move < std1 < delta16
We indicate this with direction-specific colors (red/green) on the delta line. We also color the section of the delta curve affected by the delta skew in this case, even if you choose to display a lower delta, such as 30, instead of 16.
If "Colored Labels with Tooltips" is enabled, we also display a 🌪️ symbol in the tooltip for the expirations affected by Delta Skew.
If you have enabled the display of 'Vertical Pricing Skew' on the IVR Panel, a 🌪️ symbol will also appear next to the value of the vertical skew, and the tooltip will indicate from which expiration Delta Skew is observed.
🔹 Horizontal IVx Skew
In options pricing, it is typically expected that the implied volatility (IVx) increases for options with later expiration dates. This means that options further out in time are generally more expensive. At TanukiTrade, we refer to the phenomenon where this expectation is reversed—when the IVx decreases between two consecutive expirations—as Horizontal Skew or IVx Skew.
Horizontal IVx Skew occurs when: Front Expiry IVx < Back Expiry IVx
This scenario can create opportunities for traders who prefer diagonal or calendar strategies . Based on our experience, we categorize Horizontal Skew into two types:
Weekly Horizontal Skew:
When IVx skew is observed between two consecutive non-monthly expirations, the displayed value is the rounded-up percentage difference. On hover, the approximate location of this skew is also displayed. The precise location can be seen on this indicator.
Monthly Horizontal Skew:
When IVx skew is observed between two consecutive monthly expirations , the displayed value is the rounded-up percentage difference. On hover, the approximate location of this skew is also displayed. The precise location can be seen on our Overlay indicator.
The Monthly Vertical IVx skew is consistently more liquid than the weekly vertical IVx skew. Weekly Horizontal IVx Skew may not carry relevant information for symbols not included in the 'Weeklies & Volume Masters' preset in our Options Screener indicator.
If the options chain follows the normal IVx pattern, no skew value is displayed.
Color codes or tooltip labels above curve:
Gray - No horizontal skew;
Purple - Weekly horizontal skew;
BigBlue - Monthly horizontal skew
The display of monthly and weekly IVx skew can be toggled on or off on the IVR panel. However, if you want to disable the colored tooltips above the curve, this can only be done using the "Colored labels with tooltips" switch.
We indicate this range with colorful information bubbles above the upper STD line.
🔶 The Option Trader’s GRID System: Adaptive MurreyMath + Expiry Lines
At TanukiTrade, we utilize Enhanced MurreyMath and Expiry lines to create a dynamic grid system, unlike the basic built-in vertical grids in TradingView, which provide no insight into specific price levels or option expirations.
These grids are beneficial because they provide a structured layout, making important price levels visible on the chart. The grid automatically resizes as the underlying asset's volatility changes, helping traders identify expected movements for various option expirations.
The Option Trader’s GRID System part of this indicator can be used without limitations for all instruments . There are no type or other restrictions, and it automatically scales to fit every asset. Even if we haven't implemented the option metrics for a particular underlying asset, the GRID system will still function!
🔹 SETUP OF YOUR OPTIONS GRID SYSTEM
You can setup your new grid system in 3 easy steps!
STEP1: Hide default horizontal grid lines in TradingView
Right-click on an empty area of your chart, then select “Settings.” In the Chart settings -> Canvas -> Grid lines section, disable the display of horizontal lines to avoid distraction.
SETUP STEP2: Scaling fix
Right-click on the price scale on the right side, then select "Scale price chart only" to prevent the chart from scaling to the new horizontal lines!
STEP3: Enable Tanuki Options Grid
As a final step, make sure that both the vertical (MurreyMath) and horizontal (Expiry) lines are enabled in the Grid section of our indicator.
You are done, enjoy the new grid system!
🔹 HORIZONTAL: Enhanced MurreyMath Lines
Murrey Math lines are based on the principles observed by William Gann, renowned for his market symmetry forecasts. Gann's techniques, such as Gann Angles, have been adapted by Murrey to make them more accessible to ordinary investors. According to Murrey, markets often correct at specific price levels, and breakouts or returns to these levels can signal good entry points for trades.
At TanukiTrade, we enhance these price levels based on our experience , ensuring a clear display. We acknowledge that while MurreyMath lines aren't infallible predictions, they are useful for identifying likely price movements over a given period (e.g., one month) if the market trend aligns.
Our opinion: MurreyMath lines are not crystal balls (like no other tool). They should be used to identify that if we are trading in the right direction, the price is likely to reach the next unit step within a unit time (e.g. monthly expiration).
One unit step is the distance between Murrey Math lines, such as between the 0/8 and 1/8 lines. This interval helps identify different quadrants and is crucial for recognizing support and resistance levels.
Some option traders use Murrey Math lines to gauge the movement speed of an instrument over a unit time. A quadrant encompasses 4 unit steps.
Key levels, according to TanukiTrade, include:
Of course, the lines can be toggled on or off, and their default color can also be changed.
🔹 VERTICAL: Expiry Lines
The indicator can display monthly and weekly expirations as dashed lines, with customizable colors. Weekly expirations will always appear in a lighter shade compared to monthly expirations.
Monthly Expiry Lines:
You can turn off the lines indicating monthly expirations, or set the direction (past/future/both) and the number of lines to be drawn.
Weekly Expiry Lines:
You can display weekly expirations pointing to the future. You can also turn them off or specify how many weeks ahead the lines should be drawn.
Of course, the lines can be toggled on or off, and their default color can also be changed.
TIP: Hide default vertical grid lines in TradingView
Right-click on an empty area of your chart, then select “Settings.” In the Chart settings -> Canvas -> Grid lines section, disable the display of vertical lines to avoid distraction. Same, like steps above at MurreyMath lines.
🔶 ADDITIONAL IMPORTANT COMMENTS
- U.S. market only:
Since we only deal with liquid option chains: this option indicator only works for the USA options market and do not include future contracts; we have implemented each selected symbol individually.
- Why is there a slight difference between the displayed data and my live brokerage data? There are two reasons for this, and one is beyond our control.
- Brokerage Calculation Differences:
Every brokerage has slight differences in how they calculate metrics like IV and IVx. If you open three windows for TOS, TastyTrade, and IBKR side by side, you will notice that the values are minimally different. We had to choose a standard, so we use the formulas and mathematical models described by TastyTrade when analyzing the options chain and drawing conclusions.
- Option-data update frequency:
According to TradingView's regulations and guidelines, we can update external data a maximum of 5 times per day. We strive to use these updates in the most optimal way:
(1st update) 15 minutes after U.S. market open
(2nd, 3rd, 4th updates) 1.5–3 hours during U.S. market open hours
(5th update) 10 minutes before market close.
You don’t need to refresh your window, our last refreshed data-pack is always automatically applied to your indicator , and you can see the time elapsed since the last update at the bottom of your indicator.
- Skewed Curves:
The delta, expected move, and standard deviation curves also appear relevantly on a daily or intraday timeframe. Data loss is experienced above a daily timeframe: this is a TradingView limitation.
- Weekly illiquid expiries:
Especially for instruments where weekly options are illiquid: the weekly expiration STD1 data is not relevant. In these cases, we recommend checking in the "Display only Monthly labels" checkbox to avoid displaying not relevant weekly options expirations.
-Timeframe Issues:
Our option indicator visualizes relevant data on a daily resolution. If you see strange or incorrect data (e.g., when the options data was last updated), always switch to a daily (1D) timeframe. If you still see strange data, please contact us.
Disclaimer:
Our option indicator uses approximately 15min-3 hour delayed option market snapshot data to calculate the main option metrics. Exact realtime option contract prices are never displayed; only derived metrics and interpolated delta are shown to ensure accurate and consistent visualization. Due to the above, this indicator can only be used for decision support; exclusive decisions cannot be made based on this indicator . We reserve the right to make errors.This indicator is designed for options traders who understand what they are doing. It assumes that they are familiar with options and can make well-informed, independent decisions. We work with public data and are not a data provider; therefore, we do not bear any financial or other liability.
Volume_Surge_Saurabh[VSS]Description:
This is Screener can be used to screen stocks based on the volume surge.
If there is a Buy in a stock with a volume, it will help screen such names from the list of 40 stocks selected.
How does it work.
Script computes Average Volume of previous ’n’ days and Projected volume for the Timeframe.
It compares the both Volumes and if projected is more than average volume the stock by a multiple (called Volume Factor ), then the stock is screened and shown in a table.
Ex: Average Volume is 100, Projected Volume is 310 and Volume Factor of 3.
310>100*3, so stock would be displayed on to the screen with Stock Name, Volume Factor and Price Increase % in that timeframe
User can also include a Price increase Percentage to filter the stocks.
In above example if Price increase selected is of 1% , then stocks with a projected Volume of Volume Factor greater than 3 and price increase of 1%+ will be shown.
User can add a minimum volume of stock traded as well. For this Absolute Volume need to be selected and minimum values need to be provided as input
Ex. if 100k is minimum volume expected then condition would be:
Projected Volume with Volume Factor 3 , Price increase of 1% and Actual volume of 100k or more, then stock will be shown on the screen.
How to use:
The screener works by scanning through up to 40 symbols and list down symbols that are currently having a surge in Volume and Price
2) Projected, Absolute or Both as Volume increase condition
3) Price Increase Percentage condition can be selected
4) Scan upto 40 symbols at a time
5) Custom Timeframe can be used
[blackcat] L5 Dragon-Void-Dragon for Spot TradingLevel: 5
Background
First of all, this L5 technical indicator is only suitable for spot trading. Because its algorithm is only designed for one-way long, and there is no algorithm for short-selling mechanism.
This technical indicator is the main chart indicator of the integrated trend line, channel technology and moving average technology. Trendlines are straight lines connecting at least two significant highs or lows on a price chart, indicating the direction and strength of a trend. Channels are parallel lines that contain price action within a trend, showing the range and potential reversal points.
Function
Trend lines, channel indicators, and moving averages are all very good subjective technical indicators. However, I have found that if one of the three is used mechanically, or a combination of the three often does not achieve good trading results.Therefore, through continuous practice and summary, I implemented some subjective ideas through algorithms, which improved the winning rate after the integration of the three. Buy and sell points are also more accurate.This involves automatic drawing of trend lines and channel indicators. It is conceivable that if you want to draw relatively stable trend lines and channel indicators, you have to wait until the price trend is relatively stable to obtain stable trend lines and channel lines. The advantage of this is that the subsequent price may rely on this inertia to move up and down the trend line or in the channel, which can be the basis for trend reversal. On the other hand, the formation of trendlines and channel indicators requires price movements and time as prerequisites. This means that the process of waiting for the formation of the trend must also sacrifice part of the profit. This is a trade-off between corresponding characteristics and stable characteristics. What we need to do is to find a perfect balance between the two, and expand profits while keeping risks within a controllable range. Ultimately realize big wins and small losses, long-term compound interest accumulation.
The technical elements reflected in this indicator are: channel line, color of trend strength, double moving average. And through the calculation of the background algorithm, some labels for buying and selling are obtained as alarm signals.
Key Signal
Overall this indicator is quite intuitive and does not require a lot of intellect to understand how to use it. It can be summarized as:
1. If the channel is in a warm color and the direction points to the upper right corner, then go long; if the channel is in a cool color and the direction points to the lower right corner, then go short or close the position.
2. The color of the channel is changed from cool to warm. The extreme value of the cool color is dark blue, which means that it is extremely oversold; the extreme value of the warm color is purple, which means that it is extremely overbought; therefore, when you see channels in different directions, you should also pay attention to their colors, which means that the current channel is in the market Where, and if you need to be careful about price reversals.
3. Because this technical indicator is specially developed for spot trading. Therefore, if you want to enter the market, it is generally better to have the color of the channel and the candle be yellow and orange. Otherwise, it is just a rebound, and the price will repeat more later, and it is more necessary to continue to fall.
4. The double moving average system is also specially customized, mainly combined with Zen Theory's Kiss Saying. This double moving average system is a pressure and support system other than the channel. When an uptrend is relayed and continues to rise after a retracement, the Kiss, Wet-Kiss, and Fly-Kiss triggered by the double moving average will generate yellow and orange buy signal labels.
5. This system needs to wait for the price trend to stabilize before generating a buying and selling point, so there are not many buying and selling signals, and of course some entry opportunities will be missed. Of course, this is the result of sacrificing timeliness for transaction stability. So, be flexible. If your trading style is more aggressive, you can only use the buy and sell labels as auxiliary signals.
Remarks
1. It need time to stablize trendlines and channels, so "B"/"S" labels may not be so in time.
2. Closed-source, Invite-only, NOT free.
3. Highl recommended to use this indicator for >= 30min timeframe, which means this is powerful for swing trading.
4. If you are trading crypto, highly recommend use " L3 RS MSFIELD Crypto" indicator as a screener to find target is stronger than Bitcoin.
5. If you are trading CN A Share, highly recommend use " L3 RS MSFIELD CN A Share" indicator as a screener to find target is stronger than SSE Index.
Subscription
L4/L5 are not free indicators. Trail permissions can be given. Monthly and annual subscriptions are acceptable.

Intraday Direction Finder For Indices (Based On VWAP) Happy Independence Day..!!
------------------------------------------------------------------------
This indicator is based on the concept shared by "learntotrade365" to Find Intraday Direction for Index.
To decide the direction of Index we check whether the constituent Stocks are trading above VWAP or below VWAP.
Lets Consider Banknifty Example.
Banknifty Constituents are:
HDFC Bank
ICICI Bank
KOTAK Bank
SBI
AXIS Bank
IndusInd Bank
Based on concept, where above stocks are trading decides the direction as follows
Ratio Concept (Color)
6:0 Super Bullish (Lime)
5:1 Bullish(Green)
4:2 Mild Bullish (Aqua)
3:3 Sideways(Blue)
2:4 Mild Bearish ( Orange)
1:5 Bearish (Fuchsia)
0:6 Super Bearish (Red)
-------------------------------------------------------------------------
Features :-
1) Screener
In this Screener, we can clearly see which stock is trading above VWAP
& which is trading below VWAP along with ratio.
2) Chart Candle Colors
One can able to project candle colors according to Ratio colors.
3)Chart Background Color
One can set background color of chart if he is required.
------------------------------------------------------------------------
Same this can be used with other indices also like Nifty, Finnifty etc.
-------------------------------------------------------------------------
Thanks For Reading Till here...!!
------------------------------------------------------------------------
Kindly share your feedback or any suggestions.
------------------------------------------------------------------------

TDMACD Divergence Multi Timeframe and Alert [5ema]I reused some functions, made by (i believe that):
@paaax: The table position function.
@everget: The RSI divergence function.
@QuantNomad: The function calculated value and array to show on table for input symbols.
@ChaosTrader: The function calculated value TDMACD.
-----
What to do?
MACD divergence signal.
The crossing of MACD and Signal line.
The reversal of MACD.
The reversal of Signal line.
The screener follow 6 different timeframes.
Set notification alert when signal appears.
-----
How is it created?
MACD line = fastMA - slowMA.
Signal line = ta.ema(macd(), signalLength)
Make function for pivot low & high point of MACD and price.
Request.security that function for earch time frame.
-----
How to use?
Can be combined with many other indicators or candlestick patterns.
Customize the input indicators to suit your strategy
1. MACD reversed:
2. Signal line reversed:
3. MACD Divergence :
4. MACD crossing Signal line:
5. Signal on Screener for multi time frame:
Green ⦿: Buy.
Red ⦿: Sell.
Green 〇: Review Buy.
Red 〇: Review Sell.
-----
This indicator is for reference only, you need your own method and strategy.
If you have any questions, please let me know in the comments.

Cloud Bunching [5ema]Reused some functions from (i believe made by):
©paaax: The table position function.
@QuantNomad: The function calculated value and array screener for 40+ instruments .
How it uses:
Gives signal when the cloud is bunching with ratio smaller than the set ratio and the close price breaking out the cloud.
Track 40 different symbols, on any timeframe to follow and alert.
When a symbol has a signal, it will display on the chart and send an alert.
How it works:
The cloud created by 5 EMA (20, 50, 200, 460, 610). Upper Cloud is max EMA , Lower Cloud is min EMA . Center line is averange (5 EMA )
If the ratio upper / lower < input bunching (%) -> change color of cloud.
Get the signal if: the close price break out cloud (with bar is shooting, or hammer ,...) and high volume (or not).
With another symbols (max 40 ) also use that function with any time frame. By request.security() and array function.
How it setting:
Change the bunching rate (%) of the clouds for any symbols.
Change the percentage (%) of the close price that breaks out of the bunching cloud.
Choose volume condition.
Show or turn off the cloud, table.
Select the symbol to follow.
Choose a timeframe to follow other symbols.
----
This indicator is for reference only, you need your own method and strategy.
If you have any questions, please let me know in the comments.

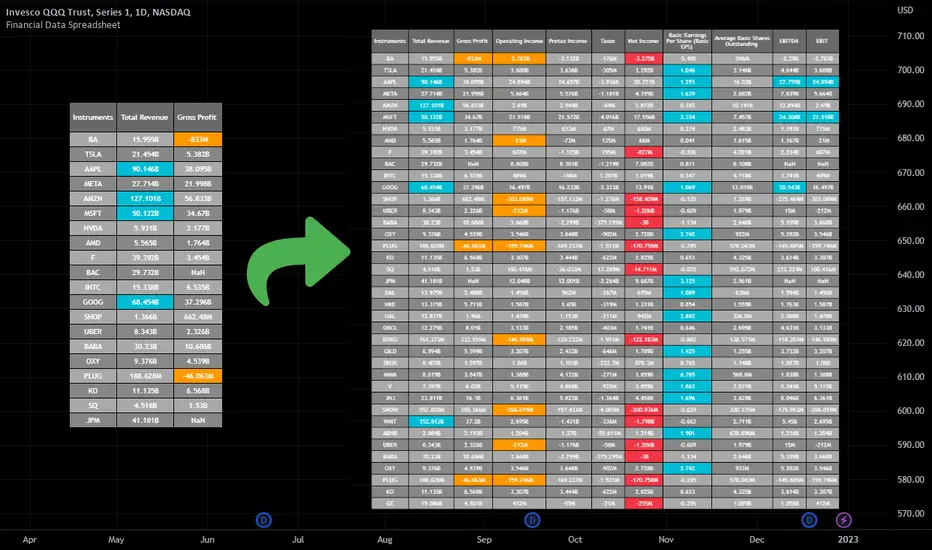
Financial Data Spreadsheet [By MUQWISHI]The Financial Data Spreadsheet indicator displays tables in the form of a spreadsheet containing a set of selected financial performances of a company within the most recent reported period. Analyzing Financial data is one of the classic methods to evaluate whether the company’s stock price is overvalued or undervalued based on its income statement, balance sheet, and cash flow statement. This indicator might be practical to investors to collect needed data of a company to analyze and compare it with other companies on a TradingView chart or print it in spreadsheet form.
█ OVERVIEW
█ BEST PRACTICES
Due to strict limitations on calling request.financial() function, I tried to develop the table with the best ways to be more dynamic to move and the ability to join multiple tables into a spreadsheet. Users can add up to 20 instruments and 2 financial metrics per table. However, it’s possible to add many tables with other financial metrics, then connect them to the main table.
Credits: The idea of joining multiple tables inspired by @QuantNomad Screener for 40+ instruments
█ INDICATOR SETTINGS
1- Moving Table toward right-left up-down from its origin.
2- Hiding Column Title checkmark. Useful for adding a joined table underneath with additional instruments.
3- Hiding Instruments Title checkmark. Useful for adding a joined table on the right with other financial metrics.
4- Shade Alternate Rows checkmark. I believe it’ll make the table easier to read.
5- Selecting Financial Period. (Year, Quarter).
6- Entering a currency.
7- Choosing a financial ID for each column. There’re over 200 financial IDs. Source: What financial data is available in Pine? — TradingView
8- Optional to highlight values in between.
9- Entering the ticker’s symbol with the ability to activate/deactivate.
█ TIP
For best technical performance, use the indicator in a 1D timeframe.
Please let me know if you have any questions.
Thank you.
[co.n.g.] ADR 5/10/14/20Average Daily Range (ADR) over 5/10/14/20 Days
What it is
One of the oldest measurements of price volatility that is being used in technical and statistical trading is the range of a specific period of past days to estimate probability of chances, risk and price movements, as seen f.e. in
Molodovsky, N. (1967). Building a Stock Market Measure—A Case Study. Financial Analysts Journal, 23:3, 43-46 , DOI: 10.2469/faj.v23.n3.43.
Problem
After having tried all available community scripts I've encountered various indifferences, especially since Pine v5.
First, the anchor period changed, when I've switched between regular and extended trading hours.
- This meant, that the anchor switched between the official open of the day and the first bar of a new day beginnig at 00:00 UTC (or the corresponding timezone).
Second, thus in some scripts also changed the calculated average range, including or excluding pre market and after hours.
And therefor third, in many cases the distance between open and ADR high/low was indiffferent, putting one closer and the other further away.
Why is that?
After having tried seven different modes of calulation - from ta. to array, it appeared that especially since Pine v5 the calulation is lagging when calling
the request.security function and is thus rendering the calculations indifferent.
Especially the open is lagging and plotting delayed, about 15 minutes on a M1-chart or about 45 minutes on a M15 chart, which made id difficult to spot open (test) drives
- as f.e. described in Dalton, J. F., Jones, E. T., & Dalton, R. B. (1990). Mind over markets: power trading with market generated information. 1st edition . Probus. -
and estimating extremely strong or weak open moves.
While switching between regular and extended intraday charts, the open was either calculated on the open as request of "D" (open of the regular session)
and "1440" (which means full intraday since 00:00 UTC or the corresponding timezone), leading to undesired anchoring.
After having tried about five different anchoring periods and comparing the adr to @TradingView 's stock screener, there was no proper calulation or plotting possible,
if not partially hardcoded (being the least desired, elegant or flexible method).
Visualizing the problem
As described in the picture:
@sherwind 's ADR is plotting entirely wrong! I couldn't even figure out (even the source is available) whre the problem is rooted.
@treypeng 's ADR is anchored properly, but unfortunately the calculation is wrong.
Originality
As evident in the attached picture - and you are able to compare this to @TradingView 's stock screener - in this script as well the ADR is calculated PROPERLY
as well as the anchoring is set PROPERLY within the first tick of the session.
As matter of fact, you don't have to examine different timeframes, charts or sessions simoultaneously to see the correct levels and
you're able to ease observations and focus on your trading.
Innovation
There is no innovative approach, as described above, simply because this statistical approach is around since the 1960's.
Considering coding, neither is, but it is properly calculated and anchored.
What this script does
Anchoring at the first tick of the new New York session
Plotting the actual - not the past nor future - average day range (gray lines in picture)
Plotting the actual - not the past nor future - 75% average day range ( silver lines in picture)
Vizualising ADR breakouts by colouring the backround green (long breakout) or read (short breakout)
Selection methods
Keeping it simple stupid, as of now:
Abiliy to chose between 5/10/14/20 days
Additional
Theory says, that we are staying within the ADR of 75% every day.
_
Alas, there are some exceptions.
If price is breaking out of the ADR, we are likely to move in this direction for the rest of the day.
If price has broken out of the ADR on the previous day, ist highly unlikely to expect another ADR breakout day,
which doesn't mean that there might not appear a strong or weak second day.
Notes
Designed for intraday stock trading of the U.S. market.
Best (and easiest) chances are to be spotted in special conditions.
//Cheers,
//Constantine

Crypto-DX Crypto Directional Index [chhslai]Crypto-DX can be used to help measure the overall strength and direction of the crypto market trend.
Furthermore, it can be used as a screener to find out cryptocurrencies which are accumulating momentum and tends to potentially pump or dump.
How this indicator works :
If the Crypto-DX cross above the zero-level, it could be an indication that there is a trend reversal into upward. You should close your short position or place a long order right away.
If the Crypto-DX cross below the zero-level, it could be an indication that there is a trend reversal into downward. You should close your long position or place a short order right away.
If the Crypto-DX is consolidated around the zero-level, it could be an indication that the trend may be ended and followed by a sideway market. You are suggested not to place any order and wait for the market moves.
Divergence based trading strategy is fully applicable, just like the MACD.
Screener features :
Plot "Crypto Index" and "5 Custom Crypto"
Plot "Crypto Index" and "Top 30 Crypto"

AC- MY SCRIPT1My Ac- My Scrpt1 that the BUY and SELL signals (trend reversals) for many coins defined different tickers in Tradingview charts
Terminology explanation:
Confirmed Reversal: Oxford T reversal that happened in the last bar and cannot be repainted.
Potential Reversal: Oxford T reversal that might happen in the current bar but can also not happen depending upon the timeframe closing price.
Downtrend: Tickers that are currently in the sell zone
Uptrend: Tickers that are currently in the buy zone
List and show has also got a built in Oxford T indicator which users can confirm the reversals on graphs.
Screener explores the 40 tickers in current graph's time frame and also in desired parameters of the OTT indicator.
Also you can optimize the parameters manually with the built in STRATEGY version.
Built in Moving Average type defaultly set as VAR but users can choose from 8 different Moving Average types like:
SMA : Simple Moving Average
EMA : Exponential Movin Average
WMA : Weighted Moving Average
TMA : Triangular Moving Average
VAR : Variable Index Dynamic Moving Average aka VIDYA
WWMA : Welles Wilder's Moving Average
ZLEMA : Zero Lag Exponential Moving Average
TSF : True Strength Force
Tip: In sideways VAR would be a good choice
You can use OxforfT default alarms and Buy Sell signals like:
1-
BUY when Prices are above OxfordT
SELL when Prices are below OxfordT
2-
BUY when OxfordT support Line crosses over OoxfordT line.
SELL when OxfordT support Line crosses under OxfordT line.
3-
BUY when OxfordT line is Green and makes higher highs.
SELL when OxfordT line is Red and makes lower lows.
IMPORTANT: SCREENER ONLY EXPLORES AND SCREENS FOR THE 2nd SIGNAL TYPE:
BUY when OxfordT support Line crosses over OxfordT line.
SELL when OxfordT support Line crosses under OxfordT line.
[JL] How Many Signals last N barsGot this idea after I found Multiple Indicators Screener from QuantNomad.
This script learnt some codes from QuantNomad's great script. Thanks to him.
------------------------------------------------------------------------------------------------------------------------------------------------------------------------
This table show how many signals happened during the last N bars.
I only take care Forex, so this table only has 28 symbols. Feel free to change it.
Calculate the following signals:
RSI cross over/under 50
Short Moving average cross over/under long moving average
Stochastic k cross over/under d
MACD hist cross over/under 0
Williams Fractals: Up and Down fractals happened.
The concept is simple: Range period will always happen more cross signals than the trend period.
When the counter is less than median of all symbols, will be set green color. So more green mean more chance to be trend.

RSI Moving Average CrossoversThis script is an improved version of the RSI indicator, using a moving average on the RSI itself, as well as two other moving averages used to determine the current trend.
A small screener indicating the current movement is displayed in the bottom-left zone of the chart: trend (Bullish/Bearish/Uncertain) and status (Impulse or Correction)
Trends are simply based on moving averages crossovers, coupled to the fact that the current candle closes above the fast MA in a bull trend, and under the fast MA in a bear trend. In other cases, the trend and the movement are considered as "Uncertain" by the indicator.
Options
Various types of moving averages for the RSI and trend MA
Show/Hide crossovers between the RSI and its MA
Color the RSI normal zone with the current trend/movement colors
Show/Hide the screener indicating the current movement
Defaults Parameters
Fast MA 20
Slow MA 50
MA source: Close
RSI Length 14
RSI MA: SMMA (RMA)
RSI MA Length: 20
Don't hesitate to suggest any idea which could improve this indicator.
BEST Algo HeatmapHello traders
How to access?
Offered to all the current customers
To be used alongside the BTI Algo Global script.
Heatmap
This heatmap screens the BTI Algo Global signals across different timeframes.
The screened timeframes are for now: m1/m2/m5/m15/m30/H1/H2/H4/H8/Daily
The trends are based on the triangle primary signals
Limitations
- I could only access the last 20K loaded candles, then you might see a blank case for the screened high timeframes when you're loading the screener on a low timeframe chart.
Example: a 1-minute chart with the screener might struggle sometimes to display the 4H/8H/Daily data
- What to do then?
I found a hack.
Just load the chart on a much higher timeframe and you should be able to see the latest timeframes from the heatmap
If any questions, please let me know
Dave
[Hud] Signal 4HIDEAS :
- Original idea from @BURSATRENDBANDCHART
- Basically, it is an intraday technique to find potential stock with the intention to get 2- 4 bids profit ( FIFO )
STEP :
1. Must use 4 Hour Timeframe ( 4H )
2. Find entry based on percentage price increase compared to previous candle ( yesteday close price )
3. If the afternoon closing price is 5% > than yesterday close price ( default setting, and can be adjusted ), then indicator will show "Signal Pagi" label
4. Use Tradingview Screener to select the stocks when market breaks in the afternoon.
5. Add alert to selected counter ( using TV screener ) using 4H indicator and wait for BUY signal.
TAKE PROFIT ( TP )
- Target to TP after 2-4 bids profit
- sell at the end of day or early next morning
- Trade At Your Own Risk
CUT LOSS
- When it break closing price of previous candle or
- Red Dot = 50% of previous candle
NOTE :
- You need to have real-time data to use this indicator.

TS - Trading AlgorithmWhat is it?
The Tradespot MA Algo is an all in one, profitable moving average based trading strategy that presents long and short opportunities.
This indicator does not repaint. Once a bar has closed, the signal will remain permanently printed onto the chart.
What can I do with it?
Use on the following markets:
COINBASE:BTCUSD
COINBASE:ETHUSD
COINBASE:ETHBTC
Timeframe: 1D
What does each signal mean?
Long label is a strong buy signal
Short label is a strong sell signal
X's indicate a warning telling you that you should possibly exit your position. You should review these signals alongside other indicators such as volatility.
Review X signals?
Yes, there are concrete buys and sells but the X's indicate possible exits that might also be fakeouts, we can created the perfect indicator set up to review these with our TS - Trend Confirmation indicator and our TS - Volatility Screener indicator
How do I get access?
Please contact me on TradingView for details.
[Daveatt] BEST ABCD Pattern Strategy (Trailing SL + TP)Hello traders
This is the strategy version of my ABCD pattern. I added the Trailing Stop and Trailing Profit upon a follower request
I - Concept
I present to you, ladies and gentlemen, the first screener for harmonic patterns .
Starting with an ACBD pattern screener this time!!
I used the calculations from Ricardo Santo's script
In short, he's using fractals (regular or Bill Williams ) for the pattern calculations. A masterpiece !!!
II - Definitions
The ABCD pattern ( AB=CD ) is one of the classic chart patterns which is repeated over and over again.
The ABCD pattern shows perfect harmony between price and time.
The Williams Fractal is an indicator, developed by Bill Williams , that aims to detect reversal points (highs and lows) and marks them with arrows.
Up fractals and down fractals have specific shapes. The Williams Fractal indicator helps users determine in which direction price will develop
💎Strategy filters💎
I included some cool backtest filters:
- Trailing stop with trigger concept coming from this Trailing Stop Strategy
- Trailing profit with trigger coming from this Trailing Profit Strategy
Last words
It works for all asset classes (Forex, crypto, indices, etc...) and does not repaint
All the BEST
Dave
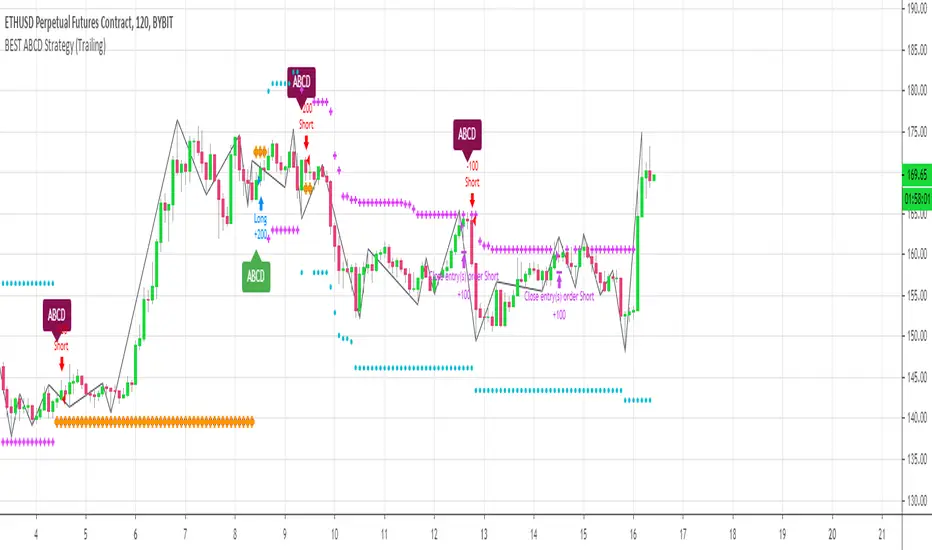
Rainbow Force - Multi Timeframe [WYCKOFF ARSENAL]🌈 Rainbow Force - Multi Timeframe WYCKOFF ARSENAL
The purpose of the Force is to provide an indication of the pressure being applied to push the market lower or the pull being applied to the market to pull it higher.
The Rainbow Force can be used on any available timeframes and assets with volume data .
It is a combination of Force instances of different lengths that are plotted on the same chart.
The confluence zones can hint at a price reversal and help estimate the trend strength.
The Rainbow Force can be combined with other technical analysis tools as a trend-following indicator.
When the trend is strong and the other indicators used to determine entry points send a bullish or a bearish signal, a position can be opened.
When the trend is weak, opening new positions should not be to consider.
The Rainbow Force can also be used on its own. The angles of the Rainbow will hint at the trend strength.
The steeper the curve, the stronger the trend. The flatter the curve, the weaker the trend.
A Buy position can be opened in the beginning of a strong positive trend .
A Sell position can be opened in the beginning of a strong negative trend .
During a strong trend, short-lived retracements can be found, and it is possible to enter a position in the direction of the general trend against the retracement.
The Rainbow mode can be experienced with the Multi RSI indicator as well.
Related tools :
▪ Optimism Pessimism
▪ Force
- 🌈 Rainbow Force ◄
▪ Technometer
- 🌈 Rainbow Technometer
▪ Momentum
- 🌈 Rainbow Momentum
▪ Market Screener
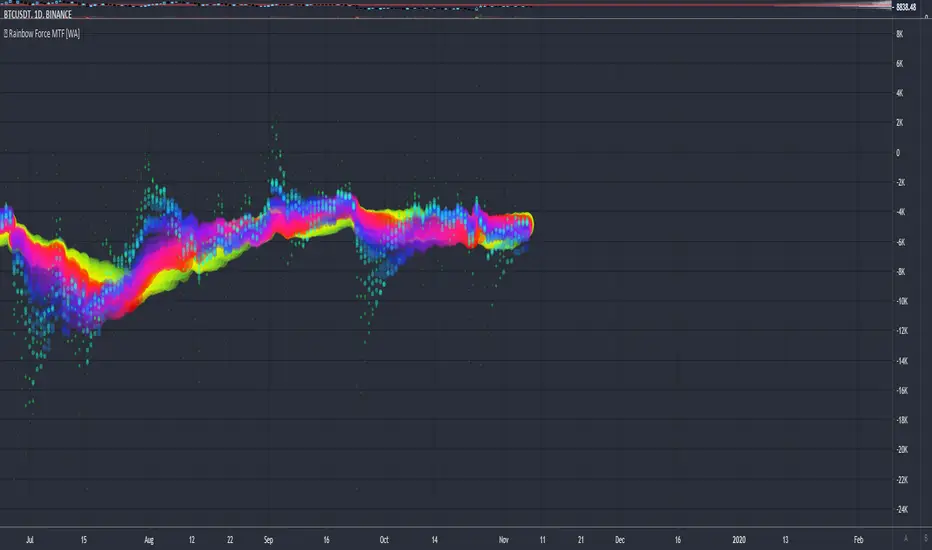
Rainbow Technometer - Multi Timeframe [WYCKOFF ARSENAL]🌈 Rainbow Technometer - Multi Timeframe WYCKOFF ARSENAL
The purpose of the Technometer is to provide a mathematical indication of the degree to which the market is overbought or oversold .
The value of the Technometer could be as high as 100 or as low as 0. The other possible values would represent degrees of overbought or oversold.
In Rainbow form, the Technometer could also be used as a trend-following indicator.
The Rainbow Technometer can be used on any available timeframes and assets with volume data .
It is a combination of Technometer instances of different lengths that are plotted on the same chart.
The confluence zones can hint at a price reversal and help estimate the trend strength.
The Rainbow Technometer can be combined with other technical analysis tools as a trend-following indicator.
When the trend is strong and the other indicators used to determine entry points send a bullish or a bearish signal, a position can be opened.
When the trend is weak, opening new positions should not be to consider.
The Rainbow Technometer can also be used on its own. The angles of the Rainbow will hint at the trend strength.
The steeper the curve, the stronger the trend. The flatter the curve, the weaker the trend.
A Buy position can be opened in the beginning of a strong positive trend .
A Sell position can be opened in the beginning of a strong negative trend .
During a strong trend, short-lived retracements can be found, and it is possible to enter a position in the direction of the general trend against the retracement.
The Rainbow mode can be experienced with the Multi RSI indicator as well.
Related tools :
▪ Optimism Pessimism
▪ Force
- 🌈 Rainbow Force
▪ Technometer
- 🌈 Rainbow Technometer ◄
▪ Momentum
- 🌈 Rainbow Momentum
▪ Market Screener
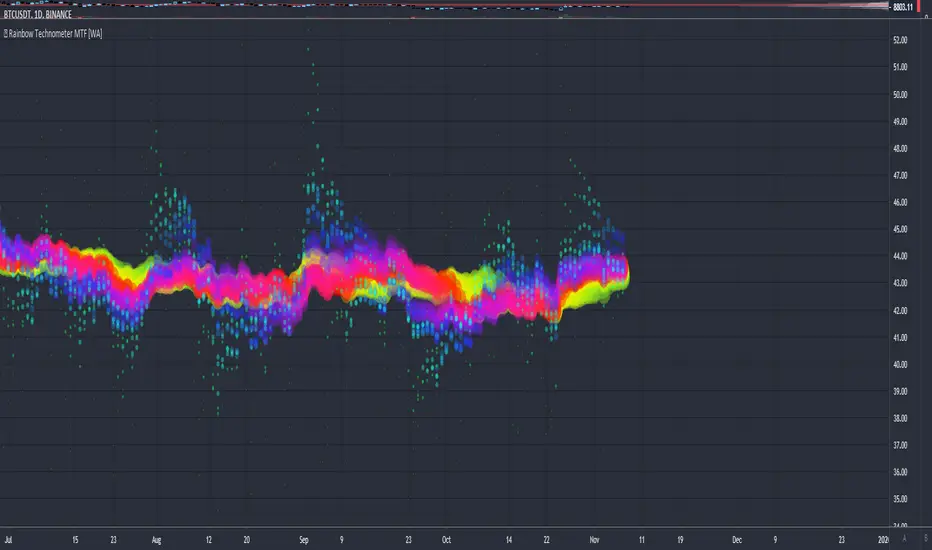
Rainbow Momentum - Multi Timeframe [WYCKOFF ARSENAL]🌈 Rainbow Momentum - Multi Timeframe WYCKOFF ARSENAL
The purpose of the Momentum is to provide a measure of the speculative interest in the market.
In Rainbow form, the Momentum could also be used as a trend-following indicator.
The Rainbow Momentum can be used on any available timeframes and assets with volume data .
It is a combination of Momentum instances of different lengths that are plotted on the same chart.
The confluence zones can hint at a price reversal and help estimate the trend strength.
The Rainbow Momentum can be combined with other technical analysis tools as a trend-following indicator.
When the trend is strong and the other indicators used to determine entry points send a bullish or a bearish signal, a position can be opened.
When the trend is weak, opening new positions should not be to consider.
The Rainbow Momentum can also be used on its own. The angles of the Rainbow will hint at the trend strength.
The steeper the curve, the stronger the trend. The flatter the curve, the weaker the trend.
A Buy position can be opened in the beginning of a strong positive trend .
A Sell position can be opened in the beginning of a strong negative trend .
During a strong trend, short-lived retracements can be found, and it is possible to enter a position in the direction of the general trend against the retracement.
The Rainbow mode can be experienced with the Multi RSI indicator as well.
Related tools :
▪ Optimism Pessimism
▪ Force
- 🌈 Rainbow Force
▪ Technometer
- 🌈 Rainbow Technometer
▪ Momentum
- 🌈 Rainbow Momentum ◄
▪ Market Screener

Top 20 Adaptive Momentum [Trend Aligned]his script is an automated End-of-Day Momentum Dashboard designed to predict the next trading day's directional bias for the top 20 most volatile stocks. It analyzes institutional price action during the final 10 minutes of the trading session and filters signals based on the long-term trend.
How It Works
Trend Identification: The script calculates a 50-Day Moving Average proxy (using 5-minute data) to determine if a stock is in a Long-Term Uptrend or Downtrend.
Adaptive Signal Logic: Instead of a simple reversal strategy, the script adapts its prediction based on the trend context:
Trend Following: If a stock closes strong (Green) in an Uptrend, it signals Bullish Momentum (continuation).
Mean Reversion: If a stock closes strong (Green) in a Downtrend, it signals Bearish Reversion (fade the bounce).
Dip Buying: If a stock closes weak (Red) in an Uptrend, it signals Bullish Reversion (buy the dip).
Live Backtesting: The dashboard features a "Win Rate (3M)" column. This metric backtests the strategy over the past 3 months for each specific ticker, calculating the percentage of time the predicted bias resulted in a winning trade the following day.
Dashboard Columns
Ticker: The stock symbol.
Prev Day: The overall close vs. open of the previous session.
Trend (50d): The long-term trend direction (UP or DOWN).
BIAS TODAY: The actionable signal for the current session (📈 BULLISH or 📉 BEARISH).
Win Rate: The historical probability of success for this strategy on this specific stock.
Usage: Use this tool pre-market to identify high-probability setups where the previous day's closing momentum aligns with the long-term trend.
To effectively use the Top 20 Adaptive Momentum script, you need to treat it as a Pre-Market Screener. It performs the heavy lifting of analyzing trend, momentum, and historical probability instantly, giving you a "Cheat Sheet" for the trading day.
Here is a step-by-step guide on how to integrate it into your routine:
1. The Setup
Timeframe: Set your chart to 5 Minutes. The logic specifically hunts for the 15:50 (3:50 PM) and 15:55 (3:55 PM) candles, so the calculation works best on this timeframe.
Timing: Check this dashboard before the market opens (e.g., 9:00 AM EST) or shortly after the close (4:05 PM EST) to plan for the next session.
2. Reading the Dashboard Columns
Column What to Look For Actionable Insight
Trend (50d) UP (Green) or DOWN (Red) This tells you the "Big Picture." Only trade in this direction. If Trend is UP, you only want to see Bullish signals. If Trend is DOWN, you only want Bearish signals.
BIAS TODAY 📈 BULLISH Plan: Look for Long/Buy setups at the open. The algorithm predicts price will close higher today.
📉 BEARISH Plan: Look for Short/Sell setups at the open. The algorithm predicts price will close lower.
Win Rate (3M) Percentage (e.g., 65%) Confidence Filter. Only take trades on stocks with a Win Rate above 55-60%. This proves the stock historically respects this specific strategy.
3. The Strategy Scenarios (How to Trade)
Scenario A: The "Trend Continuation" (High Probability)
Dashboard: Trend is UP + Bias is BULLISH.
Context: The stock is strong long-term, and it closed strong yesterday (Momentum).
Execution: Watch for an opening gap up or an early breakout above the pre-market high. Go Long.
Scenario B: The "Dip Buy" (High Probability)
Dashboard: Trend is UP + Bias is BULLISH.
Context: The stock is strong long-term, but it pulled back yesterday (Weak Close). The script identifies this as a discount, not a reversal.
Execution: Watch for the stock to find support early. Use the "Master Sniper" (from your other script) to find a Discount Entry FVG.
Scenario C: The "Trap" (Avoid)
Dashboard: Win Rate is < 50%.
Context: The stock is choppy or news-driven. It does not follow technical momentum rules reliably.
Execution: Skip this stock. Move to the next one on the list.
4. Execution Workflow
Scan: Glance at the dashboard. Identify the 2-3 stocks with Green Bias + Green Trend (for Buys) or Red Bias + Red Trend (for Shorts).
Filter: Ensure their "Win Rate" is decent (over 55%).
Trade: Open the charts for those specific stocks. Use your execution indicators (like the Master Sniper) to time the entry on the 1-minute or 5-minute chart.
By using this dashboard, you stop guessing which stock to trade and focus entirely on executing the best setups.
