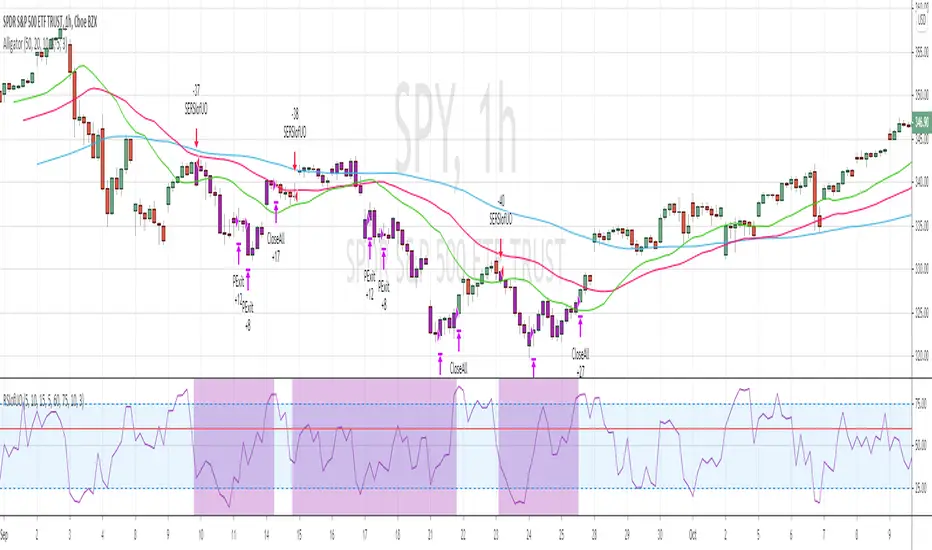
RSI of Ultimate Oscillator [SHORT Selling] StrategyThis is SHORT selling strategy with Ultimate Oscillator. Instead of drectly using the UO oscillator , I have used RSI on UO (as I did in my previous strategies )
Ultimator Oscillator settings are 5, 10 and 15
RSI of UO setting is 5
Short Sell
==========
I have used moving averages from WilliamAlligator indicator --- settings are 10(Lips), 20(teeth) and 50 (Jaw)
when Lips , Teeth and Jaw are aligned to downtrend (that means Lips < Teeth < Jaw )
Look for RSIofUO dropping below 60 ( setting parameter is Sell Line )
Partial Exit
==========
When RSIofUO crossing up Oversold line i.e 30
Cover Short / Exit
=================
When RSIofUO crosisng above overbought line i.e 70
StopLoss
========
StopLoss defaulted to 3 % , Though it is mentioned in settings , it has not been not used to calcuate and StopLoss Exit... Reason is, when RSIofUO already crossed 60 line (for SHORTING) , then it would take more efforts go up beynd 60. There is saying price takes stairs to climb up but it takes elevator to go down. I have not purely depend on this to exit stop loss, however noticed the trades in this stratgey did not get out with loss higher than when RSIofUO reaching 70 level.
Note
======
Williams Alligator is not drawn from the script. It is manually added to chart for illustration purpose. Please add it when you are using this strategy , whch woould give an idea how the strategy is taking Short Trades.
This is tested on Hourly chart for SPY
Bar color changes to purple when the strategy is in SHORT trade
Warning
========
For the eductional purposes only
Cari skrip untuk "oscillator"
Varadi OscillatorThe Varadi Oscillator (VDO) is a leading indicator first proposed by David Varadi and originally aim to reduce the influence of the trend component in oscillators. The DVO can be described as a rolling percent rank of detrended prices over a certain lookback period. The detrending process used for the calculation of the indicator is based on the simple moving average of the ratio between the closing price and median (hl2) price.
Both the length of the percent rank and the moving average used for detrending can be adjusted by the user. We can see that the VDO can lead price movements.
Don't have time to post anything else, if the indicator is too simple, moderators can feel free to remove it and ban me for some time, won't complain.

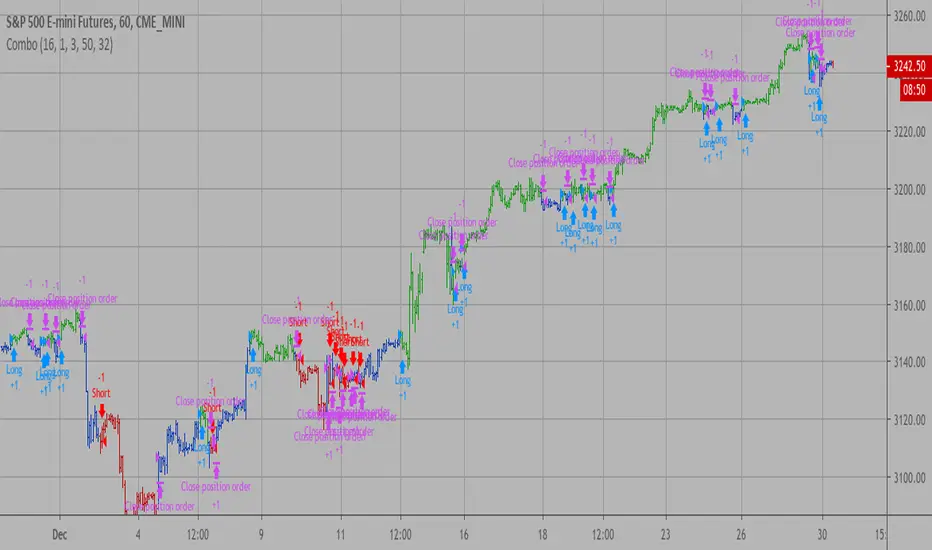
Combo Backtest 123 Detrended Price Oscillator This is combo strategies for get a cumulative signal.
First strategy
This System was created from the Book "How I Tripled My Money In The
Futures Market" by Ulf Jensen, Page 183. This is reverse type of strategies.
The strategy buys at market, if close price is higher than the previous close
during 2 days and the meaning of 9-days Stochastic Slow Oscillator is lower than 50.
The strategy sells at market, if close price is lower than the previous close price
during 2 days and the meaning of 9-days Stochastic Fast Oscillator is higher than 50.
Second strategy
The Detrend Price Osc indicator is similar to a moving average,
in that it filters out trends in prices to more easily identify
cycles. The indicator is an attempt to define cycles in a trend
by drawing a moving average as a horizontal straight line and
placing prices along the line according to their relation to a
moving average. It provides a means of identifying underlying
cycles not apparent when the moving average is viewed within a
price chart. Cycles of a longer duration than the Length (number
of bars used to calculate the Detrend Price Osc) are effectively
filtered or removed by the oscillator.
WARNING:
- For purpose educate only
- This script to change bars colors.
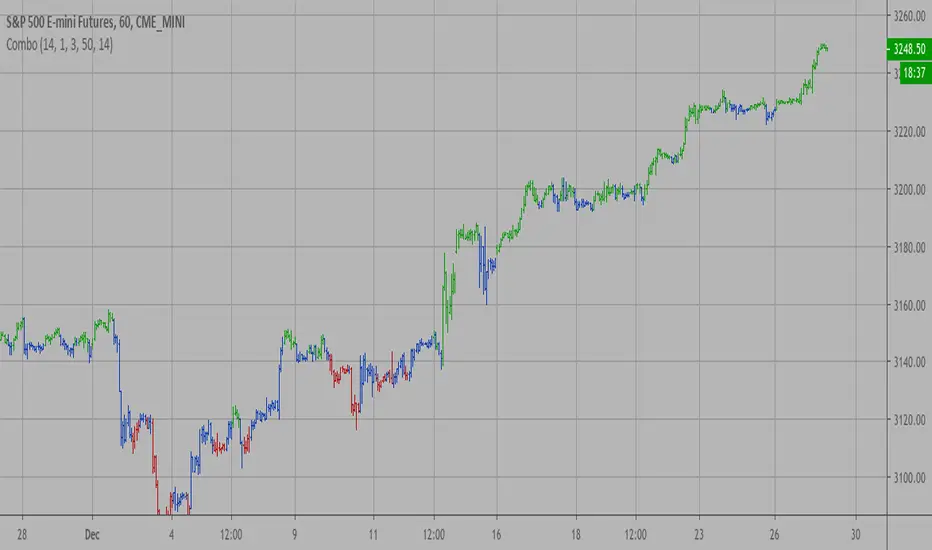
Combo Strategy 123 Detrended Price Oscillator This is combo strategies for get a cumulative signal.
First strategy
This System was created from the Book "How I Tripled My Money In The
Futures Market" by Ulf Jensen, Page 183. This is reverse type of strategies.
The strategy buys at market, if close price is higher than the previous close
during 2 days and the meaning of 9-days Stochastic Slow Oscillator is lower than 50.
The strategy sells at market, if close price is lower than the previous close price
during 2 days and the meaning of 9-days Stochastic Fast Oscillator is higher than 50.
Second strategy
The Detrend Price Osc indicator is similar to a moving average,
in that it filters out trends in prices to more easily identify
cycles. The indicator is an attempt to define cycles in a trend
by drawing a moving average as a horizontal straight line and
placing prices along the line according to their relation to a
moving average. It provides a means of identifying underlying
cycles not apparent when the moving average is viewed within a
price chart. Cycles of a longer duration than the Length (number
of bars used to calculate the Detrend Price Osc) are effectively
filtered or removed by the oscillator.
WARNING:
- For purpose educate only
- This script to change bars colors.
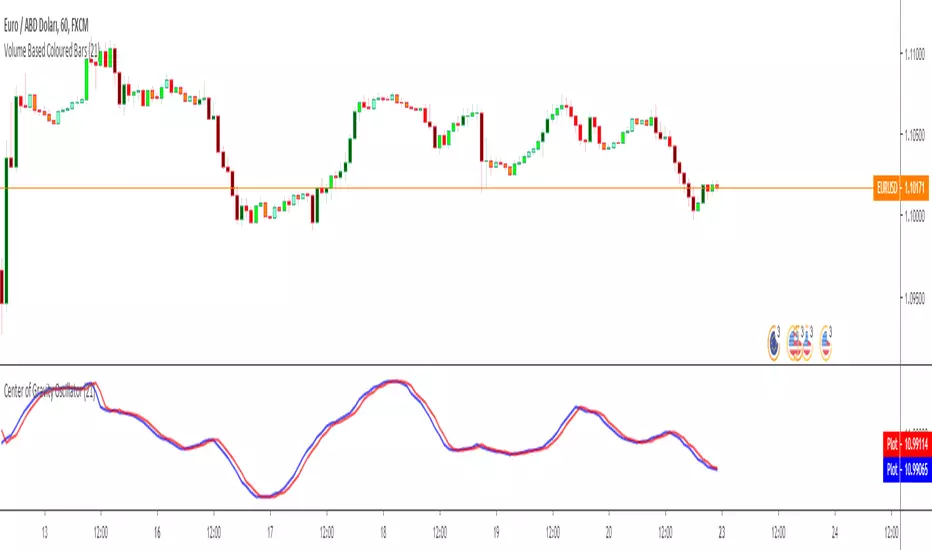
Center of Gravity Oscillator - Ehlers by KIVANC fr3762Center of Gravity OSCILLATOR by JOHN EHLERS
Converted the original code from his book "Cybernetic Analysis for Stocks and Futures"
This article describes a new oscillator that is unique because it is both smoothed
and has essentially zero lag. The smoothing enables clear identification of turning
points and the zero lag aspect enables action to be taken early in the move. This
oscillator is the serendipitous result of my research into adaptive filters. While the filters
have not yet produced the result I seek, this oscillator has substantial advantages over
conventional oscillators used in technical analysis . The “CG” in the name of the
oscillator stands for the Center of Gravity of the prices over the window of observation.
The Center of Gravity ( CG ) of a physical object is its balance point. For example,
if you balance a 12 inch ruler on your finger, the CG will be at its 6 inch point. If you
change the weight distribution of the ruler by putting a paper clip on one end, then the
balance point (e.g. the CG ) shifts toward the paper clip. Moving from the physical world
to the trading world, we can substitute the prices over our window of observation for the
units of weight along the ruler. With this analogy, we see that the CG of the window
moves to the right when prices increase sharply. Correspondingly, the CG of the
window moves to the left when prices decrease.
For further information:
www.mesasoftware.com
Here's the link to a complete list of all my indicators:
t.co
Şimdiye kadar paylaştığım indikatörlerin tam listesi için: t.co
Combo Strategy 123 Reversal & Chande Momentum OscillatorThis is combo strategies for get a cumulative signal.
First strategy
This System was created from the Book "How I Tripled My Money In The
Futures Market" by Ulf Jensen, Page 183. This is reverse type of strategies.
The strategy buys at market, if close price is higher than the previous close
during 2 days and the meaning of 9-days Stochastic Slow Oscillator is lower than 50.
The strategy sells at market, if close price is lower than the previous close price
during 2 days and the meaning of 9-days Stochastic Fast Oscillator is higher than 50.
Second strategy
This indicator plots Chande Momentum Oscillator. This indicator was
developed by Tushar Chande. A scientist, an inventor, and a respected
trading system developer, Mr. Chande developed the CMO to capture what
he calls "pure momentum". For more definitive information on the CMO and
other indicators we recommend the book The New Technical Trader by Tushar
Chande and Stanley Kroll.
The CMO is closely related to, yet unique from, other momentum oriented
indicators such as Relative Strength Index, Stochastic, Rate-of-Change,
etc. It is most closely related to Welles Wilder`s RSI, yet it differs
in several ways:
- It uses data for both up days and down days in the numerator, thereby
directly measuring momentum;
- The calculations are applied on unsmoothed data. Therefore, short-term
extreme movements in price are not hidden. Once calculated, smoothing
can be applied to the CMO, if desired;
- The scale is bounded between +100 and -100, thereby allowing you to
clearly see changes in net momentum using the 0 level. The bounded scale
also allows you to conveniently compare values across different securities.
WARNING:
- For purpose educate only
- This script to change bars colors.
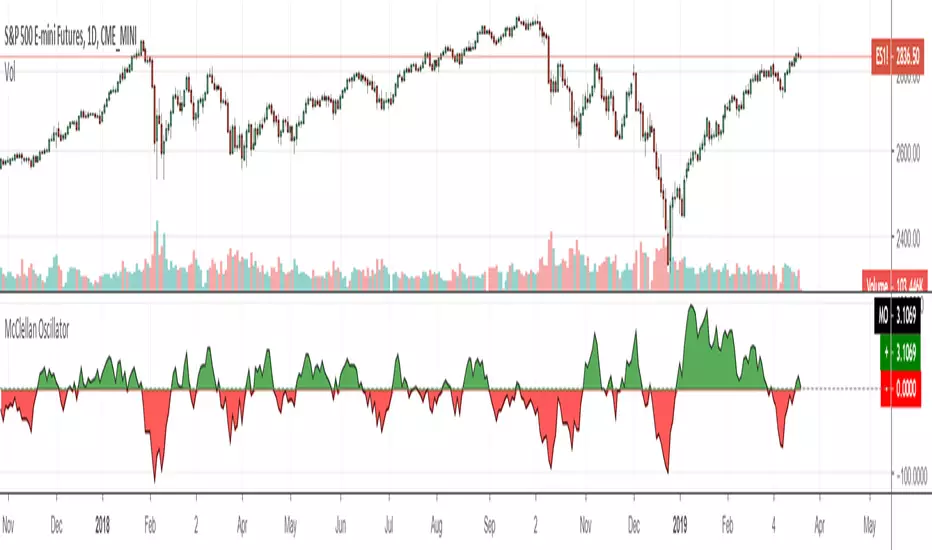
McClellan Oscillator [LazyBear ~ modified]The McClellan Oscillator is a market breadth indicator developed by Sherman and Marian McClellan.
It is calculated from Net Advances, which is the number of advancing issues minus the number of declining issues. Subtracting the 39-day exponential moving average of Net Advances from the 19-day exponential moving average of Net Advances forms the oscillator.
The McClellan Oscillator can be traded with breadth thrusts, centerline crossovers and divergences.
The original code was written by LazyBear - I just modified it to add together all advancing and declining issues from all stock exchanges (NYSE + NASDAQ + others), to make it available on the hourly time frame and also add alerts.

ALTDEL S/E Awesome OscillatorA simple customization of the Awesome Oscillator: allows you to change the moving averages (integer) as well as make them exponential.

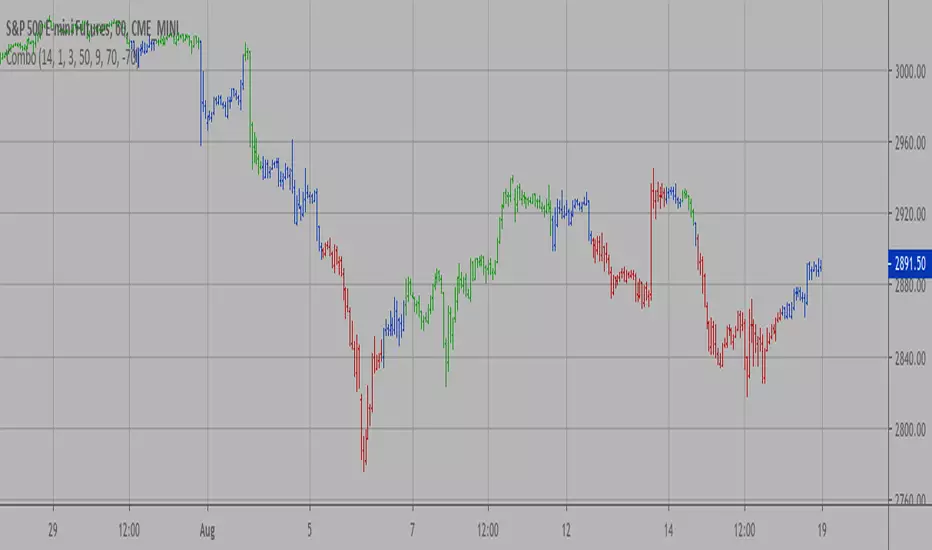
TMO (True Momentum Oscillator)TMO ((T)rue (M)omentum (O)scilator)
Created by Mobius V01.05.2018 TOS Convert to TV using Claude 3.7 and ChatGPT 03 Mini :
TMO calculates momentum using the delta of price. Giving a much better picture of trend, tend reversals and divergence than momentum oscillators using price.
True Momentum Oscillator (TMO)
The True Momentum Oscillator (TMO) is a momentum-based technical indicator designed to identify trend direction, trend strength, and potential reversal points in the market. It's particularly useful for spotting overbought and oversold conditions, aiding traders in timing their entries and exits.
How it Works:
The TMO calculates market momentum by analyzing recent price action:
Momentum Calculation:
For a user-defined length (e.g., 14 bars), TMO compares the current closing price to past open prices. It assigns:
+1 if the current close is greater than the open price of the past bar (indicating bullish momentum).
-1 if it's less (indicating bearish momentum).
0 if there's no change.
The sum of these scores gives a raw momentum measure.
EMA Smoothing:
To reduce noise and false signals, this raw momentum is smoothed using Exponential Moving Averages (EMAs):
First, the raw data is smoothed by an EMA over a short calculation period (default: 5).
Then, it undergoes additional smoothing through another EMA (default: 3 bars), creating the primary "Main" line of the indicator.
Lastly, a "Signal" line is derived by applying another EMA (also default: 3 bars) to the main line, adding further refinement.
Trend Identification:
The indicator plots two lines:
Main Line: Indicates current momentum strength and direction.
Signal Line: Acts as a reference line, similar to a moving average crossover system.
When the Main line crosses above the Signal line, it suggests strengthening bullish momentum. Conversely, when the Main line crosses below the Signal line, it indicates increasing bearish momentum.
Overbought/Oversold Levels:
The indicator identifies key levels based on the chosen length parameter:
Overbought zone (positive threshold): Suggests the market might be overheated, and a potential bearish reversal or pullback could occur.
Oversold zone (negative threshold): Suggests the market might be excessively bearish, signaling a potential bullish reversal.
Clouds visually mark these overbought/oversold areas, making it easy to see potential reversal zones.
Trading Applications:
Trend-following: Traders can enter positions based on crossovers of the Main and Signal lines.
Reversals: The overbought and oversold areas highlight high-probability reversal points.
Momentum confirmation: Use TMO to confirm price action or other technical signals, improving trade accuracy and timing.
The True Momentum Oscillator provides clarity in identifying momentum shifts, making it a valuable addition to various trading strategies.

Volatility-Adjusted Momentum Oscillator (VAMO)Concept & Rationale: This indicator combines momentum and volatility into one oscillator. The idea is that a price move accompanied by high volatility has greater significance. We use Rate of Change (ROC) for momentum and Average True Range (ATR) for volatility, multiplying them to gauge “volatility-weighted momentum.” This concept is inspired by the Weighted Momentum & Volatility Indicator, which multiplies normalized ROC and ATR values. The result is shown as a histogram oscillating around zero – rising green bars indicate bullish momentum, while falling red bars indicate bearish momentum. When the histogram crosses above or below zero, it provides clear buy/sell signals. Higher magnitude bars suggest a stronger trend move. Crypto markets often see volatility spikes preceding big moves, so VAMO aims to capture those moments when momentum and volatility align for a powerful breakout.
Key Features:
Momentum-Volatility Fusion: Measures momentum (price ROC) adjusted by volatility (ATR). Strong trends register prominently only when price change is significant and volatility is elevated.
Intuitive Histogram: Plotted as a color-coded histogram around a zero line – green bars above zero for bullish trends, red bars below zero for bearish. This makes it easy to visualize trend strength and direction at a glance.
Clear Signals: A cross above 0 signals a buy, and below 0 signals a sell. Traders can also watch for the histogram peaking and then shrinking as an early sign of a trend reversal (e.g. bars switching from growing to shrinking while still positive could mean bullish momentum is waning).
Optimized for Volatility: Because ATR is built-in, the oscillator naturally adapts to crypto volatility. In calm periods, signals will be smaller (reducing noise), whereas during volatile swings the indicator accentuates the move, helping predict big price swings.
Customization: The lookback period is adjustable. Shorter periods (e.g. 5-10) make it more sensitive for scalping, while longer periods (20+) smooth it out for swing trading.
How to Use: When VAMO bars turn green and push above zero, it indicates bullish momentum with strong volatility – a cue that price is likely to rally in the near term. Conversely, red bars below zero signal bearish pressure. For example, if a coin’s price has been flat and then VAMO spikes green above zero, it suggests an explosive upward move is brewing. Traders can enter on the zero-line cross (or on the first green bar) and consider exiting when the histogram peaks and starts shrinking (signaling momentum slowdown). In sideways markets, VAMO will hover near zero – staying out during those low-volatility periods helps avoid false signals. This indicator’s strength is catching the moment when a quiet market turns volatile in one direction, which often precedes the next few candlesticks of sustained movement.

Dynamic Momentum Oscillator (DMO) [Angel Algo]Dynamic Momentum Oscillator (DMO)
OVERVIEW: The Dynamic Momentum Oscillator (DMO) is a technical indicator designed to measure the momentum of price movements in financial markets. It combines momentum calculation with dynamic range assessment to provide insights into potential trend reversals and overbought/oversold conditions.
DMO is different from classic momentum oscillators like the RSI or Stochastic Oscillator because it looks at the momentum in relation to how much the price is moving. This helps it give signals that better match what's happening in the market, especially when the market's volatility is changing.
HOW TO USE:
Interpretation:
Thresholds: Horizontal lines mark user-defined threshold levels for overbought (OB) and oversold (OS) conditions, aiding in identifying potential trend pullbacks and reversals.
DMO Line: The primary line on the indicator plot. It reflects momentum in relation to the dynamic price range. Positive values indicate bullish momentum, while negative values indicate bearish momentum.
Filled Area: The area between the DMO line and the zero line is filled with color to enhance visualization of momentum shifts.
Trading Signals:
Thresholds: Monitor for potential trend reversals when the DMO crosses above the overbought threshold or below the oversold threshold.
Crossovers: Look for buy signals when the DMO line crosses above the zero and sell signals when it crosses below.
Filled Area: The green color indicates bullish momentum, red indicates bearish momentum and gray color indicates neutral conditions.
Signals: Circles appear on the chart when the DMO crosses the overbought or oversold thresholds, indicating conditions for potential trend pullbacks or reversals.
SETTINGS:
Length: Adjust the length parameter to vary the number of periods considered in the momentum calculation.
Smoothing: Enable or disable smoothing of the DMO line using the provided option.
Thresholds: Customize the overbought and oversold threshold levels to suit specific market conditions and trading preferences.
Disclaimer: The DMO indicator serves as part of a comprehensive trading strategy and should not be solely relied upon for trading decisions. Past performance is not indicative of future results, and trading involves inherent risks.

Oscillator ExtremesThe Oscillator Extremes indicator plots the normalized positioning of the selected oscillator versus the Bollinger Bands' upper and lower boundaries. Currently, this indicator has four different oscillators to choose from; RSI, CMO, CCI, and ROC.
When the oscillator pushes towards one extreme, it will bring the value of the prevailing line closer to zero. If the bullish or bearish line crosses the zero line, the oscillator is past the extreme of the Bollinger Band.
Example: If the RSI crosses over the upper boundary of the Bollinger, the bullish(green) line will cross under the zero line.
Crossovers of the bullish and bearish lines can indicate a shift in momentum and are a signal. Where the line crossing under, towards zero, is the prevailing trend. The plotted lines will highlight green(bullish) or red(bearish) to show the prevailing trend. This is similar to a DI+- crossover that is commonly associated with the ADX.
We have included an optional normalized ADX to help validate signals. The ADX will change color based on the slope of the ADX. Purple indicates a positive slope and white for a negative slope.

Stochastic Moving Average Delta Oscillator (SMADO)This is an interesting take on the stochastic oscillator. What I have done here is I've taken the cumulative sum of the deltas of all the simple moving averages from 1 to 200 and summed them. Next I transform this into a stochastic oscillator with ta.stoch. The point of this is to show you trends, tops and bottoms. I hope you find this indicator as interesting as I did. Please enjoy!
The Feature include: Stochastic Window, Number of MA's to check, General Smoothing, and Direction Indication.

Ichimoku Cloud OscillatorThe script looks at how far the price is below or above the ichimoku cloud, and publishes an oscillator.
Low or high oscillator values are indicative of reversals, to assist with long or short entry decisions.

Oscillator EdgesAnother simple script to be added on top of other indicators. Simply provides a symbol of varying color depending on the value of the oscillator. Allows up to 4 different colors in each direction. Includes alerts conditions. Demonstration is the indicator being applied to the RSI (purple) included in Market Cipher B.
To use, simply add it to your indicator, and choose and oscillator of your choice in the Input Settings. Alternatively, you can just keep it on 'close' and use the built in RSI. Or, you can use the RSI formula on top of something else (if that's your thing).
The names are silly, so I hope this is okay with all of you.
Let me know what you think, and if there are any problems, questions, or concerns!

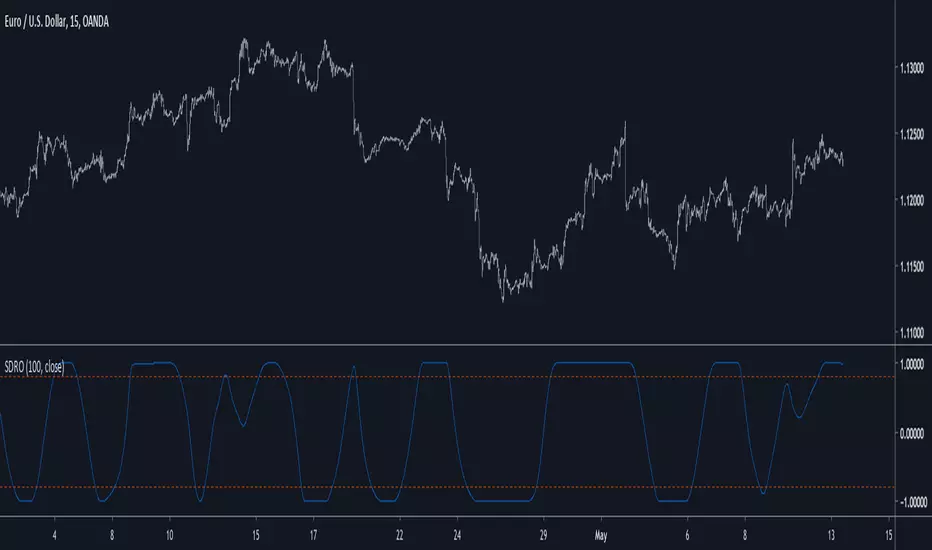
Smoothed Delta's Ratio OscillatorIntroduction
Scaled and smoothed oscillators can provide easy to read/use information regarding price, therefore i will introduce a new oscillator who create smooth results and use a fast and practical scaling method. In order to allow for even more smoothness the option to smooth the input with a lsma has been added.
Scaling Using Changes
In this indicator scaling in a range of (1,-1) is achieved through the following calculations :
a = sma(abs(change(src,length)),length)
b = change(sma(src,length),length)
c = b/a
where src is our input. The two elements a and b are quite similar, a smooth the absolute change of the input over length period while b calculate the change of the smoothed input over length period, this make a > b and able us to perform scaling in a range of (1,-1).
The Indicator Parameters
Length control the differencing/smoothing period of the indicator, greater values create smoother and less volatile results, this mean that the oscillator will tend to be equal to 1 or -1 in a longer period of time if length is high. The smooth option allow for even smoother results by enabling the input to be smoothed by a lsma of length period.
Conclusions
I presented a smooth oscillator using a new rescaling technique. Parameters can be separated to provide different results, i believe the code is simple enough for everyone to modify it in order to provide interesting creations.
Adaptive Bandpass Trigger Oscillator Ver 3This is an improvement of the Adaptive Bandpass Trigger Oscillator. It adds an option for a multiplier to the dominant cycle to filter out smaller swings.
Feel free to message me if you would like development work or would just like to donate ; )
This is based off of Ehlers' Bandpass Filter system (link below slides 15-17). I then used Ehlers' methods for finding the dominant cycle to automatically input the dominant cycle to the length. Essentially Ehlers runs a band pass with a given period to detrend the price data and highlight a cycle with the given frequency(length). This represents the In phase cycle. Ehlers then creates the trigger line by taking the one bar momentum of the In Phase line, multiplying by 2Pi and then using this to create a 60 degree leading signal. The triggers are crossovers of the In Phase and Lead lines. You can also use conservative signals by waiting for the In Phase line to trend in the direction of the trigger crossover as well.
Delta represents how much to influence the oscillator by the price (Delta 0 is a perfect wave)
Alpha represents how quickly to adapt between the dominant cycle changes in the price.
Thanks to LazyBear for implementing Ehlers' original adaptive code, which I used for this system
Thanks to HPotter for the BandPass Filter code, which I used as a base for implementing the rest of the system

Adaptive Bandpass Trigger Oscillator Ver 2.0This is an improvement of the Adaptive Bandpass Trigger Oscillator. It normalizes the values to 0-100 to allow the addition of overbought and oversold levels. An aggressive trigger would be an inflection point of the trigger line while overbought/oversold and the phase line above/below the midline.
Feel free to message me if you would like development work or would just like to donate ; )
This is based off of Ehlers' Bandpass Filter system (link below slides 15-17). I then used Ehlers' methods for finding the dominant cycle to automatically input the dominant cycle to the length. Essentially Ehlers runs a band pass with a given period to detrend the price data and highlight a cycle with the given frequency(length). This represents the In phase cycle. Ehlers then creates the trigger line by taking the one bar momentum of the In Phase line, multiplying by 2Pi and then using this to create a 60 degree leading signal. The triggers are crossovers of the In Phase and Lead lines. You can also use conservative signals by waiting for the In Phase line to trend in the direction of the trigger crossover as well.
Delta represents how much to influence the oscillator by the price (Delta 0 is a perfect wave)
Alpha represents how quickly to adapt between the dominant cycle changes in the price.
Thanks to LazyBear for implementing Ehlers' original adaptive code, which I used for this system
Thanks to HPotter for the BandPass Filter code, which I used as a base for implementing the rest of the system
www.mesasoftware.com

Detrended Price OscillatorHi
Let me introduce my Detrended Price Oscillator script.
The Detrend Price Osc indicator is similar to a moving average,
in that it filters out trends in prices to more easily identify
cycles. The indicator is an attempt to define cycles in a trend
by drawing a moving average as a horizontal straight line and
placing prices along the line according to their relation to a
moving average. It provides a means of identifying underlying
cycles not apparent when the moving average is viewed within a
price chart. Cycles of a longer duration than the Length (number
of bars used to calculate the Detrend Price Osc) are effectively
filtered or removed by the oscillator.

Public Sentiment Oscillator This is a combination of 9 common use indicators turned into on single oscillator. These indicators are: 200 day moving average cross, 9/12 ema cross, 13/48 sma cross, rsi, stochastic, mfi, cci, macd, and open close trend. I have weighted the scores to be pretty even so that its balances each indicator in the sum. Because of the odd number of indicators, I have decided to normalized the score to 10. I think this has the effect of making it easier to read.
The score definition: oc_trend > 0 ? 1 : 0, fast_e > slow_e ? 1 : 0, fast_s > slow_s ? 1 : 0, rsi < 30 ? 0 : rsi > 30 and rsi < 70 ? 0.5 : rsi > 70 ? 1 : 0, macd1 > macd2 ? 0.5 : macd1 < macd2 ? 0 : 0, (hist >=0 ? (hist < hist ? 0.5 : 0.25) : (hist < hist ? 0.25 : 0)), stoch < 20 ? 0 : stoch > 20 and stoch < 80 ? 0.5 : stoch > 80 ? 1 : 0, source > ma200 ? 1 : ex <= ma200 ? 0 : 0, mfi < 20 ? 0 : mfi > 20 and mfi < 80 ? 0.5 : mfi > 80 ? 1 : 0, cci < -100 ? 0 : cci > -100 and cci < 100 ? 0.5 : cci > 100 ? 1 : 0
I hope you find this useful in your trades. Enjoy!

Dodgy Volume OscillatorThis is something between a money flow moving average and a volume oscillator. To be honest, I don't really understand the math I used, but it compares the volume to the price and charts it similarly to a moving average. Input of 100 seems to work well on shorter time frames, consider lowering this for higher time frames.
I am still testing this and it seems to give of many false positives, be careful!
True Momentum Oscillator"TMO calculates momentum using the delta of price. Giving a much better picture of trend, trend reversals and divergence than momentum oscillators using price". This is comparable to the WaveTrend Oscillator, gives more or less better or worse signals depending on the time frame and markets. This is a free and open source indicator found in many platforms, now ported to TV.
This indicator uses the closing and opening of the price in a way that reminds me of the Qstick indicator but it seems different. It's an oscillator with overbought and oversold zones and crossovers for entry and exits. I included the option of changing the moving averages from the standard exponential types used in its 3 functions to calculate the main and signal lines just in case the settings need to be changed further or if anyone wants to experiment to find better settings on top of just changing the lengths for each length type. I added dots for when the Main line crosses the Signal line. The Main line is darkened in case anyone needs to see it better.
