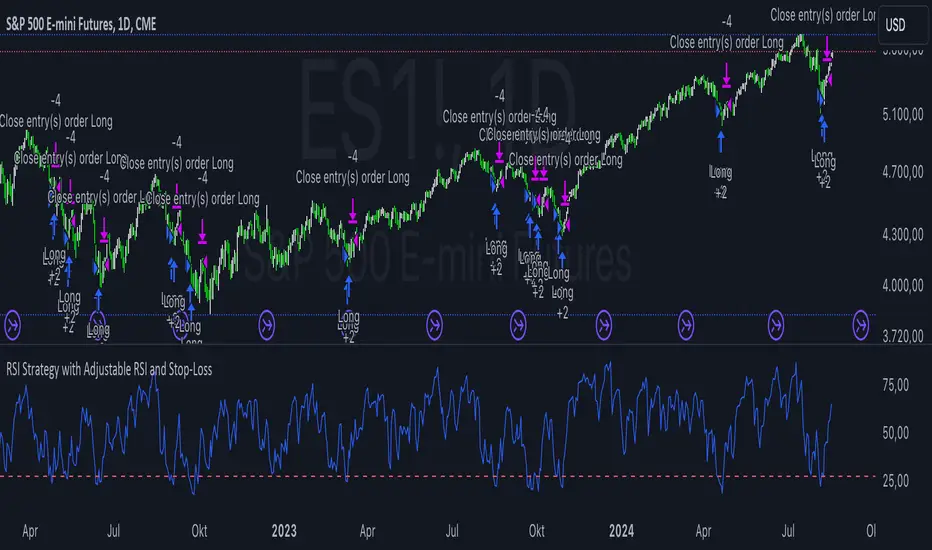
RSI Strategy with Adjustable RSI and Stop-LossThis trading strategy uses the Relative Strength Index (RSI) and a Stop-Loss mechanism to make trading decisions. Here’s a breakdown of how it works:
RSI Calculation:
The RSI is calculated based on the user-defined length (rsi_length). This is a momentum oscillator that measures the speed and change of price movements.
Buy Condition:
The strategy generates a buy signal when the RSI value is below a user-defined threshold (rsi_threshold). This condition indicates that the asset might be oversold and potentially due for a rebound.
Stop-Loss Mechanism:
Upon triggering a buy signal, the strategy calculates the Stop-Loss level. The Stop-Loss level is set to a percentage below the entry price, as specified by the user (stop_loss_percent). This level is used to limit potential losses if the price moves against the trade.
Sell Condition:
A sell signal is generated when the current closing price is higher than the highest high of the previous day. This condition suggests that the price has reached a new high, and the strategy decides to exit the trade.
Plotting:
The RSI values are plotted on the chart for visual reference. A horizontal line is drawn at the RSI threshold level to help visualize the oversold condition.
Summary
Buying Strategy: When RSI is below the specified threshold, indicating potential oversold conditions.
Stop-Loss: Set based on a percentage of the entry price to limit potential losses.
Selling Strategy: When the price surpasses the highest high of the previous day, signaling a potential exit point.
This strategy aims to capture potential rebounds from oversold conditions and manage risk using a Stop-Loss mechanism. As with any trading strategy, it’s essential to test and optimize it under various market conditions to ensure its effectiveness.
Cari skrip untuk "momentum"
Dual Chain StrategyDual Chain Strategy - Technical Overview
How It Works:
The Dual Chain Strategy is a unique approach to trading that utilizes Exponential Moving Averages (EMAs) across different timeframes, creating two distinct "chains" of trading signals. These chains can work independently or together, capturing both long-term trends and short-term price movements.
Chain 1 (Longer-Term Focus):
Entry Signal: The entry signal for Chain 1 is generated when the closing price crosses above the EMA calculated on a weekly timeframe. This suggests the start of a bullish trend and prompts a long position.
bullishChain1 = enableChain1 and ta.crossover(src1, entryEMA1)
Exit Signal: The exit signal is triggered when the closing price crosses below the EMA on a daily timeframe, indicating a potential bearish reversal.
exitLongChain1 = enableChain1 and ta.crossunder(src1, exitEMA1)
Parameters: Chain 1's EMA length is set to 10 periods by default, with the flexibility for user adjustment to match various trading scenarios.
Chain 2 (Shorter-Term Focus):
Entry Signal: Chain 2 generates an entry signal when the closing price crosses above the EMA on a 12-hour timeframe. This setup is designed to capture quicker, shorter-term movements.
bullishChain2 = enableChain2 and ta.crossover(src2, entryEMA2)
Exit Signal: The exit signal occurs when the closing price falls below the EMA on a 9-hour timeframe, indicating the end of the shorter-term trend.
exitLongChain2 = enableChain2 and ta.crossunder(src2, exitEMA2)
Parameters: Chain 2's EMA length is set to 9 periods by default, and can be customized to better align with specific market conditions or trading strategies.
Key Features:
Dual EMA Chains: The strategy's originality shines through its dual-chain configuration, allowing traders to monitor and react to both long-term and short-term market trends. This approach is particularly powerful as it combines the strengths of trend-following with the agility of momentum trading.
Timeframe Flexibility: Users can modify the timeframes for both chains, ensuring the strategy can be tailored to different market conditions and individual trading styles. This flexibility makes it versatile for various assets and trading environments.
Independent Trade Logic: Each chain operates independently, with its own set of entry and exit rules. This allows for simultaneous or separate execution of trades based on the signals from either or both chains, providing a robust trading system that can handle different market phases.
Backtesting Period: The strategy includes a configurable backtesting period, enabling thorough performance assessment over a historical range. This feature is crucial for understanding how the strategy would have performed under different market conditions.
time_cond = time >= startDate and time <= finishDate
What It Does:
The Dual Chain Strategy offers traders a distinctive trading tool that merges two separate EMA-based systems into one cohesive framework. By integrating both long-term and short-term perspectives, the strategy enhances the ability to adapt to changing market conditions. The originality of this script lies in its innovative dual-chain design, providing traders with a unique edge by allowing them to capitalize on both significant trends and smaller, faster price movements.
Whether you aim to capture extended market trends or take advantage of more immediate price action, the Dual Chain Strategy provides a comprehensive solution with a high degree of customization and strategic depth. Its flexibility and originality make it a valuable tool for traders seeking to refine their approach to market analysis and execution.
How to Use the Dual Chain Strategy
Step 1: Access the Strategy
Add the Script: Start by adding the Dual Chain Strategy to your TradingView chart. You can do this by searching for the script by name or using the link provided.
Select the Asset: Apply the strategy to your preferred trading pair or asset, such as #BTCUSD, to see how it performs.
Step 2: Configure the Settings
Enable/Disable Chains:
The strategy is designed with two independent chains. You can choose to enable or disable each chain depending on your trading style and the market conditions.
enableChain1 = input.bool(true, title='Enable Chain 1')
enableChain2 = input.bool(true, title='Enable Chain 2')
By default, both chains are enabled. If you prefer to focus only on longer-term trends, you might disable Chain 2, or vice versa if you prefer shorter-term trades.
Set EMA Lengths:
Adjust the EMA lengths for each chain to match your trading preferences.
Chain 1: The default EMA length is 10 periods. This chain uses a weekly timeframe for entry signals and a daily timeframe for exits.
len1 = input.int(10, minval=1, title='Length Chain 1 EMA', group="Chain 1")
Chain 2: The default EMA length is 9 periods. This chain uses a 12-hour timeframe for entries and a 9-hour timeframe for exits.
len2 = input.int(9, minval=1, title='Length Chain 2 EMA', group="Chain 2")
Customize Timeframes:
You can customize the timeframes used for entry and exit signals for both chains.
Chain 1:
Entry Timeframe: Weekly
Exit Timeframe: Daily
tf1_entry = input.timeframe("W", title='Chain 1 Entry Timeframe', group="Chain 1")
tf1_exit = input.timeframe("D", title='Chain 1 Exit Timeframe', group="Chain 1")
Chain 2:
Entry Timeframe: 12 Hours
Exit Timeframe: 9 Hours
tf2_entry = input.timeframe("720", title='Chain 2 Entry Timeframe (12H)', group="Chain 2")
tf2_exit = input.timeframe("540", title='Chain 2 Exit Timeframe (9H)', group="Chain 2")
Set the Backtesting Period:
Define the period over which you want to backtest the strategy. This allows you to see how the strategy would have performed historically.
startDate = input.time(timestamp('2015-07-27'), title="StartDate")
finishDate = input.time(timestamp('2026-01-01'), title="FinishDate")
Step 3: Analyze the Signals
Understand the Entry and Exit Signals:
Buy Signals: When the price crosses above the entry EMA, the strategy generates a buy signal.
bullishChain1 = enableChain1 and ta.crossover(src1, entryEMA1)
Sell Signals: When the price crosses below the exit EMA, the strategy generates a sell signal.
bearishChain2 = enableChain2 and ta.crossunder(src2, entryEMA2)
Review the Visual Indicators:
The strategy plots buy and sell signals on the chart with labels for easy identification:
BUY C1/C2 for buy signals from Chain 1 and Chain 2.
SELL C1/C2 for sell signals from Chain 1 and Chain 2.
This visual aid helps you quickly understand when and why trades are being executed.
Step 4: Optimize the Strategy
Backtest Results:
Review the strategy’s performance over the backtesting period. Look at key metrics like net profit, drawdown, and trade statistics to evaluate its effectiveness.
Adjust the EMA lengths, timeframes, and other settings to see how changes affect the strategy’s performance.
Customize for Live Trading:
Once satisfied with the backtest results, you can apply the strategy settings to live trading. Remember to continuously monitor and adjust as needed based on market conditions.
Step 5: Implement Risk Management
Use Realistic Position Sizing:
Keep your risk exposure per trade within a comfortable range, typically between 1-2% of your trading capital.
Set Alerts:
Set up alerts for buy and sell signals, so you don’t miss trading opportunities.
Paper Trade First:
Consider running the strategy in a paper trading account to understand its behavior in real market conditions before committing real capital.
This dual-layered approach offers a distinct advantage: it enables the strategy to adapt to varying market conditions by capturing both broad trends and immediate price action without one chain's activity impacting the other's decision-making process. The independence of these chains in executing transactions adds a level of sophistication and flexibility that is rarely seen in more conventional trading systems, making the Dual Chain Strategy not just unique, but a powerful tool for traders seeking to navigate complex market environments.

Double CCI Confirmed Hull Moving Average Reversal StrategyOverview
The Double CCI Confirmed Hull Moving Average Strategy utilizes hull moving average (HMA) in conjunction with two commodity channel index (CCI) indicators: the slow and fast to increase the probability of entering when the short and mid-term uptrend confirmed. The main idea is to wait until the price breaks the HMA while both CCI are showing that the uptrend has likely been already started. Moreover, strategy uses exponential moving average (EMA) to trail the price when it reaches the specific level. The strategy opens only long trades.
Unique Features
Dynamic stop-loss system: Instead of fixed stop-loss level strategy utilizes average true range (ATR) multiplied by user given number subtracted from the position entry price as a dynamic stop loss level.
Configurable Trading Periods: Users can tailor the strategy to specific market windows, adapting to different market conditions.
Double trade setup confirmation: Strategy utilizes two different period CCI indicators to confirm the breakouts of HMA.
Trailing take profit level: After reaching the trailing profit activation level scrip activate the trailing of long trade using EMA. More information in methodology.
Methodology
The strategy opens long trade when the following price met the conditions:
Short-term period CCI indicator shall be above 0.
Long-term period CCI indicator shall be above 0.
Price shall cross the HMA and candle close above it with the same candle
When long trade is executed, strategy set the stop-loss level at the price ATR multiplied by user-given value below the entry price. This level is recalculated on every next candle close, adjusting to the current market volatility.
At the same time strategy set up the trailing stop validation level. When the price crosses the level equals entry price plus ATR multiplied by user-given value script starts to trail the price with EMA. If price closes below EMA long trade is closed. When the trailing starts, script prints the label “Trailing Activated”.
Strategy settings
In the inputs window user can setup the following strategy settings:
ATR Stop Loss (by default = 1.75)
ATR Trailing Profit Activation Level (by default = 2.25)
CCI Fast Length (by default = 25, used for calculation short term period CCI
CCI Slow Length (by default = 50, used for calculation long term period CCI)
Hull MA Length (by default = 34, period of HMA, which shall be broken to open trade)
Trailing EMA Length (by default = 20)
User can choose the optimal parameters during backtesting on certain price chart.
Justification of Methodology
Before understanding why this particular combination of indicator has been chosen let's briefly explain what is CCI and HMA.
The Commodity Channel Index (CCI) is a momentum-based technical indicator used in trading to measure a security's price relative to its average price over a given period. Developed by Donald Lambert in 1980, the CCI is primarily used to identify cyclical trends in a security, helping traders to spot potential buying or selling opportunities.
The CCI formula is:
CCI = (Typical Price − SMA) / (0.015 × Mean Deviation)
Typical Price (TP): This is calculated as the average of the high, low, and closing prices for the period.
Simple Moving Average (SMA): This is the average of the Typical Prices over a specific number of periods.
Mean Deviation: This is the average of the absolute differences between the Typical Price and the SMA.
The result is a value that typically fluctuates between +100 and -100, though it is not bounded and can go higher or lower depending on the price movement.
The Hull Moving Average (HMA) is a type of moving average that was developed by Alan Hull to improve upon the traditional moving averages by reducing lag while maintaining smoothness. The goal of the HMA is to create an indicator that is both quick to respond to price changes and less prone to whipsaws (false signals).
How the Hull Moving Average is Calculated?
The Hull Moving Average is calculated using the following steps:
Weighted Moving Average (WMA): The HMA starts by calculating the Weighted Moving Average (WMA) of the price data over a period square root of n (sqrt(n))
Speed Adjustment: A WMA is then calculated for half of the period n/2, and this is multiplied by 2 to give more weight to recent prices.
Lag Reduction: The WMA of the full period n is subtracted from the doubled n/2 WMA.
Final Smoothing: To smooth the result and reduce noise, a WMA is calculated for the square root of the period n.
The formula can be represented as:
HMA(n) = WMA(WMA(n/2) × 2 − WMA(n), sqrt(n))
The Weighted Moving Average (WMA) is a type of moving average that gives more weight to recent data points, making it more responsive to recent price changes than a Simple Moving Average (SMA). In a WMA, each data point within the selected period is multiplied by a weight, with the most recent data receiving the highest weight. The sum of these weighted values is then divided by the sum of the weights to produce the WMA.
This strategy leverages HMA of user given period as a critical level which shall be broken to say that probability of trend change to the upside increased. HMA reacts faster than EMA or SMA to the price change, that’s why it increases chances to enter new trade earlier. Long-term period CCI helps to have an approximation of mid-term trend. If it’s above 0 the probability of uptrend increases. Short-period CCI allows to have an approximation of short-term trend reversal from down to uptrend. This approach increases chances to have a long trade setup in the direction of mid-term trend when the short-term trend starts to reverse.
ATR is used to adjust the strategy risk management to the current market volatility. If volatility is low, we don’t need the large stop loss to understand the there is a high probability that we made a mistake opening the trade. User can setup the settings ATR Stop Loss and ATR Trailing Profit Activation Level to realize his own risk to reward preferences, but the unique feature of a strategy is that after reaching trailing profit activation level strategy is trying to follow the trend until it is likely to be finished instead of using fixed risk management settings. It allows sometimes to be involved in the large movements. It’s also important to make a note, that script uses HMA to enter the trade, but for trailing it leverages EMA. It’s used because EMA has no such fast reaction to price move which increases probability not to be stopped out from any significant uptrend move.
Backtest Results
Operating window: Date range of backtests is 2022.07.01 - 2024.08.01. It is chosen to let the strategy to close all opened positions.
Commission and Slippage: Includes a standard Binance commission of 0.1% and accounts for possible slippage over 5 ticks.
Initial capital: 10000 USDT
Percent of capital used in every trade: 100%
Maximum Single Position Loss: -4.67%
Maximum Single Profit: +19.66%
Net Profit: +14897.94 USDT (+148.98%)
Total Trades: 104 (36.54% win rate)
Profit Factor: 2.312
Maximum Accumulated Loss: 1302.66 USDT (-9.58%)
Average Profit per Trade: 143.25 USDT (+0.96%)
Average Trade Duration: 34 hours
These results are obtained with realistic parameters representing trading conditions observed at major exchanges such as Binance and with realistic trading portfolio usage parameters.
How to Use
Add the script to favorites for easy access.
Apply to the desired timeframe and chart (optimal performance observed on 2h BTC/USDT).
Configure settings using the dropdown choice list in the built-in menu.
Set up alerts to automate strategy positions through web hook with the text: {{strategy.order.alert_message}}
Disclaimer:
Educational and informational tool reflecting Skyrex commitment to informed trading. Past performance does not guarantee future results. Test strategies in a simulated environment before live implementation

Bollinger Bands Enhanced StrategyOverview
The common practice of using Bollinger bands is to use it for building mean reversion or squeeze momentum strategies. In the current script Bollinger Bands Enhanced Strategy we are trying to combine the strengths of both strategies types. It utilizes Bollinger Bands indicator to buy the local dip and activates trailing profit system after reaching the user given number of Average True Ranges (ATR). Also it uses 200 period EMA to filter trades only in the direction of a trend. Strategy can execute only long trades.
Unique Features
Trailing Profit System: Strategy uses user given number of ATR to activate trailing take profit. If price has already reached the trailing profit activation level, scrip will close long trade if price closes below Bollinger Bands middle line.
Configurable Trading Periods: Users can tailor the strategy to specific market windows, adapting to different market conditions.
Major Trend Filter: Strategy utilizes 100 period EMA to take trades only in the direction of a trend.
Flexible Risk Management: Users can choose number of ATR as a stop loss (by default = 1.75) for trades. This is flexible approach because ATR is recalculated on every candle, therefore stop-loss readjusted to the current volatility.
Methodology
First of all, script checks if currently price is above the 200-period exponential moving average EMA. EMA is used to establish the current trend. Script will take long trades on if this filtering system showing us the uptrend. Then the strategy executes the long trade if candle’s low below the lower Bollinger band. To calculate the middle Bollinger line, we use the standard 20-period simple moving average (SMA), lower band is calculated by the substruction from middle line the standard deviation multiplied by user given value (by default = 2).
When long trade executed, script places stop-loss at the price level below the entry price by user defined number of ATR (by default = 1.75). This stop-loss level recalculates at every candle while trade is open according to the current candle ATR value. Also strategy set the trailing profit activation level at the price above the position average price by user given number of ATR (by default = 2.25). It is also recalculated every candle according to ATR value. When price hit this level script plotted the triangle with the label “Strong Uptrend” and start trail the price at the middle Bollinger line. It also started to be plotted as a green line.
When price close below this trailing level script closes the long trade and search for the next trade opportunity.
Risk Management
The strategy employs a combined and flexible approach to risk management:
It allows positions to ride the trend as long as the price continues to move favorably, aiming to capture significant price movements. It features a user-defined ATR stop loss parameter to mitigate risks based on individual risk tolerance. By default, this stop-loss is set to a 1.75*ATR drop from the entry point, but it can be adjusted according to the trader's preferences.
There is no fixed take profit, but strategy allows user to define user the ATR trailing profit activation parameter. By default, this stop-loss is set to a 2.25*ATR growth from the entry point, but it can be adjusted according to the trader's preferences.
Justification of Methodology
This strategy leverages Bollinger bangs indicator to open long trades in the local dips. If price reached the lower band there is a high probability of bounce. Here is an issue: during the strong downtrend price can constantly goes down without any significant correction. That’s why we decided to use 200-period EMA as a trend filter to increase the probability of opening long trades during major uptrend only.
Usually, Bollinger Bands indicator is using for mean reversion or breakout strategies. Both of them have the disadvantages. The mean reversion buys the dip, but closes on the return to some mean value. Therefore, it usually misses the major trend moves. The breakout strategies usually have the issue with too high buy price because to have the breakout confirmation price shall break some price level. Therefore, in such strategies traders need to set the large stop-loss, which decreases potential reward to risk ratio.
In this strategy we are trying to combine the best features of both types of strategies. Script utilizes ate ATR to setup the stop-loss and trailing profit activation levels. ATR takes into account the current volatility. Therefore, when we setup stop-loss with the user-given number of ATR we increase the probability to decrease the number of false stop outs. The trailing profit concept is trying to add the beat feature from breakout strategies and increase probability to stay in trade while uptrend is developing. When price hit the trailing profit activation level, script started to trail the price with middle line if Bollinger bands indicator. Only when candle closes below the middle line script closes the long trade.
Backtest Results
Operating window: Date range of backtests is 2020.10.01 - 2024.07.01. It is chosen to let the strategy to close all opened positions.
Commission and Slippage: Includes a standard Binance commission of 0.1% and accounts for possible slippage over 5 ticks.
Initial capital: 10000 USDT
Percent of capital used in every trade: 30%
Maximum Single Position Loss: -9.78%
Maximum Single Profit: +25.62%
Net Profit: +6778.11 USDT (+67.78%)
Total Trades: 111 (48.65% win rate)
Profit Factor: 2.065
Maximum Accumulated Loss: 853.56 USDT (-6.60%)
Average Profit per Trade: 61.06 USDT (+1.62%)
Average Trade Duration: 76 hours
These results are obtained with realistic parameters representing trading conditions observed at major exchanges such as Binance and with realistic trading portfolio usage parameters.
How to Use
Add the script to favorites for easy access.
Apply to the desired timeframe and chart (optimal performance observed on 4h BTC/USDT).
Configure settings using the dropdown choice list in the built-in menu.
Set up alerts to automate strategy positions through web hook with the text: {{strategy.order.alert_message}}
Disclaimer:
Educational and informational tool reflecting Skyrex commitment to informed trading. Past performance does not guarantee future results. Test strategies in a simulated environment before live implementation

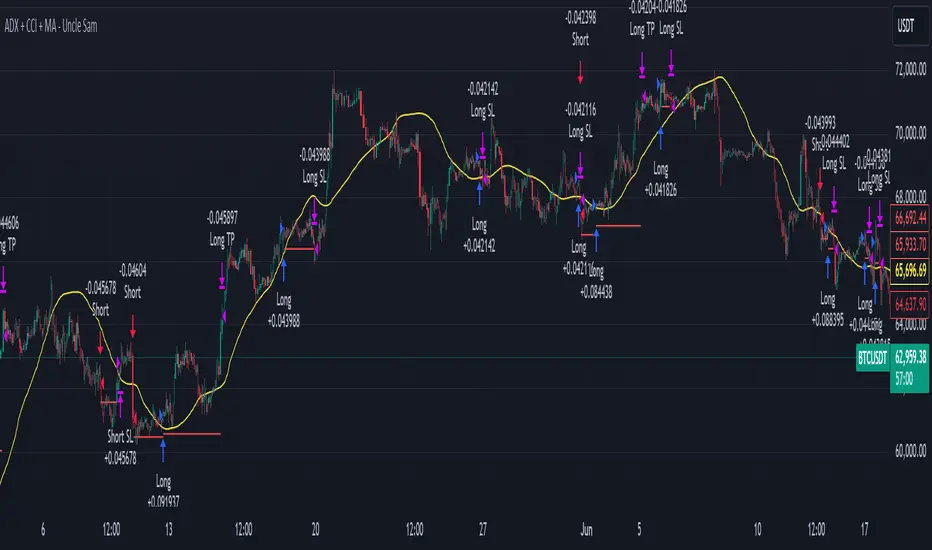
ADX + CCI + MA - Uncle SamStrategy Name: ADX + CCI + MA - Uncle Sam
Overview
This strategy aims to capitalize on trending markets by combining the Average Directional Index (ADX), Commodity Channel Index (CCI), and a customizable Moving Average (MA). It's designed for traders seeking a balanced approach to both long (buy) and short (sell) opportunities. Special thanks to the creators of the ADX and CCI indicators for their invaluable contributions to technical analysis.
Strategy Concept
The core idea is to identify strong trends with the ADX, confirm potential entry points with the CCI, and use the MA to filter trades in the direction of the broader trend. This approach seeks to avoid entering positions during periods of consolidation or when the trend is weak.
Indicator Logic
ADX (Average Directional Index): The ADX measures the strength of a trend, regardless of its direction. A value above the customizable adx_threshold (default 20) signals a strong trend, making it a prime environment for this strategy.
CCI (Commodity Channel Index): The CCI is a momentum oscillator that helps identify overbought (above 100) and oversold (below -100) conditions. We use CCI crossovers to time entries in the direction of the prevailing trend.
MA (Moving Average): The MA acts as a trend filter, ensuring we only enter trades aligned with the overall market direction. You have flexibility in choosing the MA type (SMA, EMA, etc.) and its length to suit your trading style and timeframe.
Entry Conditions
Long (Buy):
ADX is above the adx_threshold.
CCI crosses above 100.
Price is above the chosen Moving Average (if MA trend filtering is enabled).
Short (Sell):
ADX is above the adx_threshold.
CCI crosses below -100.
Price is below the chosen Moving Average (if MA trend filtering is enabled).
Exit Conditions
Stop Loss (SL): Each position has a customizable stop-loss percentage to manage risk. The default setting is 1%.
Take Profit (TP): Each position has a customizable take-profit percentage to secure gains. The default setting is 5%.
MA-Based Risk Management (Optional): This feature allows for early exits if the price closes against the MA trend for a specified number of candles. The default setting is 2 candles.
Default Settings
CCI Period: 15
ADX Length: 10
ADX Threshold: 20
MA Type: HMA
MA Length: 200
MA Source: Close
Commission Fee: $0.0
A commission fee is not added, add your trading/platform commission for realistic trading costs.
Backtest Results
The strategy has been backtested on with the default settings and a starting capital of $1000, with 0.0% commission fee. It shows promising results.
Disclaimer: Backtesting is hypothetical and does not guarantee future performance.
Important Considerations:
Customization: The strategy offers extensive customization to tailor it to your preferences. Experiment with different parameters and settings to find what works best for your trading style.
Risk Management: Always use proper risk management techniques, including position sizing and stop losses, to protect your capital.
TSI w SuperTrend decision - Strategy [presentTrading]This strategy aims to improve upon the performance of Traidngview's newly published "Trend Strength Index" indicator by incorporating the SuperTrend for better trade execution and risk management. Enjoy :)
█ Introduction and How it is Different
The "TSI with SuperTrend Decision - Strategy" combines the Trend Strength Index (TSI) with SuperTrend indicators to determine entry and exit points. Unlike traditional strategies that rely solely on one indicator, this method leverages the strengths of both TSI and SuperTrend to provide a more nuanced and adaptive trading strategy.
This dual approach allows for capturing trends more effectively, especially in volatile markets.
BTCUSD 8h LS Performance
█ Strategy, How it Works: Detailed Explanation
🔶 Trend Strength Index (TSI)
The TSI is a momentum oscillator that shows both the direction and strength of a trend. It is calculated by comparing the price movement with the bar index over a specified period. The formula for TSI is as follows:
```
TSI = (PC / |PC|)
where:
PC = Change in price over the period
```
In this strategy, TSI is calculated using the closing prices and a default period of 64 bars. The TSI values help identify overbought and oversold conditions, providing signals for potential market reversals.
🔶 SuperTrend Indicator
The SuperTrend is a trend-following indicator based on the average true range (ATR). It helps in identifying the direction of the market trend. The SuperTrend calculation involves:
```
SuperTrend = HLC3 ± (Factor * ATR)
where:
HLC3 = (High + Low + Close) / 3
Factor = User-defined multiplier
ATR = Average True Range over a period
```
The SuperTrend settings in this strategy include a length of 10 bars and a factor of 3.0.
Last Bull Cycle of BTC
🔶 Entry and Exit Conditions
The strategy uses the TSI and SuperTrend together to determine entry and exit points:
- Long Entry: When the SuperTrend indicates a downward trend (st.d < 0) and the TSI is above the oversold level (-0.241).
- Long Exit: When the SuperTrend indicates an upward trend (st.d > 0) and the TSI is below the overbought level (0.241).
- Short Entry: When the SuperTrend indicates an upward trend (st.d > 0) and the TSI is below the overbought level (0.241).
- Short Exit: When the SuperTrend indicates a downward trend (st.d < 0) and the TSI is above the oversold level (-0.241).
█ Trade Direction
The strategy allows users to select the trade direction through the `tradeDirection` input. The options are:
- Both: Enables both long and short trades.
- Long: Enables only long trades.
- Short: Enables only short trades.
█ Default Settings
- TSI Length: 64
- SuperTrend Length: 10
- SuperTrend Factor: 3.0
- Trade Direction: Both
- Take Profit (%): 30.0
- Stop Loss (%): 20.0
Impact of Default Settings
- TSI Length: A longer TSI period smooths out noise but may lag in identifying trends. A shorter period is more responsive but can generate false signals.
- SuperTrend Length: A shorter length provides quicker signals but can be prone to whipsaws. A longer length is more reliable but may delay entries and exits.
- SuperTrend Factor: A higher factor increases the distance of the SuperTrend from the price, reducing sensitivity to minor price fluctuations.
- Trade Direction: Allows flexibility in trading strategies by enabling both long and short trades based on market conditions.
- Take Profit and Stop Loss: These settings manage risk by automatically closing trades at predefined profit or loss levels. Higher percentages provide larger potential gains but also higher risk.

HMA Crossover 1H with RSI, Stochastic RSI, and Trailing StopThe strategy script provided is a trading algorithm designed to help traders make informed buy and sell decisions based on certain technical indicators. Here’s a breakdown of what each part of the script does and how the strategy works:
Key Components:
Hull Moving Averages (HMA):
HMA 5: This is a Hull Moving Average calculated over 5 periods. HMAs are used to smooth out price data and identify trends more quickly than traditional moving averages.
HMA 20: This is another HMA but calculated over 20 periods, providing a broader view of the trend.
Relative Strength Index (RSI):
RSI 14: This is a momentum oscillator that measures the speed and change of price movements over a 14-period timeframe. It helps identify overbought or oversold conditions in the market.
Stochastic RSI:
%K: This is the main line of the Stochastic RSI, which combines the RSI and the Stochastic Oscillator to provide a more sensitive measure of overbought and oversold conditions. It is smoothed with a 3-period simple moving average.
Trading Signals:
Buy Signal:
Generated when the 5-period HMA crosses above the 20-period HMA, indicating a potential upward trend.
Additionally, the RSI must be below 45, suggesting that the market is not overbought.
The Stochastic RSI %K must also be below 39, confirming the oversold condition.
Sell Signal:
Generated when the 5-period HMA crosses below the 20-period HMA, indicating a potential downward trend.
The RSI must be above 60, suggesting that the market is not oversold.
The Stochastic RSI %K must also be above 63, confirming the overbought condition.
Trailing Stop Loss:
This feature helps protect profits by automatically selling the position if the price moves against the trade by 5%.
For sell positions, an additional trailing stop of 100 points is included.

MA MACD BB BackTesterOverview:
This Pine Script™ code provides a comprehensive backtesting tool that combines Moving Average (MA), Moving Average Convergence Divergence (MACD), and Bollinger Bands (BB). It is designed to help traders analyze market trends and make informed trading decisions by testing various strategies over historical data.
Key Features:
1. Customizable Indicators:
Moving Average (MA): Smooths out price data for clearer trend direction.
MACD: Measures trend momentum through MACD Line, Signal Line, and Histogram.
Bollinger Bands (BB): Identifies overbought or oversold conditions with upper and lower bands.
2. Flexible Trading Direction: Choose between long or short positions to adapt to different market conditions.
3. Risk Management: Efficiently allocate your capital with customizable position sizes.
4. Signal Generation:
Buy Signals: Triggered by crossovers for MACD, MA, and BB.
Sell Signals: Triggered by crossunders for MACD, MA, and BB.
5. Automated Trading: Automatically enter and exit trades based on signal conditions and strategy parameters.
How It Works:
1. Indicator Selection: Select your preferred indicator (MA, MACD, BB) and trading direction (Long/Short).
2. Risk Management Configuration: Set the percentage of capital to allocate per position to manage risk effectively.
3.Signal Detection: The algorithm identifies and plots buy/sell signals directly on the chart based on the chosen indicator.
4. Trade Execution: The strategy automatically enters and exits trades based on signal conditions and configured strategy parameters.
Use Cases:
- Backtesting: Evaluate the effectiveness of trading strategies using historical data to understand potential performance.
- Strategy Development: Customize and expand the strategy to incorporate additional indicators or conditions to fit specific trading styles.
ADDONS That Affect Strategy:
1. Indicator Parameters:
Adjustments to the settings of MACD (e.g., fast length, slow length), MA (e.g., length), and BB (e.g., length, multiplier) will directly impact the detection of signals and the strategy's performance.
2. Trading Direction:
Changing the trading direction (Long/Short) will alter the entry and exit conditions based on the detected signals.
3. Risk Management Settings:
Modifying the position size percentage affects capital allocation and overall risk exposure per trade.
ADDONS That Do Not Affect Strategy:
1. Visual Customizations:
Changes to the color, shape, and style of the plotted lines and signals do not impact the core functionality of the strategy but enhance visual clarity.
2. Text and Labels:
Modifying text labels for the signals (such as renaming "Buy MACD" to "MACD Buy Signal") is purely cosmetic and does not influence the strategy’s logic or outcomes.
Notes:
- Customization: The indicator is highly customizable to fit various trading styles and market conditions.
- Risk Management: Adjust position sizes and risk parameters according to your risk tolerance and account size.
- Optimization: Regularly backtest and optimize parameters to adapt to changing market dynamics for better performance.
Getting Started:
-Add the script to your chart.
-Adjust the input parameters to suit your analysis preferences.
-Observe the marked buy and sell signals on your chart to make informed trading decisions.

trend_switch
█ Description
Asset price data was time series data, commonly consisting of trends, seasonality, and noise. Many applicable indicators help traders to determine between trend or momentum to make a better trading decision based on their preferences. In some cases, there is little to no clear market direction, and price range. It feels much more appropriate to use a shorter trend identifier, until clearly defined market trend. The indicator/strategy developed with the notion aims to automatically switch between shorter and longer trend following indicator. There were many methods that can be applied and switched between, however in this indicator/strategy will be limited to the use of predictive moving average and MESA adaptive moving average (Ehlers), by first determining if there is a strong trend identified by calculating the slope, if slope value is between upper and lower threshold assumed there is not much price direction.
█ Formula
// predictive moving average
predict = (2*wma1-wma2)
trigger = (4*predict+3*predict +2*predict *predict)
// MESA adaptive moving average
mama = alpha*src+(1-alpha)*mama
fama = .5*alpha*mama+(1-.5-alpha)*fama
█ Feature
The indicator will have a specified default parameter of:
source = ohlc4
lookback period = 10
threshold = 10
fast limit = 0.5
slow limit = 0.05
Strategy type can be switched between Long/Short only and Long-Short strategy
Strategy backtest period
█ How it works
If slope between the upper (red) and lower (green) threshold line, assume there is little to no clear market direction, thus signal predictive moving average indicator
If slope is above the upper (red) or below the lower (green) threshold line, assume there is a clear trend forming, the signal generated from the MESA adaptive moving average indicator
█ Example 1 - Slope fall between the Threshold - activate shorter trend
█ Example 2 - Slope fall above/below Threshold - activate longer trend

Triple EMA + QQE Trend Following Strategy [TradeDots]The "Triple EMA + QQE Trend Following Strategy" harnesses the power of two sophisticated technical indicators, the Triple Exponential Moving Average (TEMA) and the Qualitative Quantitative Estimation (QQE), to generate precise buy and sell signals. This strategy excels in capturing shifts in trends by identifying short-term price momentum and dynamic overbought or oversold conditions.
HOW IT WORKS
This strategy integrates two pivotal indicators:
Triple Exponential Moving Average (TEMA): TEMA enhances traditional moving averages by reducing lag and smoothing the data more effectively. It achieves this by applying the EMA formula three times onto the price, as follows:
tema(src, length) =>
ema1 = ta.ema(src, length)
ema2 = ta.ema(ema1, length)
ema3 = ta.ema(ema2, length)
tema = 3*ema1 - 3*ema2 + ema3
This computation helps to sharpen the sensitivity to price movements.
Qualitative Quantitative Estimation (QQE): The QQE indicator improves upon the standard RSI by incorporating a smoothing mechanism. It starts with the standard RSI, overlays a 5-period EMA on this RSI, and then enhances the result using a double application of a 27-period EMA. A slow trailing line is then derived by multiplying the result with a factor number. This approach establishes a more refined and less jittery trend-following signal, complementing the TEMA to enhance overall market timing during fluctuating conditions.
APPLICATION
Referenced from insights on "Trading Tact," the strategy implementation follows:
First of all, we utilize two TEMA lines: one set at a 20-period and the other at a 40-period. Then following the rules below:
40-period TEMA is rising
20-period TEMA is above 40-period TEMA
Price closes above 20-period TEMA
Today is not Monday
RSI MA crosses the Slow trailing line
This strategy does not employ an active take profit mechanism; instead, it utilizes a trailing stop loss to allow the price to reach the stop loss naturally, thereby maximizing potential profit margins.
DEFAULT SETUP
Commission: 0.01%
Initial Capital: $10,000
Equity per Trade: 80%
Users are advised to adjust and personalize this trading strategy to better match their individual trading preferences and style.
RISK DISCLAIMER
Trading entails substantial risk, and most day traders incur losses. All content, tools, scripts, articles, and education provided by TradeDots serve purely informational and educational purposes. Past performances are not definitive predictors of future results.
Reference:
Trading Tact. What Is the QQE Indicator? Retrieved from: tradingtact.com

Price and Volume Breakout Buy Strategy [TradeDots]The "Price and Volume Breakout Buy Strategy" is a trading strategy designed to identify buying opportunities by detecting concurrent price and volume breakouts over a specified range of candlesticks.
This strategy is optimized for assets demonstrating high volatility and significant momentum spikes.
HOW IT WORKS
The strategy first takes the specific number of candlesticks as the examination window for both price and volume.
These values are used as benchmarks to identify breakout conditions.
A trade is initiated when both the closing price and the trading volume surpass the maximum values observed within the predetermined window.
Price must be above a designated moving average, serving as the trend indicator, ensuring that all trades align with the prevailing market trend.
APPLICATION
This strategy is particularly effective for highly volatile assets such as Bitcoin and Ethereum, capitalizing on the cues from sudden price and volume breakouts indicative of significant market movement, often driven by market smart money traders.
However, for broader markets like the S&P 500, this strategy may be less effective due to less pronounced volume and price shifts compared to the cryptocurrency markets.
DEFAULT SETUP
Commission: 0.01%
Initial Capital: $10,000
Equity per Trade: 70%
Backtest result sometimes gives fewer than 100 trades under certain higher timeframes, as most trades tend to have a long holding period. Entry conditions are also more stringent, which, combined with the relatively brief history of cryptocurrencies, results in fewer trades on longer timeframes.
Users are advised to adjust and personalize this trading strategy to better match their individual trading preferences and style.
RISK DISCLAIMER
Trading entails substantial risk, and most day traders incur losses. All content, tools, scripts, articles, and education provided by TradeDots serve purely informational and educational purposes. Past performances are not definitive predictors of future results.

Alligator + MA Trend Catcher [TradeDots]The "Alligator + MA Trend Catcher" is a trading strategy that integrates the William Alligator indicator with a Moving Average (MA) to establish robust entry and exit conditions, optimized for capturing trends.
HOW IT WORKS
This strategy combines the traditional William Alligator set up with an additional Moving Average indicator for enhanced trend confirmation, creating a user-friendly backtesting tool for traders who prefer the Alligator method.
The original Alligator strategy can frequently present fluctuations, even in well-established trends, leading to potentially premature exits. To mitigate this, we incorporate a Moving Average as a secondary confirmation measure to ensure the market trend has indeed shifted.
Here’s the operational flow for long orders:
Entry Signal: When the price rises above the Moving Average, it confirms a bullish market state. Enter if Alligator spread in an upward direction. The trade remains active even if the Alligator indicator suggests a trend reversal.
Exit Signal: The position is closed when the price falls below the Moving Average, and the Alligator spreads in the downward direction. This setup helps traders to maintain positions through the entirety of the trend for maximum gain.
APPLICATION
This strategy is tailored for assets with significant, well-defined trends, such as Bitcoin and Ethereum, which are known for their high volatility and substantial price movements.
This strategy offers a low win-rate but high reward configuration, making asset selection critical for long-term profitability. If you choose assets that lack strong price momentum, there's a high chance that this strategy may not be effective.
For traders seeking to maximize gains from large trends without exiting prematurely, this strategy provides an aggressive yet controlled approach to riding out substantial market waves.
DEFAULT SETUP
Commission: 0.01%
Initial Capital: $10,000
Equity per Trade: 80%
RISK DISCLAIMER
Trading entails substantial risk, and most day traders incur losses. All content, tools, scripts, articles, and education provided by TradeDots serve purely informational and educational purposes. Past performances are not definitive predictors of future results.

Stochastic Z-Score Oscillator Strategy [TradeDots]The "Stochastic Z-Score Oscillator Strategy" represents an enhanced approach to the original "Buy Sell Strategy With Z-Score" trading strategy. Our upgraded Stochastic model incorporates an additional Stochastic Oscillator layer on top of the Z-Score statistical metrics, which bolsters the affirmation of potential price reversals.
We also revised our exit strategy to when the Z-Score revert to a level of zero. This amendment gives a much smaller drawdown, resulting in a better win-rate compared to the original version.
HOW DOES IT WORK
The strategy operates by calculating the Z-Score of the closing price for each candlestick. This allows us to evaluate how significantly the current price deviates from its typical volatility level.
The strategy first takes the scope of a rolling window, adjusted to the user's preference. This window is used to compute both the standard deviation and mean value. With these values, the strategic model finalizes the Z-Score. This determination is accomplished by subtracting the mean from the closing price and dividing the resulting value by the standard deviation.
Following this, the Stochastic Oscillator is utilized to affirm the Z-Score overbought and oversold indicators. This indicator operates within a 0 to 100 range, so a base adjustment to match the Z-Score scale is required. Post Stochastic Oscillator calculation, we recalibrate the figure to lie within the -4 to 4 range.
Finally, we compute the average of both the Stochastic Oscillator and Z-Score, signaling overpriced or underpriced conditions when the set threshold of positive or negative is breached.
APPLICATION
Firstly, it is better to identify a stable trading pair for this technique, such as two stocks with considerable correlation. This is to ensure conformance with the statistical model's assumption of a normal Gaussian distribution model. The ideal performance is theoretically situated within a sideways market devoid of skewness.
Following pair selection, the user should refine the span of the rolling window. A broader window smoothens the mean, more accurately capturing long-term market trends, while potentially enhancing volatility. This refinement results in fewer, yet precise trading signals.
Finally, the user must settle on an optimal Z-Score threshold, which essentially dictates the timing for buy/sell actions when the Z-Score exceeds with thresholds. A positive threshold signifies the price veering away from its mean, triggering a sell signal. Conversely, a negative threshold denotes the price falling below its mean, illustrating an underpriced condition that prompts a buy signal.
Within a normal distribution, a Z-Score of 1 records about 68% of occurrences centered at the mean, while a Z-Score of 2 captures approximately 95% of occurrences.
The 'cool down period' is essentially the number of bars that await before the next signal generation. This feature is employed to dodge the occurrence of multiple signals in a short period.
DEFAULT SETUP
The following is the default setup on EURAUD 1h timeframe
Rolling Window: 80
Z-Score Threshold: 2.8
Signal Cool Down Period: 5
Stochastic Length: 14
Stochastic Smooth Period: 7
Commission: 0.01%
Initial Capital: $10,000
Equity per Trade: 40%
FURTHER IMPLICATION
The Stochastic Oscillator imparts minimal impact on the current strategy. As such, it may be beneficial to adjust the weightings between the Z-Score and Stochastic Oscillator values or the scale of Stochastic Oscillator to test different performance outcomes.
Alternative momentum indicators such as Keltner Channels or RSI could also serve as robust confirmations of overbought and oversold signals when used for verification.
RISK DISCLAIMER
Trading entails substantial risk, and most day traders incur losses. All content, tools, scripts, articles, and education provided by TradeDots serve purely informational and educational purposes. Past performances are not definitive predictors of future results.

Fibonacci Trend Reversal StrategyIntroduction
This publication introduces the " Fibonacci Retracement Trend Reversal Strategy, " tailored for traders aiming to leverage shifts in market momentum through advanced trend analysis and risk management techniques. This strategy is designed to pinpoint potential reversal points, optimizing trading opportunities.
Overview
The strategy leverages Fibonacci retracement levels derived from @IMBA_TRADER's lance Algo to identify potential trend reversals. It's further enhanced by a method called " Trend Strength Over Time " (TSOT) (by @federalTacos5392b), which utilizes percentile rankings of price action to measure trend strength. This also has implemented Dynamic SL finder by utilizing @veryfid's ATR Stoploss Finder which works pretty well
Indicators:
Fibonacci Retracement Levels : Identifies critical reversal zones at 23.6%, 50%, and 78.6% levels.
TSOT (Trend Strength Over Time) : Employs percentile rankings across various timeframes to gauge the strength and direction of trends, aiding in the confirmation of Fibonacci-based signals.
ATR (Average True Range) : Implements dynamic stop-loss settings for both long and short positions, enhancing trade security.
Strategy Settings :
- Sensitivity: Set default at 18, adjustable for more frequent or sparse signals based on market volatility.
- ATR Stop Loss Finder: Multiplier set at 3.5, applying the ATR value to determine stop losses dynamically.
- ATR Length: Default set to 14 with RMA smoothing.
- TSOT Settings: Hard-coded to identify percentile ranks, with no user-adjustable inputs due to its intrinsic calculation method.
Trade Direction Options : Configurable to support long, short, or both directions, adaptable to the trader's market assessment.
Entry Conditions :
- Long Entry: Triggered when the price surpasses the mid Fibonacci level (50%) with a bullish TSOT signal.
- Short Entry: Activated when the price falls below the mid Fibonacci level with a bearish TSOT indication.
Exit Conditions :
- Employs ATR-based dynamic stop losses, calibrated according to current market volatility, ensuring effective risk management.
Strategy Execution :
- Risk Management: Features adjustable risk-reward settings and enables partial take profits by default to systematically secure gains.
- Position Reversal: Includes an option to reverse positions based on new TSOT signals, improving the strategy's responsiveness to evolving market conditions.
The strategy is optimized for the BYBIT:WIFUSDT.P market on a scalping (5-minute) timeframe, using the default settings outlined above.
I spent a lot of time creating the dynamic exit strategies for partially taking profits and reversing positions so please make use of those and feel free to adjust the settings, tool tips are also provided.
For Developers: this is published as open-sourced code so that developers can learn something especially on dynamic exits and partial take profits!
Good Luck!
Disclaimer
This strategy is shared for educational purposes and must be thoroughly tested under diverse market conditions. Past performance does not guarantee future results. Traders are advised to integrate this strategy with other analytical tools and tailor it to specific market scenarios. I was only sharing what I've crafted while strategizing over a Solana Meme Coin.

Channels With NVI Strategy [TradeDots]The "Channels With NVI Strategy" is a trading strategy that identifies oversold market instances during a bullish trading market. Specifically, the strategy integrates two principal indicators to deliver profitable opportunities, anticipating potential uptrends.
2 MAIN COMPONENTS
1. Channel Indicators: This strategy gives users the flexibility to choose between Bollinger Band Channels or Keltner Channels. This selection can be made straight from the settings, allowing the traders to adjust the tool according to their preferences and strategies.
2. Negative Volume Indicator (NVI): An indicator that calculates today's price rate of change, but only when today's trading volume is less than the previous day's. This functionality enables users to detect potential shifts in the trading volume with time and price.
ENTRY CONDITION
First, the assets price must drop below the lower band of the channel indicator.
Second, NVI must ascend above the exponential moving average line, signifying a possible flood of 'smart money' (large institutional investors or savvy traders), indicating an imminent price rally.
EXIT CONDITION
Exit conditions can be customized based on individual trading styles and risk tolerance levels. Traders can define their ideal take profit or stop loss percentages.
Moreover, the strategy also employs an NVI-based exit policy. Specifically, if the NVI dips under the exponential moving average – suggestive of a fading trading momentum, the strategy grants an exit call.
RISK DISCLAIMER
Trading entails substantial risk, and most day traders incur losses. All content, tools, scripts, articles, and education provided by TradeDots serve purely informational and educational purposes. Past performances are not definitive predictors of future results.

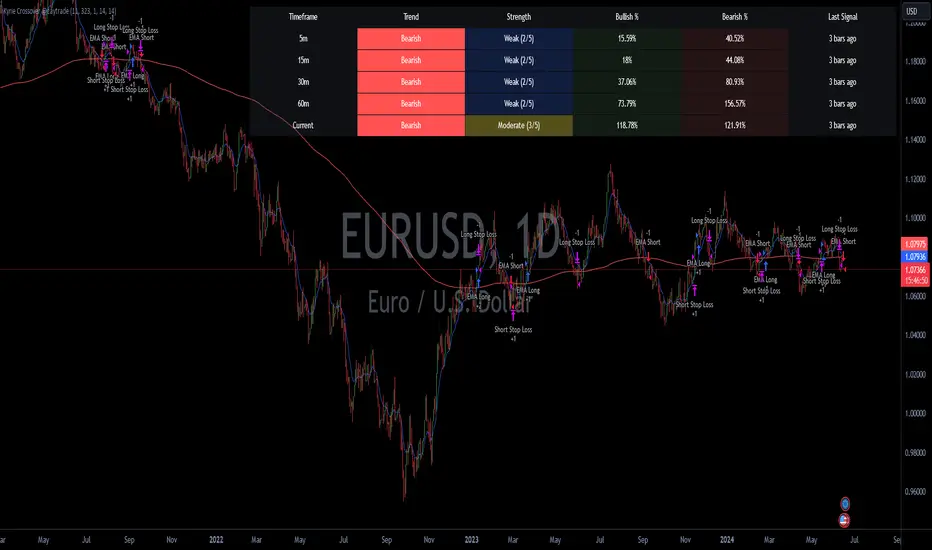
Kyrie Crossover ( @zaytradellc )Unlocking Market Dynamics: Kyrie Crossover Script by @zaytradellc
personalized trading success with the "Kyrie Crossover" script, meticulously crafted by @zaytrade. This innovative Pine Script, tailored to the birthdays of Kyrie and the script creator, combines the power of technical analysis with a touch of personalization to revolutionize your trading experience.
**Exponential Moving Average (EMA) Crossover Strategy:**
At the heart of the "Kyrie Crossover" script lies a sophisticated EMA crossover strategy. By utilizing a 10-period EMA and a 323-period EMA (symbolizing long term price action ), the strategy effectively captures market trends with precision and insight.
- **Short-Term EMA (10-period):** This EMA reacts swiftly to recent price changes, offering heightened sensitivity to short-term fluctuations. It excels in identifying immediate shifts in market sentiment, making it invaluable for pinpointing short-lived trends and potential reversal points.
- **Long-Term EMA (323-period):** In contrast, the long-term EMA provides a broader perspective by smoothing out short-term noise and focusing on longer-term trend direction. Its extended length filters out market noise effectively, providing a clear representation of the underlying trend's momentum and sustainability.
**Directional Movement Index (DMI) Metrics:**
The "Kyrie Crossover" script goes beyond traditional indicators by incorporating DMI metrics across multiple timeframes. By assessing trend strength and direction, traders gain valuable insights into market dynamics, allowing for informed decision-making.
**Simple Instructions to Profit:**
1. **Identify EMA Crossovers:** Look for instances where the short-term EMA (10-period) crosses above the long-term EMA (323-period) for a bullish signal, indicating a potential buying opportunity. Conversely, a crossover where the short-term EMA crosses below the long-term EMA signals a bearish trend and a potential selling opportunity.
2. **Confirm with DMI Metrics:** Validate EMA crossovers by checking DMI metrics across different timeframes (5 minutes, 15 minutes, 30 minutes, and 1 hour). Pay attention to color-coded indicators, with green indicating a bullish trend, red indicating a bearish trend, and white indicating no clear trend.
3. **Manage Risk:** Implement proper risk management techniques, such as setting stop-loss orders and position sizing based on your risk tolerance and trading objectives.
4. **Stay Informed:** Regularly monitor market conditions and adjust your trading strategy accordingly based on new signals and emerging trends.
CVD Divergence Strategy.1.mmThis is the matching Strategy version of Indicator of the same name.
As a member of the K1m6a Lions discussion community we often use versions of the Cumulative Volume Delta indicator
as one of our primary tools along with RSI, RSI Divergences, Open interest, Volume Profile, TPO and Fibonacci levels.
We also discuss visual interpretations of CVD Divergences across multiple time frames much like RSI divergences.
RSI Divergences can be identified as possible Bullish reversal areas when the RSI is making higher low points while
the price is making lower low points.
RSI Divergences can be identified as possible Bearish reversal areas when the RSI is making lower high points while
the price is making higher high points.
CVD Divergences can also be identified the same way on any timeframe as possible reversal signals. As with RSI, these Divergences
often occur as a trend's momentum is giving way to lower volume and areas when profits are being taken signaling a possible reversal
of the current trending price movement.
Hidden Divergences are identified as calculations that may be signaling a continuation of the current trend.
Having not found any public domain versions of a CVD Divergence indicator I have combined some public code to create this
indicator and matching strategy. The calculations for the Cumulative Volume Delta keep a running total for the differences between
the positive changes in volume in relation to the negative changes in volume. A relative upward spike in CVD is created when
there is a large increase in buying vs a low amount of selling. A relative downward spike in CVD is created when
there is a large increase in selling vs a low amount of buying.
In the settings menu, the is a drop down to be used to view the results in alternate timeframes while the chart remains on current timeframe. The Lookback settings can be adjusted so that the divs show on a more local, spontaneous level if set at 1,1,60,1. For a deeper, wider view of the divs, they can be set higher like 7,7,60,7. Adjust them all to suit your view of the divs.
To create this indicator/strategy I used a portion of the code from "Cumulative Volume Delta" by @ contrerae which calculates
the CVD from aggregate volume of many top exchanges and plots the continuous changes on a non-overlay indicator.
For the identification and plotting of the Divergences, I used similar code from the Tradingview Technical "RSI Divergence Indicator"
This indicator should not be used as a stand-alone but as an additional tool to help identify Bullish and Bearish Divergences and
also Bullish and Bearish Hidden Divergences which, as opposed to regular divergences, may indicate a continuation.

Strategy / Connectable [Azullian]The connectable strategy serves as a foundational component in our indicator system on TradingView, designed for intuitive testing, visualization, and construction of trading strategies. In concert with the connectable signal filter , it forms a cohesive unit that allows for efficient signal processing and strategy implementation. This integration enables the strategy to receive and act on weighted signals from various connectable indicators, making it a versatile tool for both novice and experienced traders.
Let's review the separate parts of this indicator.
█ STRATEGY INPUTS
We've provided an input to connect a signal filter or indicators or chains (→) which is set to 'Close' by default.
An input has several controls:
• Input: Connect indicators or signal filter here, choose indicators with a compatible : Signal connector.
• SM - Signal Mode: Choose a trading direction compatible with the settings in your signal filter
█ POSITION INVESTMENT
Determine the percentage of your trading budget you would like to use in each position based on the strategy's profit or loss.
• LINVB - Loss Investment Base: Choose which base to use to determine the investment percentage when the strategy is in a loss.
○ Equity: Use the equity as the base for percentage calculation.
○ Initial capital: Use the initial capital as the base for percentage calculation.
• LINV% - Loss Investment Percentage: Set a percentage of the chosen investment base as the investment for a new position.
○ For example, when 10% in loss, and a initial capital of $100, and the investment base is set to equity with a percentage of 50%, your investment will be 50% of $90, $45.
• PINVB - Profit Investment Base: Choose which base to use to determine the investment percentage when the strategy is in profit.
○ Equity: Use the equity as the base for percentage calculation.
○ Initial capital: Use the initial capital as the base for percentage calculation.
• PINV% - Profit Investment Percentage: Set a percentage of the chosen investment base as the investment for a new position.
○ For example, when 10% in profit, and an initial capital of $100, and the investment base is set to equity with a percentage of 100%, your investment will be 100% of $110, $110.
• RISK% - Risk Percentage:
○ Determine how much of the calculated position investment is at risk when the stop-loss is hit.
- For example, 1% of $45 represents a maximum loss of $0.45.
○ Risk percentage works together with the stop loss and the max leverage.
• MXLVG - Maximum Leverage:
○ Investigate the trading rules for your trading pair and use the maximum allowed amount of leverage.
○ To determine the number of contracts to be bought or sold, considering the stop loss and the specified risk percentage, the maximum leverage available will constrain the amount of leverage utilized to ensure that the maximum risk threshold is not exceeded. For instance, suppose the stop loss is set at 1%, and the risk percentage is defined as 10%. Initially, the calculated leverage to be used would be 10. However, if there is a maximum leverage cap set at 5, it would constrain the calculated leverage of 10 to adhere to the maximum limit of 5.
█ EXIT STOP LOSS
Determine the Stop Loss price based on your selected configuration.
As the stop loss is an integral part of the ordered contracts calculation used in conjunction with the Risk and Max leverage, you'll always need to provide a stop loss price.
• SLB - Stop Loss Base: Choose a stop loss mode for calculating stop loss prices.
○ Risk: Determines the price using the Risk parameter (RISK%) and maximum leverage (MXLVG). In this case, SLB% will not have any impact.
○ Price Entry + Offset: Calculates the stop loss price based on a offset percentage (SLB%) from the entry price of the position.
• SLB% - Stop Loss Base Percentage: Define an offset percentage that will be applied in the price entry + offset stop loss mode.
• SLT - Stop Loss Trailing:
○ Fixed: The initial stop loss will be kept and no trailing stop loss will be applied.
○ Trail Price: Computes the trailing stop loss price based on an offset percentage (SLT%) from the closing price of the current candle.
- If a better stop loss price is calculated, it will be set as the new stop loss price.
○ Trail Incr: Adapts the trailing stop loss price based on the offset percentage (SLT%).
- Each price change in favor of your position will incrementally adapt the trailing stop loss with SLT%.
• SLT% - Stop Loss Trailing Percentage: This percentage serves as an offset or increment depending on your chosen trailing mode.
█ EXIT TAKE PROFIT
Determine the Take Profit price based on your selected configuration.
• TPB - Take Profit Base: Choose a take profit mode for calculating take profit prices.
○ Reward: Determines the take profit price using the Risk parameter (RISK%) and the calculated Stop Loss price and the set reward percentage (TPB%).
- For example: Risk 1%, Calculated Stop loss price: $90, Entry price: $100, Reward (TPB%): 2%, will result in a take profit price on $120.
○ Price Entry + Offset: Calculates the take profit price based on a offset percentage (TPB%) from the entry price of the position.
- For example: Entry price: $100, Offset (TPB%): 2%, will result in a take profit price on $102.
• TPB% - Take Profit Base Percentage: Define an offset percentage that will be applied in the price entry + offset take profit mode.
• TPT - Take Profit Trailing:
○ Fixed: The initial take profit will be kept and no trailing take profit will be applied.
○ Trail Price: Computes the trailing take profit price based on an offset percentage (TPT%) from the closing price of the current candle.
- If an applicable take profit price is calculated, it will be set as the new take profit price.
○ Trail Incr: Adapts the trailing take profit price based on the offset percentage (TPT%). Each price change against your position will incrementally adapt the trailing take profit with TPT%.
• TPT% - Take Profit Trailing Percentage: This percentage serves as an offset or increment depending on your chosen trailing mode.
█ STRATEGY CONDITIONS
Specify when the strategy is permitted to execute trades.
• DATE: Enable the Date Range filter to restrict entries to a specific date range.
○ START: Set a start date and hour to commence trading.
○ END: Set an end date and hour to conclude trading within the defined range.
■ VISUALS
• LINE: Activate a colored dashed diagonal line to visually connect the entry and exit points of positions.
• SLTP: Enable visualization of stop loss, take profit, and break-even levels.
• PNL: Enable Break-Even and Close Lines along with a colored area in between to visualize profit and loss.
• ☼: Brightness % : Adjust the opacity of the plotted trading visuals.
• P - Profit Color : Choose the color for profit-related elements.
• L - Loss Color: Choose the color for loss-related elements.
• B - Breakeven Color : Select the color for break-even points.
• EL - Long Color: Specify the color for long positions.
• ES - Short Color: Specify the color for short positions.
• TRADE LABELING: For better analysis we've labeled all entries and exits conform with the type of order your strategy has executed, some examples:
○ XL-TP-150: Exit Long - Take Profit - Position 150
○ XS-TP-154: Exit Short - Take Profit - Position 154
○ XL-SL-160: Exit Long - Stop Loss - Position 160
○ XS-SL-164: Exit Short - Stop Loss - Position 164
█ USAGE OF CONNECTABLE INDICATORS
■ Connectable chaining mechanism
Connectable indicators can be connected directly to the signal monitor, signal filter or strategy , or they can be daisy chained to each other while the last indicator in the chain connects to the signal monitor, signal filter or strategy. When using a signal filter you can chain the filter to the strategy input to make your chain complete.
• Direct chaining: Connect an indicator directly to the signal monitor, signal filter or strategy through the provided inputs (→).
• Daisy chaining: Connect indicators using the indicator input (→). The first in a daisy chain should have a flow (⌥) set to 'Indicator only'. Subsequent indicators use 'Both' to pass the previous weight. The final indicator connects to the signal monitor, signal filter, or strategy.
■ Set up the strategy with a signal filter and an RSI indicator
Let's connect the Strategy to a connectable signal filter and a connectable RSI indicator :
1. Load all relevant indicators
• Load RSI / Connectable
• Load Signal filter / Connectable
• Load Strategy / Connectable
2. Signal Filter: Connect the RSI to the Signal Filter
• Open the signal filter settings
• Choose one of the three input dropdowns (1→, 2→, 3→) and choose : RSI / Connectable: Signal Connector
• Toggle the enable box before the connected input to enable the incoming signal
3. Signal Filter: Update the filter signals settings if needed
• The default settings of the filter enable EL (Enter Long), XL (Exit Long), ES (Enter Short) and XS (Exit Short).
4. Signal Filter: Update the weight threshold settings if needed
• All connectable indicators load by default with a score of 6 for each direction (EL, XL, ES, XS)
• By default, weight threshold (TH) is set at 5. This allows each occurrence to score, as the default score in each connectable indicator is 1 point above the threshold. Adjust to your liking.
5. Strategy: Connect the strategy to the signal filter in the strategy settings
• Select the strategy input → and select the Signal filter: Signal connector
6. Strategy: Enable filter compatible directions
• Set the signal mode of the strategy to a compatible direction with the signal filter.
Now that everything is connected, you'll notice green spikes in the signal filter representing long signals, and red spikes indicating short signals. Trades will also appear on the chart, complemented by a performance overview. Your journey is just beginning: delve into different scoring mechanisms, merge diverse connectable indicators, and craft unique chains. Instantly test your results and discover the potential of your configurations. Dive deep and enjoy the process!
█ BENEFITS
• Adaptable Modular Design: Arrange indicators in diverse structures via direct or daisy chaining, allowing tailored configurations to align with your analysis approach.
• Streamlined Backtesting: Simplify the iterative process of testing and adjusting combinations, facilitating a smoother exploration of potential setups.
• Intuitive Interface: Navigate TradingView with added ease. Integrate desired indicators, adjust settings, and establish alerts without delving into complex code.
• Signal Weight Precision: Leverage granular weight allocation among signals, offering a deeper layer of customization in strategy formulation.
• Advanced Signal Filtering: Define entry and exit conditions with more clarity, granting an added layer of strategy precision.
• Clear Visual Feedback: Distinct visual signals and cues enhance the readability of charts, promoting informed decision-making.
• Standardized Defaults: Indicators are equipped with universally recognized preset settings, ensuring consistency in initial setups across different types like momentum or volatility.
• Reliability: Our indicators are meticulously developed to prevent repainting. We strictly adhere to TradingView's coding conventions, ensuring our code is both performant and clean.
█ COMPATIBLE INDICATORS
Each indicator that incorporates our open-source 'azLibConnector' library and adheres to our conventions can be effortlessly integrated and used as detailed above.
For clarity and recognition within the TradingView platform, we append the suffix ' / Connectable' to every compatible indicator.
█ COMMON MISTAKES AND CLARIFICATIONS
• Removing an indicator from a chain: Deleting a linked indicator and confirming the "remove study tree" alert will also remove all underlying indicators in the object tree. Before removing one, disconnect the adjacent indicators and move it to the object stack's bottom.
• Point systems: The azLibConnector provides 500 points for each direction (EL: Enter long, XL: Exit long, ES: Enter short, XS: Exit short) Remember this cap when devising a point structure.
• Flow misconfiguration: In daisy chains the first indicator should always have a flow (⌥) setting of 'indicator only' while other indicator should have a flow (⌥) setting of 'both'.
• Recalculate: While this strategy has undergone extensive testing, enabling recalculation options like 'After order is filled' or 'On every tick' may lead to unexpected behavior.
• Fill orders: The strategy is thoroughly tested, yet enabling fill order options such as 'Using bar magnifier', 'On bar close', or 'Using standard OHLC' might result in unexpected outcomes.
• Layout and abbreviations: To maintain a consistent structure, we use abbreviations for each input. While this may initially seem complex, you'll quickly become familiar with them. Each abbreviation is also explained in the inline tooltips.
• Optimized for crypto trading: While many principles are common across markets, this strategy is specifically optimized and tested for crypto trading.
• Inputs: Connecting a connectable indicator directly to the strategy delivers the raw signal without a weight threshold, meaning every signal will trigger a trade.
█ A NOTE OF GRATITUDE
Through years of exploring TradingView and Pine Script, we've drawn immense inspiration from the community's knowledge and innovation. Thank you for being a constant source of motivation and insight.
█ RISK DISCLAIMER
Azullian's content, tools, scripts, articles, and educational offerings are presented purely for educational and informational uses. Please be aware that past performance should not be considered a predictor of future results.

Long EMA Strategy with Advanced Exit OptionsThis strategy is designed for traders seeking a trend-following system with a focus on precision and adaptability.
**Core Strategy Concept**
The essence of this strategy lies in use of Exponential Moving Averages (EMAs) to identify potential long (buy) positions based on the relative positions of short-term, medium-term, and long-term EMAs. The use of EMAs is a classic yet powerful approach to trend detection, as these indicators smooth out price data over time, emphasizing the direction of recent price movements and potentially signaling the beginning of new trends.
**Customizable Parameters**
- **EMA Periods**: Users can define the periods for three EMAs - long-term, medium-term, and short-term - allowing for a tailored approach to capture trends based on individual trading styles and market conditions.
- **Volatility Filter**: An optional Average True Range (ATR)-based volatility filter can be toggled on or off. When activated, it ensures that trades are only entered when market volatility exceeds a user-defined threshold, aiming to filter out entries during low-volatility periods which are often characterized by indecisive market movements.
- **Trailing Stop Loss**: A trailing stop loss mechanism, expressed as a percentage of the highest price achieved since entry, provides a dynamic way to manage risk by allowing profits to run while cutting losses.
- **EMA Exit Condition**: This advanced exit option enables closing positions when the short-term EMA crosses below the medium-term EMA, serving as a signal that the immediate trend may be reversing.
- **Close Below EMA Exit**: An additional exit condition, which is disabled by default, allows positions to be closed if the price closes below a user-selected EMA. This provides an extra layer of flexibility and risk management, catering to traders who prefer to exit positions based on specific EMA thresholds.
**Operational Mechanics**
Upon activation, the strategy evaluates the current price in relation to the set EMAs. A long position is considered when the current price is above the long-term EMA, and the short-term EMA is above the medium-term EMA. This setup aims to identify moments where the price momentum is strong and likely to continue.
The strategy's versatility is further enhanced by its optional settings:
- The **Volatility Filter** adjusts the sensitivity of the strategy to market movements, potentially improving the quality of the entries during volatile market conditions.
The Average True Range (ATR) is a key component of this filter, providing a measure of market volatility by calculating the average range between the high and low prices over a specified number of periods. Here's how you can adjust the volatility filter settings for various market conditions, focusing on filtering out low-volatility markets:
Setting Examples for Volatility Filter
1. High Volatility Markets (e.g., Cryptocurrencies, Certain Forex Pairs):
ATR Periods: 14 (default)
ATR Multiplier: Setting the multiplier to a lower value, such as 1.0 or 1.2, can be beneficial in high-volatility markets. This sensitivity allows the strategy to react to volatility changes more quickly, ensuring that you're entering trades during periods of significant movement.
2. Medium Volatility Markets (e.g., Major Equity Indices, Medium-Volatility Forex Pairs):
ATR Periods: 14 (default)
ATR Multiplier: A multiplier of 1.5 (default) is often suitable for medium volatility markets. It provides a balanced approach, ensuring that the strategy filters out low-volatility conditions without being overly restrictive.
3. Low Volatility Markets (e.g., Some Commodities, Low-Volatility Forex Pairs):
ATR Periods: Increasing the ATR period to 20 or 25 can smooth out the volatility measure, making it less sensitive to short-term fluctuations. This adjustment helps in focusing on more significant trends in inherently stable markets.
ATR Multiplier: Raising the multiplier to 2.0 or even 2.5 increases the threshold for volatility, effectively filtering out low-volatility conditions. This setting ensures that the strategy only triggers trades during periods of relatively higher volatility, which are more likely to result in significant price movements.
How to Use the Volatility Filter for Low-Volatility Markets
For traders specifically interested in filtering out low-volatility markets, the key is to adjust the ATR Multiplier to a higher level. This adjustment increases the threshold required for the market to be considered sufficiently volatile for trade entries. Here's a step-by-step guide:
Adjust the ATR Multiplier: Increase the ATR Multiplier to create a higher volatility threshold. A multiplier of 2.0 to 2.5 is a good starting point for very low-volatility markets.
Fine-Tune the ATR Periods: Consider lengthening the ATR calculation period if you find that the strategy is still entering trades in undesirable low-volatility conditions. A longer period provides a more averaged-out measure of volatility, which might better suit your needs.
Monitor and Adjust: Volatility is not static, and market conditions can change. Regularly review the performance of your strategy in the context of current market volatility and adjust the settings as necessary.
Backtest in Different Conditions: Before applying the strategy live, backtest it across different market conditions with your adjusted settings. This process helps ensure that your approach to filtering low-volatility conditions aligns with your trading objectives and risk tolerance.
By fine-tuning the volatility filter settings according to the specific characteristics of the market you're trading in, you can enhance the performance of this strategy
- The **Trailing Stop Loss** and **EMA Exit Conditions** provide two layers of exit strategies, focusing on capital preservation and profit maximization.
**Visualizations**
For clarity and ease of use, the strategy plots the three EMAs and, if enabled, the ATR threshold on the chart. These visual cues not only aid in decision-making but also help in understanding the market's current trend and volatility state.
**How to Use**
Traders can customize the EMA periods to fit their trading horizon, be it short, medium, or long-term trading. The volatility filter and exit options allow for further customization, making the strategy adaptable to different market conditions and personal risk tolerance levels.
By offering a blend of trend-following principles with advanced risk management features, this strategy aims to cater to a wide range of trading styles, from cautious to aggressive. Its strength lies in its flexibility, allowing traders to fine-tune settings to their specific needs, making it a potentially valuable tool in the arsenal of any trader looking for a disciplined approach to navigating the markets.

Bollinger and Stochastic with Trailing Stop - D.M.P.This trading strategy combines Bollinger Bands and the Stochastic indicator to identify entry opportunities in oversold and overbought conditions in the market. The aim is to capitalize on price rebounds from the extremes defined by the Bollinger Bands, with the confirmation of the Stochastic to maximize the probability of success of the operations.
Indicators Used
- Bollinger Bands Used to measure volatility and define oversold and overbought levels. When the price touches or breaks through the lower band, it indicates a possible oversold condition. Similarly, when it touches or breaks through the upper band, it indicates a possible overbought condition.
- Stochastic: A momentum oscillator that compares the closing price of an asset with its price range over a certain period. Values below 20 indicate oversold, while values above 80 indicate overbought.
Strategy Logic
- Long Entry (Buy): A purchase operation is executed when the price closes below the lower Bollinger band (indicating oversold) and the Stochastic is also in the oversold zone.
- Short Entry (Sell): A sell operation is executed when the price closes above the upper Bollinger band (indicating overbought) and the Stochastic is in the overbought zone.
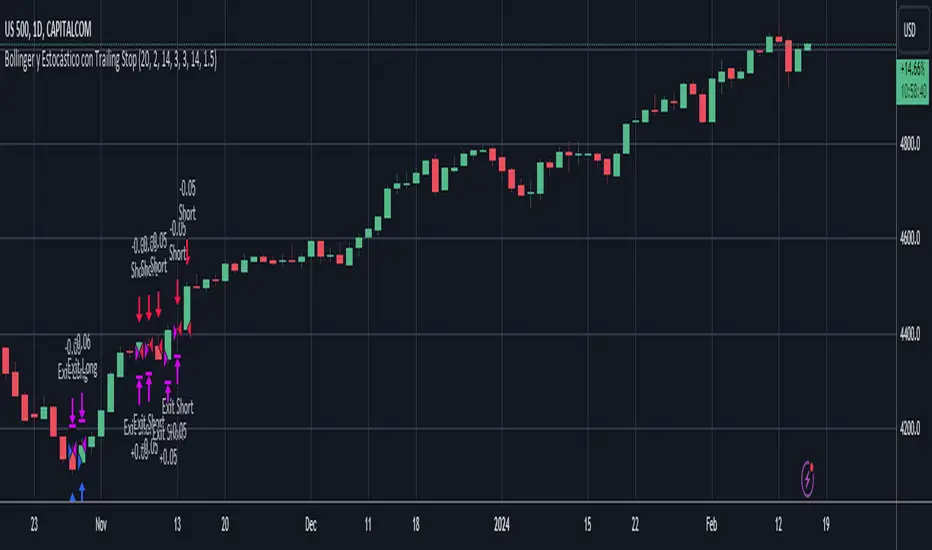
FlexiMA x FlexiST - Strategy [presentTrading]█ Introduction and How it is Different
The FlexiMA x FlexiST Strategy blends two analytical methods - FlexiMA and FlexiST, which are opened in my early post.
- FlexiMA calculates deviations between an indicator source and a dynamic moving average, controlled by a starting factor and increment factor.
- FlexiST, on the other hand, leverages the SuperTrend model, adjusting the Average True Range (ATR) length for a comprehensive trend-following oscillator.
This synergy offers traders a more nuanced and multifaceted tool for market analysis.
BTC 6H L/S Performance
Local
█ Strategy, How It Works: Detailed Explanation
The strategy combines two components: FlexiMA and FlexiST, each utilizing unique methodologies to analyze market trends.
🔶FlexiMA Component:
- Calculates deviations between an indicator source and moving averages of variable lengths.
- Moving average lengths are dynamically adjusted using a starting factor and increment factor.
- Deviations are normalized and analyzed to produce median and standard deviation values, forming the FlexiMA oscillator.
Length indicator (50)
🔶FlexiST Component:
- Uses SuperTrend indicators with varying ATR (Average True Range) lengths.
- Trends are identified based on the position of the indicator source relative to the SuperTrend bands.
- Deviations between the indicator source and SuperTrend values are calculated and normalized.
Starting Factor (5)
🔶Combined Strategy Logic:
- Entry Signals:
- Long Entry: Triggered when median values of both FlexiMA and FlexiST are positive.
- Short Entry: Triggered when median values of both FlexiMA and FlexiST are negative.
- Exit Signals:
- Long Exit: Triggered when median values of FlexiMA or FlexiST turn negative.
- Short Exit: Triggered when median values of FlexiMA or FlexiST turn positive.
This strategic blend of FlexiMA and FlexiST allows for a nuanced analysis of market trends, providing traders with signals based on a comprehensive view of market momentum and trend strength.
█ Trade Direction
The strategy is designed to cater to various trading preferences, offering "Long", "Short", and "Both" options. This flexibility allows traders to align the strategy with their specific market outlook, be it bullish, bearish, or a combination of both.
█ Usage
Traders can effectively utilize the FlexiMA x FlexiST Strategy by first selecting their desired trade direction. The strategy then generates entry signals when the conditions for either the FlexiMA or FlexiST are met, indicating potential entry points in the market. Conversely, exit signals are generated when the conditions for these indicators diverge, thus signaling a potential shift in market trends and suggesting a strategic exit point.
█ Default Settings
1. Indicator Source (HLC3): Provides a balanced and stable price source, reducing the impact of extreme market fluctuations.
2. Indicator Lengths (20 for FlexiMA, 10 for FlexiST): Longer FlexiMA length smooths out short-term fluctuations, while shorter FlexiST length allows for quicker response to market changes.
3. Starting Factors (1.0 for FlexiMA, 0.618 for FlexiST): Balanced start for FlexiMA and a harmonized approach for FlexiST, resonating with natural market cycles.
4. Increment Factors (1.0 for FlexiMA, 0.382 for FlexiST): FlexiMA captures a wide range of market behaviors, while FlexiST provides a gradual transition to capture finer trend shifts.
5. Normalization Methods ('None'): Uses raw deviations, suitable for markets where absolute price movements are more significant.
6. Trade Direction ('Both'): Allows strategy to consider both long and short opportunities, ideal for versatile market engagement.
*More details:
1. FlexiMA
2. FlexiST

FlexiSuperTrend - Strategy [presentTrading]█ Introduction and How it is Different
The "FlexiSuperTrend - Strategy" by PresentTrading is a cutting-edge trading strategy that redefines market analysis through the integration of the SuperTrend indicator and advanced variance tracking.
BTC 6H L/S
This strategy stands apart from conventional methods by its dynamic adaptability, capturing market trends and momentum shifts with increased sensitivity. It's designed for traders seeking a more responsive tool to navigate complex market movements.
Local
█ Strategy, How It Works: Detailed Explanation
The "FlexiSuperTrend - Strategy" employs a multifaceted approach, combining the adaptability of the SuperTrend indicator with variance tracking. The strategy's core lies in its unique formulation and application of these components:
🔶 SuperTrend Polyfactor Oscillator:
- Basic Concept: The oscillator is a series of SuperTrend calculations with varying ATR lengths and multipliers. This approach provides a broader and more nuanced perspective of market trends.
- Calculation:
- For each iteration, `i`, the SuperTrend is calculated using:
- `ATR Length = indicatorLength * (startingFactor + i * incrementFactor)`.
- `Multiplier = dynamically adjusted based on market conditions`.
- The SuperTrend output for each iteration is compared with the indicator source (like hlc3), and the deviation is recorded.
SuperTrend Calculation:
- `Upper Band (UB) = hl2 + (ATR Length * Multiplier)`
- `Lower Band (LB) = hl2 - (ATR Length * Multiplier)`
- Where `hl2` is the average of high and low prices.
Deviation Calculation:
- `Deviation = indicatorSource - SuperTrend Value`
- This value is calculated for each SuperTrend setting in the oscillator series.
🔶 Indicator Source (`hlc3`):
- **Usage:** The strategy uses the average of high, low, and close prices, providing a balanced representation of market activity.
🔶 Adaptive ATR Lengths and Factors:
- Dynamic Adjustment: The strategy adjusts the ATR length and multiplier based on the `startingFactor` and `incrementFactor`. This adaptability is key in responding to changing market volatilities.
- Equation: ATR Length at each iteration `i` is given by `len = indicatorLength * (startingFactor + i * incrementFactor)`.
incrementFactor - 1
incrementFactor - 2
🔶 Normalization Methods:
Purpose: To standardize the deviations for comparability.
- Methods:
- 'Max-Min': Scales the deviation based on the range of values.
- 'Absolute Sum': Uses the sum of absolute deviations for normalization.
Normalization 'Absolute Sum'
- For 'Max-Min': `Normalized Deviation = (Deviation - Min(Deviations)) / (Max(Deviations) - Min(Deviations))`
- For 'Absolute Sum': `Normalized Deviation = Deviation / Sum(Absolute(Deviations))`
🔶 Trading Logic:
The strategy integrates the SuperTrend indicator, renowned for its effectiveness in identifying trend direction and reversals. The SuperTrend's incorporation enhances the strategy's ability to filter out false signals and confirm genuine market trends. * The SuperTrend Toolkit is made by @QuantiLuxe
- Long Entry Conditions: A buy signal is generated when the current trend, as indicated by the SuperTrend Polyfactor Oscillator, turns positive.
- Short Entry Conditions: A sell signal is triggered when the current trend turns negative.
- Entry and Exit Strategy: The strategy opens or closes positions based on these signals, aligning with the selected trade direction (long, short, or both).
█ Trade Direction
The strategy is versatile, allowing traders to choose their preferred trading direction: long, short, or both. This flexibility enables traders to tailor their strategies to their market outlook and risk appetite.
█ Usage
The FlexiSuperTrend strategy is suitable for various market conditions and can be adapted to different asset classes and time frames. Traders should set the strategy parameters according to their risk tolerance and trading goals. It's particularly useful for capturing long-term movements, ideal for swing traders, yet adaptable for short-term trading strategies.
█ Default Settings
1. Trading Direction: Choose from "Long", "Short", or "Both" to define the trade type.
2. Indicator Source (HLC3): Utilizes the HLC3 as the primary price reference.
3. Indicator Length (Default: 10): Influences the moving average calculation and trend sensitivity.
4. Starting Factor (0.618): Initiates the ATR length, influenced by Fibonacci ratios.
5. Increment Factor (0.382): Adjusts the ATR length incrementally for dynamic trend tracking.
6. Normalization Method: Options include "None", "Max-Min", and "Absolute Sum" for scaling deviations.
7. SuperTrend Settings: Varied ATR lengths and multipliers tailor the indicator's responsiveness.
8. Additional Settings: Features mesh style plotting and customizable colors for visual distinction.
The default settings provide a balanced approach, but users are encouraged to adjust them based on their individual trading style and market analysis.

Ehlers Combo Strategy🚀 Presenting the Enhanced Ehlers Combo Strategy 🚀
Hello Traders! 👋 I'm thrilled to share the latest version of the Ehlers Combo Strategy v2.0. This powerful algorithm combines Ehlers Elegant Oscillator, Decycler, Instantaneous Trendline, Spearman Rank, and introduces the Signal to Noise Ratio for even more precise trading signals.
📊 Strategy Highlights:
Ehlers Elegant Oscillator: Captures market momentum and turning points.
Ehlers Decycler: Filters out market noise for clearer trend signals.
Instantaneous Trendline: Offers a dynamic view of the market trend.
Spearman Rank: Analyzes market rank correlations for enhanced insights.
Signal to Noise Ratio (SNR): Filters out noise for more accurate signals.
💡 Key Features & Customizations:
Adaptive Length: Enable adaptive length based on the market's current conditions.
SNR Threshold: Set your desired SNR threshold for filtering signals.
Exit Length: Define the length for exit signals.
📈 Trading Signals:
Long Entry: Elegant Oscillator and Decycler cross above 0, source crosses above Decycler, source is greater than an increasing Instantaneous Trendline, Spearman Rank is positive, and SNR exceeds the threshold.
Long Exit: Source crosses below the Instantaneous Trendline after entering a long position.
Short Entry: Elegant Oscillator and Decycler cross below 0, source crosses below Decycler, source is less than a decreasing Instantaneous Trendline, Spearman Rank is negative, and SNR exceeds the threshold.
Short Exit: Source crosses above the Instantaneous Trendline after entering a short position.
📊 Insights & Enhancements:
Dynamic Length: The strategy adapts its length dynamically based on market conditions.
Improved SNR: Signal to Noise Ratio ensures better filtering of signals.
Enhanced Visualization: The Elegant Oscillator now features improved color coding for a clearer interpretation.
🚨 Disclaimer:
Trading involves risk, and this script should be used judiciously. It's not a guaranteed profit machine, but with careful use, it can be a valuable addition to your toolkit.
Feel free to backtest, tweak, and make it your own! Let's conquer the markets together! 💪📈
🚀✨ Happy Trading! ✨🚀
---
🙌 Credits:
A big shoutout to the original contributors:
@blackcat1402
@cheatcountry
@DasanC
