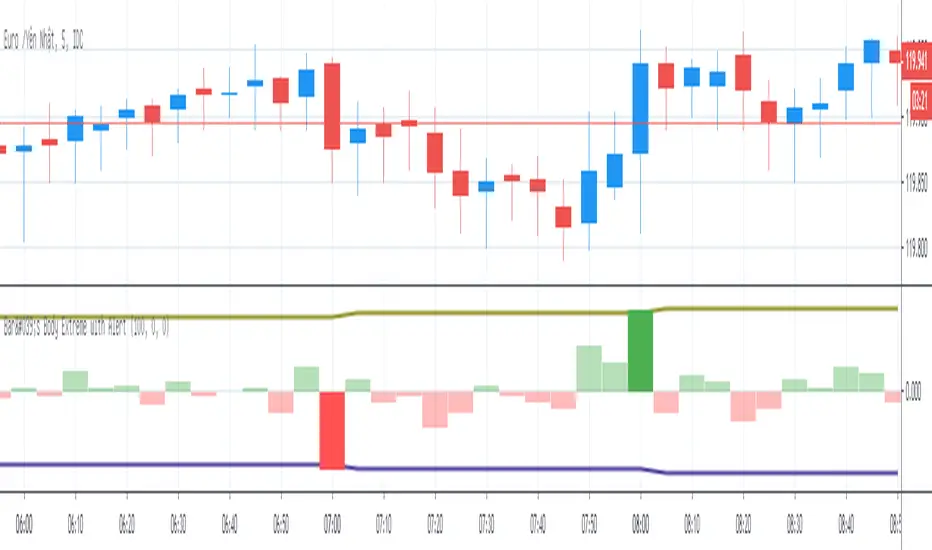
Bar's Body Extreme with AlertBar's Body Extreme with Alert measure volatility of bar's body and caculate extreme level in specified periods or custom level with alert. Detail options below:
1. Default Extreme Level
* Default level is the +/- highest volatility of bar's body in 100 periods
* Periods of bar to calculate default extreme adjustable
2. Custom Extreme
* Default Extreme Top auto disable if Custom Extreme Top >0
* Default Extreme Bottom auto disable if Custom Extreme Bottom <0
3. Alert
* Extreme alert: body's volatility > Extreme top level or body's volatility < Extreme bottom level
* Extreme Top Alert: body's volatility > Extreme top level
* Extreme Bottom Alert: body's volatility < Extreme bottom level
Cari skrip untuk "bar"
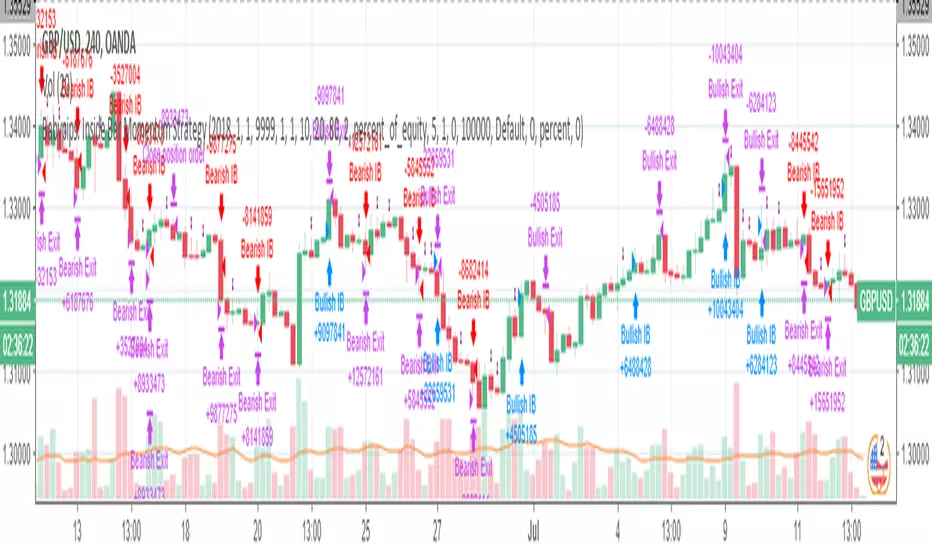
Babypips: Inside Bar Momentum StrategyThe strategy contained in this post comes courtesy of babypips (.com), an excellent resource for all thing forex related. If you are new to trading, the site is definitely worth checking out!
Code commentary and an introduction to Inside Bars are available for this post on the Backtest-Rookies (.com) website.
Note: If you are interested in custom development services, please check out our services page on the Backtest-Rookies site.
Strategy Overview
Inside Bar Momentum Strategy.
Inside Bar Detection
Position sizing based on stoploss distance ( Note: Based on equity and assumes that the account currency is the counter currency.
Stop buys for entries
Takeprofit / Stoplosses for exits
Control Stopbuy, Takeprofit and Stoploss targets with inputs
Control Backtest start/end dates
Volume Strength Candles / Colored BarsIs Price Action Higher or Lower on STRONG or WEAK VOLUME from lookback
(Strong or Weak Bulls // Strong or Weak Bears)
Candles / Bars Indicate the Following (default 13 period lookback / Length)
MAROON Bear Candle with STRONG VOLUME more than 150% of the lookback / length (13 default), STRONG Bear Candle Confirmed With Volume
RED Bear Candle while VOLUME is BETWEEN 50% & 150% of the Lookback / Length (13 default), Neutral Bear Volume Neither strong or weak
ORANGE Bear Candle with WEAK VOLUME (Less than 50% of the Length / Lookback)
DARK GREEN Bull Candle with STRONG VOLUME MORE than 150% of lookback
GREEN Bull Candle with Neutral VOLUME BETWEEN 50% & 150% of the lookback / Length
AQUA Bull Candle with WEAK VOLUME less than 50% of the Lookback
Is price confirmed by volume?
Can Change the Lookback / Length from 13
Can Change the Colors and Transparency to easily see based off your chart background colors I recommend ZERO Transparency to easily identify volume strength (i use white background but many use black or other)

Ultimate Bar Analysis Emiliano MesaMy most complex script as a gift to you @TradingView.
Simple price action analysis. Look at the chart and the indicator will do everything else for you. This indicator is based in a combination of several indicators, including ADX, EMA, and concepts by the book "Bar by Bar" by Al Brooks. You can use it any way you like.
Its been tested in 5 minute stock charts, anything else is not assured to work.
Key:
Yellow/Pink ===> Buyer / Seller pressure (Bears/Bulls are gaining momentum)
Green/Orange ===> Up Trend / Down Trend, this is based on ADX, change the values if you wish.
Red ===> High reversal chance, based on Al Brooks book.
Grey Bars ===> No man land. (No trend is taking place)
Hope you enjoy! Leave your feedback down below.
---------------------------------------------------------------------
Want your own indicator? Email me at : emilianomesauribe2000@live.com
Prices starting at 100$
Bars Since VIX MedianBARS SINCE VIX17 Median by dime (v1.0 release) 04/02/2017
(Inspired by "Bars Since the last RSI Extreme" from DRodriguezFX)
This indicator is useful in tracking how many daily bars since the VIX was last at a historically 'normal' range.
Currently the VIX has been in a period of low volatility for a period of 98 daily bars since the VIX was last at the 17 historical median.

Williams Squat BarsSquat bars are a battle of the bulls and the bears, with lots of buying and selling but little price movement.
A squat bar will be one of the top three OR bottom three bars 85% of the time at the end of a trend.
While all trends end with a squat, all squats are NOT the end of a trend.

Dunnigan Bars This displays "Dunnigan Bars," which is defined as:
Higher High and High Low = Green Color
Lower High and Lower Low = Red Color
Inside Bar = Black Color
Outside Bar = Yellow Color

Bar Countdown ClockBar Countdown Clock
Description:
Displays the remaining time for the current bar on the chart. The countdown label follows the previous EMA5 price to stay stable during high-volatility markets. Font size and label position are fully customizable. Works well on BTC, Gold, Forex, and other trading instruments.
How to Use:
Add the indicator to your chart.
Adjust Clock Color, Font Size, and X Offset to suit your preference.
The label will automatically track the previous EMA5 price.
The countdown updates in real-time until the current bar closes.
Tips:
Increase X Offset if the label overlaps the current bar.
For high-volatility instruments, the label remains stable by following EMA5.
EMA Length can be adjusted to change the anchor point for the label.

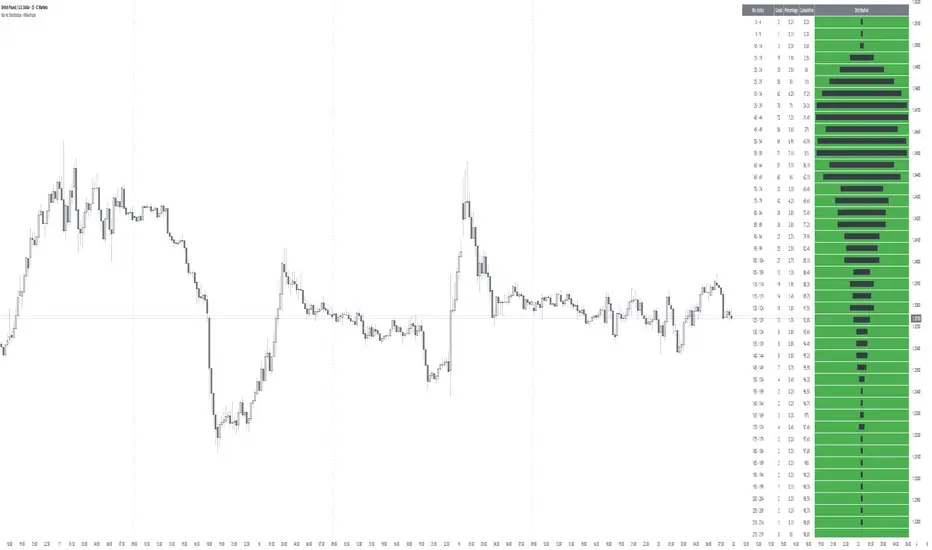
Bar HL Distribution - XWiseTradeBar HL Distribution - XWiseTrade
Analyze the distribution of High-Low ranges over the last N bars.
This indicator groups candle ranges (in ticks) into bins and displays:
• Count per bin
• Percentage and cumulative %
• Visual histogram bars
Perfect for understanding typical volatility, setting realistic targets/stops, and spotting unusual bar sizes.
Features:
• Adjustable lookback and bin size
• Clean table with truncation warning
• Lightweight and always up-to-date
More premium indicators and strategies coming soon at:
xwisetrade.com
Be Wise. Trade X.
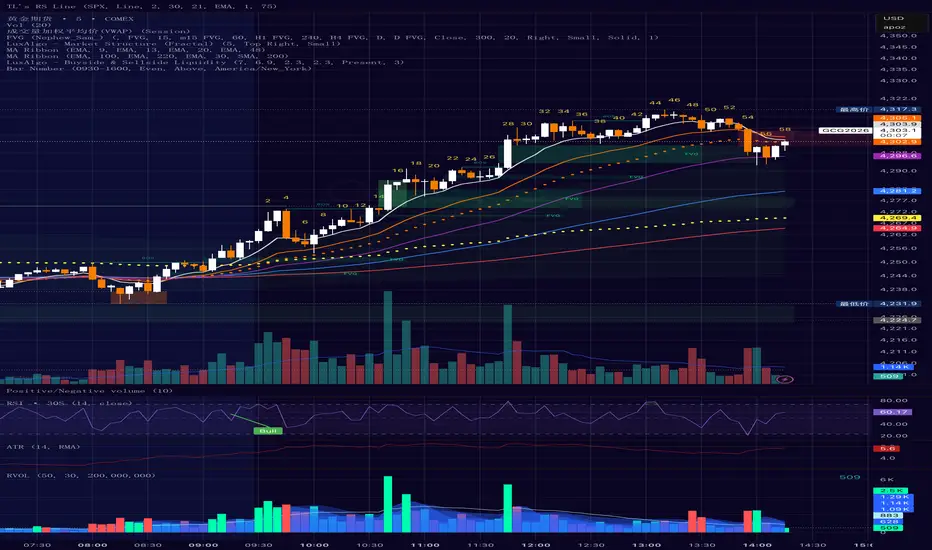
Bar Number IndicatorBar Number Indicator
This Pine Script indicator is designed to help intraday traders by automatically numbering candlesticks within a user-defined trading session. This is particularly useful for strategies that rely on specific bar counts (e.g., tracking the 1st, 18th, or 81st bar of the day).
Key Features:
Session-Based Counting: Automatically resets the count at the start of each new session (default 09:30 - 16:00).
Timezone Flexibility: Includes a dropdown to select your specific trading timezone (e.g., America/New_York), ensuring accurate session start times regardless of your local time or the exchange's default setting.
Smart Display Modes: Choose to show "All" numbers, or filter for "Odd" / "Even" numbers to keep your chart clean.
Custom Positioning: Easily place the numbers Above or Below the candlesticks.
Minimalist Design: Numbers are displayed as floating text without distracting background bubbles.
Total Bars CalculatorThis indicator simply plots how much bars are available to the user in the respective chart.
For Example if plot shows 5000 , therefore you have total 5000 bars of OHLC available.

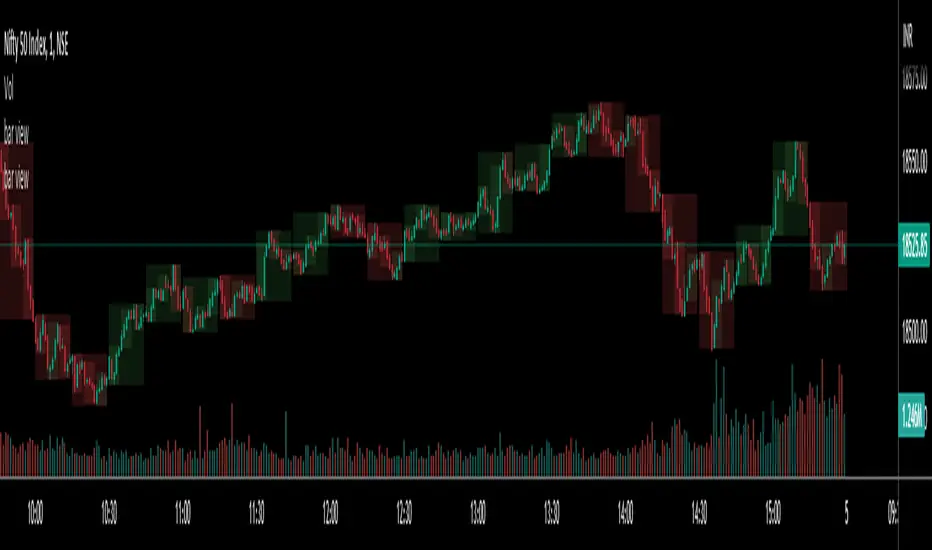
bar viewBar view is a simple script to show other higher time frame windows while you are focusing on lower time for precise decision making.
For example you are currently operating at 1 minute time frame and you want to see other bars on higher time frames e.g. 5 minute, 15 minutes etc.
Feel free to add multiple bar view to see different time frames.
[SS]Multicolor BB with Squeez Moving Average & Colored BarsHello Followers,
Hope u guyz doing well in the market.
Came with a standalone Trading System which helps u with the trend & choppiness zone.
This system is combination of multiple stretagies which makes it better than single published indicators.
=========================================================================================================
We have used Variety-Filtered, Squeeze Moving Averages which is a chop zone indicator that identifies when price is below a specific volatility threshold calculated as the difference between a fast and slow moving average and filtered using ATR- or Pips-based threshold. This indicator can be use as both an entry and exit indicator. It identifies both chop zones and breakouts/breakdowns
Uses:-
When the candles turn white and the threshold bands appear on the chart, this is indicative of low volatility
When price exits the threshold bands, price will usually explode up or down giving a long or short signal. This acts as a sort of squeeze momentum.
Included:
Bar coloring
Signals
Alerts, 4 types of alerts: Squeeze started, Squeeze ended, long, and short
<<------------------------------------->>
Multicolour Bollinger Bands indicator that indicates market phases.
It plots on the price chart, thanks to different color zones between the bands, a breakdown of the different phases that the price operates during a trend.
The different zones are identified as follows:
- red color zone: trend is bearish , price is below the 200 periods moving average
--> orange color zone: price operate a technical rebound below the 200 periods moving average
- yellow color zone: (phase 1 which indicate a new bearish cycle)
- light green zone: (phase 2 which indicate a new bullish cycle)
--> dark green zone: trend is bullish , price is above the 200 periods moving average
- grey color zone: calm phase of price/low volatility
- dark blue color zone: price is consolidating in either bullish or bearish trend
- light blue zones: price will revert to a new opposite trend (either long or short new trend)
By identifying clearly the different market phases with the multicolor Bollinger bands , the market entries by either a the beginning of a new trend or just after a rebound or a consolidating phase is easier to spot on.
<<==========================>>
The credit of above indicator souce goes to loxx & Deveatt. I just backtested and modified it to increase accuracy of trade and clear visual representation for trades.
Modified the trend based SMA and BB period and entry criteria.
<<===========================>>
<>
1) Look for BB COLOR and SMA for trend either up or down.
2) Look Bar coloring, enter when price above sma and green for long else short.

Extreme Bars"Extreme Bars" is a simple but useful indicator that marks overbought and oversold candles. This indicator paints candles that fall far above the average red, and the candles that rise above the average green. Of course, they can change these colors if they want. "Extreme Bars" can be interpreted in many different ways. The starting points of colored candles can often be good support or resistance. In addition, it would be wise to close the positions opposite the colored candles and to maintain the positions compatible with the colored candles. It is also possible that the gaps formed by the colored candles will be closed in the future. The sensitivity of the indicator can be changed in the settings section.

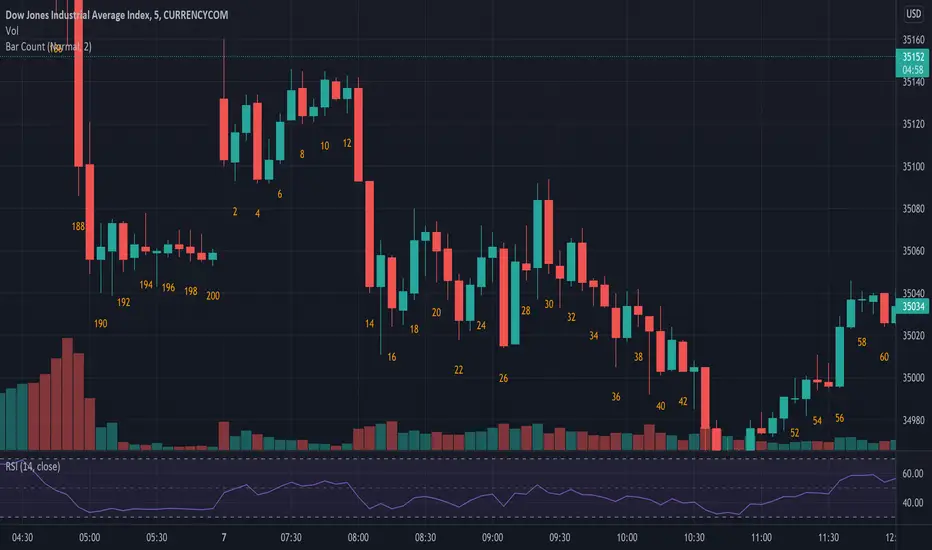
Bar CountBar Count Indicator for TradingView. It will label bars with numbers underneath which is awesome when sharing analysis or waiting for bars 7 (50% chance), 12 (70% chance), and 18 (90% chance) looking for higher probability for the High or Low of the day to have formed.
Zendog Bar PercentageThis script will add text to bars showing the price change of the bar as a percentage, both for open/close and high/low.
It can be used together with Rate of Change to better get an idea of how the price moved at a previous point in time.
Script uses labels for text, as there is a maximum limit of 500 labels if you want to study price movement for a specific timeframe, you can limit the timeframe from the script settings. Keep in mind that labels are applied to the last 500 candles of any timeframe.
Script also displays statistics for max changes in the selected time period, for both green and red candles both as percentage and base currency absolute value.
Uses:
- Study the behavior of an asset under previous market conditions, black swan events a.s.o.
- Calculate leverage position risk versus extreme price movements
Example: ZENUSDT pumped ~35% on 15 Sep 2021 in the first seconds after the news on getting listed on Coinbase so shorts with 3x leverage would have been liquidated.

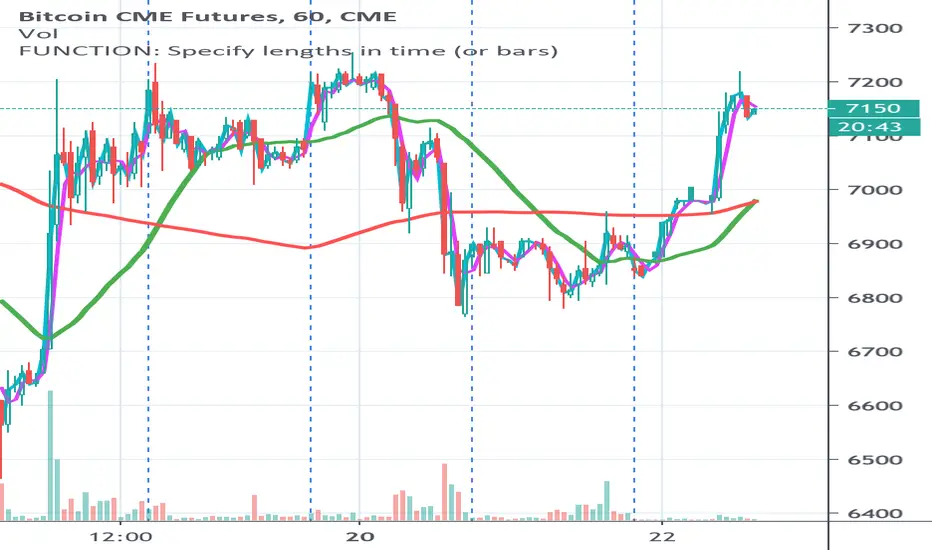
FUNCTION: Specify lengths in time (or bars) This is a function to give measures in time rather than bars...
I often want to measure in things in time rather than bars and change the sample rate (the candle size)
without reconfiguring my settings. This is a handy function for setting you input lengths in time units
(or bars when you want that)
For example
I want a 3 hour moving average, regardless of whether I have 5 minute candles or 30 min candles...
I want a 200 day moving average, regardless of whether I have 1 day or 1 week candles...
This is designed for you to put in your own scripts for your own purpose, but you can use this as is for time constant moving averages
or as an indicator on an indicator.
This shows the same moving averages 45 min / 3 hours in aqua / fuchsia and 1 day / 1 week in red / green
First row: On an extended session chart with 10m, 30m and 60m candles (all of them use the same settings (day length is 16 hours) everything else default.
Second row: On a standard session chart with 10m, 30m and 60m candles (all of them use the same settings everything else default.
Kaz Style BarsChange bar colors based on above or Below EMA
I use it to match Kaz's bars look on my charts

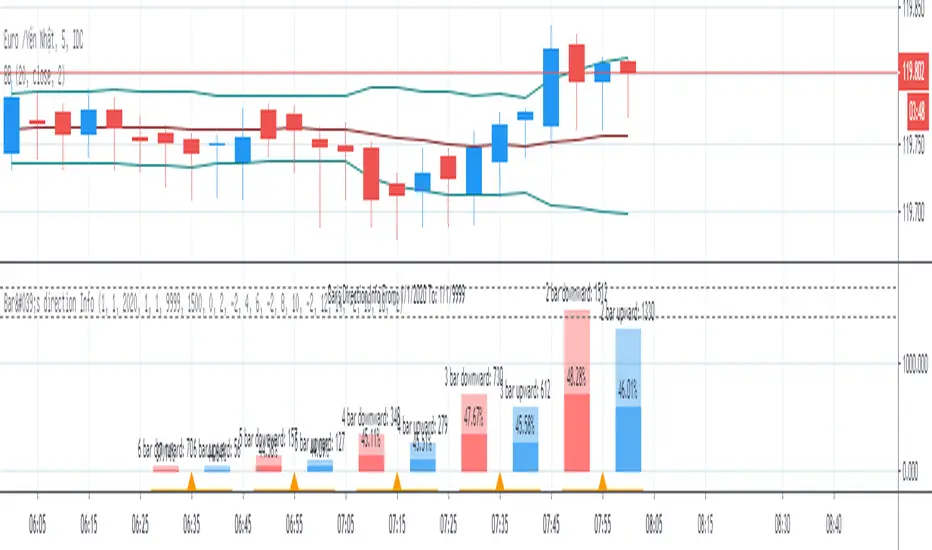
Bar's direction InfoBar's direction Info show number of case which bars have same direction and counting percent of next bar's direction.
This info may be useful to trade Binary Option.
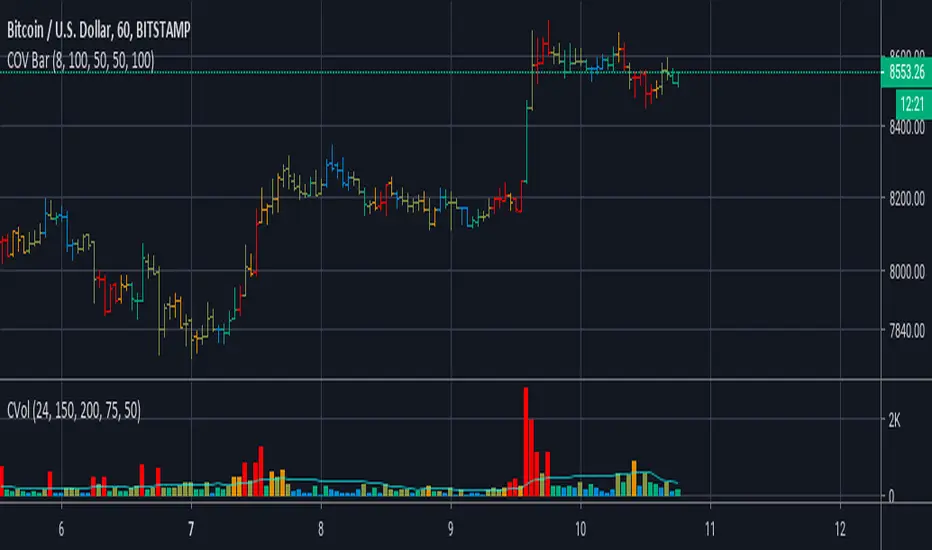
Cumulative Overlapping Volume BarsThis is cheap replacement for volume profile.
Red bars is where accumulated high volume in small range.
if new bar moves out of range all accumulated volume will be lost and color will change.
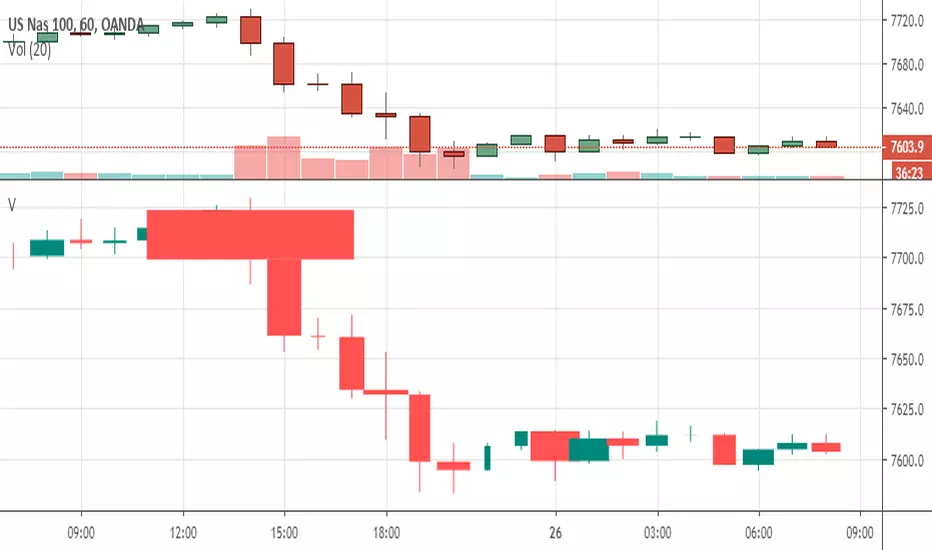
[RS]Volume BarsVolume Bars inspired by Richard W. Arms Jr. EquiVolume.
the bars change in width by the amount of volume within that bar.
see links in the source code for reference.
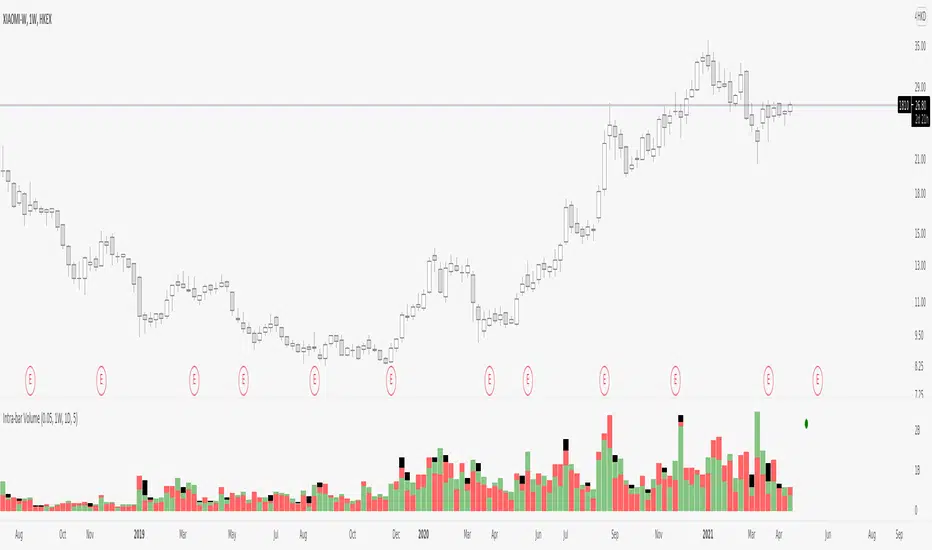
Intra-bar VolumeDisclamer : READ THIS BEFORE USING IT !!!
I have take and try to improuve the source code of indicator "intra-bar volume" by backtest-rookies.com
This indicator categorized the volume in lower timeframe, if the candle close up it's a buying volume, if it close down...
Beware that is not easy to work with different TF on tradingview so you have some limitation on the TF with this indicator. Also in TV we can't have a mutable variable in a security fonction.. so my approche is not clean but it works, if someone find better way, please comment or contact me :)
So by default the indicator can work on the following TF : 5m 15m 30m 60m 120m 240m 480m 720m 1D 1W 12M.
But ... this indicator need a lower timeframe and the number of bar to work correctly, in my code i suppose that the market run 24/7, so you need to adapte it or use intraday TF for other market.
To make sure that the indicator work correctly i have juste add circle, if it's green the buying+selling+balance volume is equal to the volume on the last close candle. If it's red theire is a problem.
I hope you enjoy it, feel free to modify the code and comment if you have any sugestion, i have just make it so maybe i will ajust some part of the code.
Color Volume Bars V 0.1Preliminary version.
Color Volume Bars will indicate the volume % related to the historical average by painting the bars on the graph. Nice to identify when a large amount of deals are closed at a certain price level.
