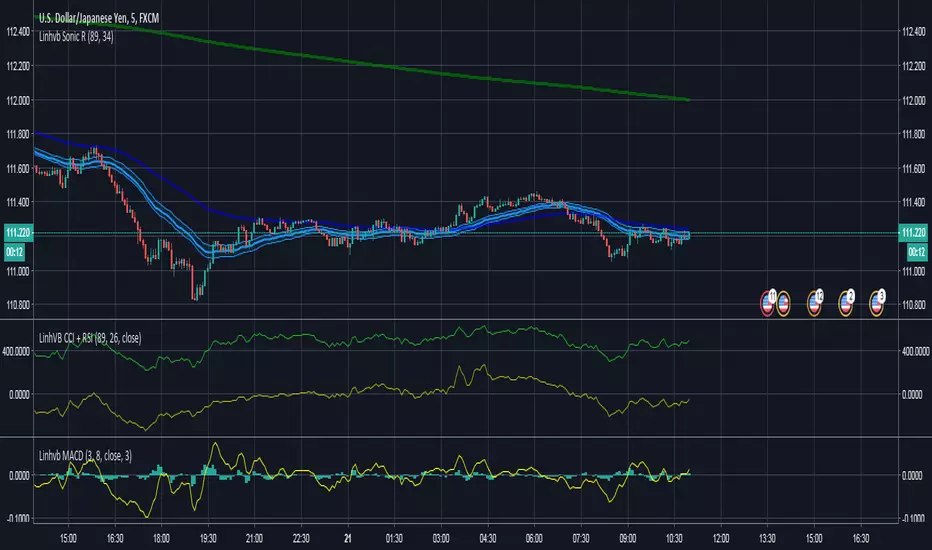
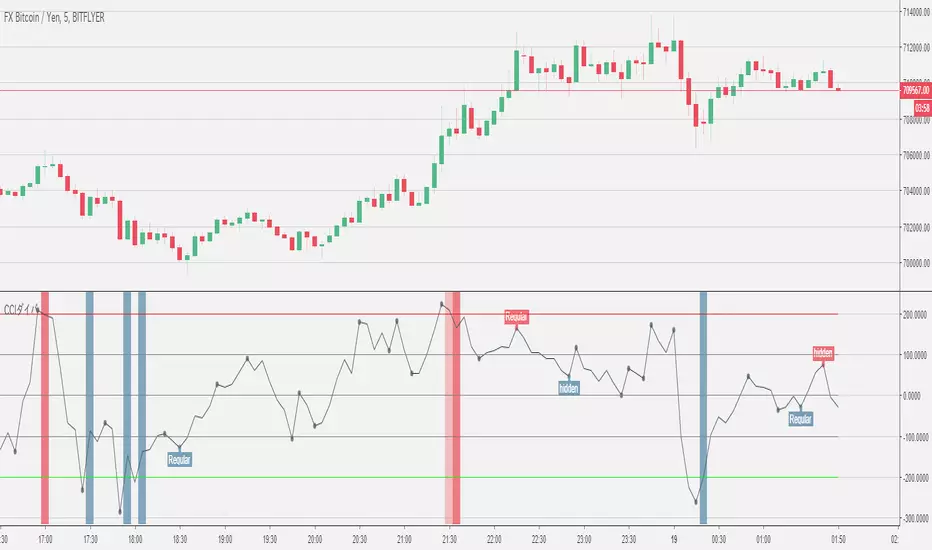
CCI × MACD SIGNALThis is a script that displays entry points using "CCI" and "MACD".
I think that scalping will work well if I use "FXBTCJPY" 1 minute as the main and it would be nice if you do not want your interests and take a little profit
Cari skrip untuk "CCI"


CCI Divergence w/ TrendLooks for divergences between the CCI and price. Provides signals based on the trend.

LinhVB Tripple CCICCI is quite famous to most traders. This script is useful for people who want to save more space for the chart.


CCI+VIX+MACDWoodies CCI + VIX + MACD
MACD is normalized from -400 to 400, so it is useful to watch with CCI.
If background color is green, VIX shows fear.
If background color is red, VIX shows not fear.


CCI Cloud [DW]This is a simple experimental study utilizing multiple CCIs and their divergences to visualize price activity.


CCI Extreme and OBV DivergenceThis is my second set of two indicators combined utilize Multi time frame analysis of 5 minutes and 15 minutes.
CCI:
Green = uptrending
Red = downtrending
Bright Green = overbought, look to go SHORT
Bright Red = oversold, look to go LONG
OBV:
this use to predict the market direction buy drawing trend line.
It is also very good indicator to sport Smart Money moment. When price move higher but OBV trend lower, smart money is taking profit and reversing their position, look to go Short to you spot this type of divergence.
Also else already not there is no holy grail indicator so I also use this set of indicator to improve the signal

CCI with averagesI coded this indicator to adapt a few techniques I learned from Constance Brown to CCI, which is a very good momentum indicator which gives great signals if you know how to read them.
I plotted a few examples on the chart.
As you can see, it complements a trader's bar chart reading skills nicely if applied correctly.
Hope you can find it of use.
Cheers,
Ivan.

CCI Crossover AlertThis very simple indicator will give you a blue background where the CCI crossed from below -100 to above -100, and a red background where it crossed from above 100 to below 100.

52SIGNAL RECIPE CCI Linreg Bands═══ 52SIGNAL RECIPE CCI Linreg Bands ═══
◆ Overview
52SIGNAL RECIPE CCI Linreg Bands is an advanced technical indicator that combines the CCI (Commodity Channel Index) with Linear Regression Bands. This indicator visualizes the volatility of the CCI using linear regression bands, helping to clearly identify overbought/oversold areas and more accurately capture potential trend reversal points.
─────────────────────────────────────
◆ Key Features
• CCI-Based Overbought/Oversold Analysis: Uses the traditional CCI indicator to identify overbought/oversold conditions in the market
• Integrated Linear Regression Bands: Applies linear regression analysis to the CCI to visually represent the direction and strength of trends
• Dual Overbought/Oversold Levels: Sets overbought/oversold levels for both CCI and Linear Regression Bands to increase the accuracy of signals
• Advanced Visualization: Intuitive chart analysis is possible with color changes according to trend direction and clear band display
• Multiple Alert Settings: Alert functions for various conditions ensure you don't miss important trading moments
─────────────────────────────────────
◆ Technical Foundation
■ CCI (Commodity Channel Index)
• Basic Settings: 20-period CCI with Weighted Moving Average (WMA) applied
• Calculation Method: Measures the deviation from the average price normalized to a specific range
• Overbought/Oversold Levels: Default values set to +150 (overbought) and -150 (oversold)
■ Linear Regression Bands
• Period: Default value of 100 days
• Deviation: Default value of 4.5 standard deviations
• Center Line: The center line of the linear regression analysis for the CCI values
• Band Width: Displays the range of volatility around the center line based on the calculated standard deviation
• Overbought/Oversold Levels: Default values set to +250 (overbought) and -250 (oversold)
─────────────────────────────────────
◆ Practical Applications
■ Identifying Trading Signals
• Buy Signal:
▶ When the CCI falls below the oversold level (-150)
▶ When the lower band of the Linear Regression Bands falls below the oversold level (-250)
▶ When both conditions are met simultaneously (extreme oversold state) - a strong buy signal
• Sell Signal:
▶ When the CCI rises above the overbought level (+150)
▶ When the upper band of the Linear Regression Bands rises above the overbought level (+250)
▶ When both conditions are met simultaneously (extreme overbought state) - a strong sell signal
■ Trend Analysis
• Uptrend: When the linear regression center line is rising and the CCI is moving above the zero line
• Downtrend: When the linear regression center line is falling and the CCI is moving below the zero line
• Trend Strength: The wider the gap between the bands, the greater the volatility; the narrower, the more stable the trend
■ Divergence Confirmation
• Bearish Divergence: Price forms a new high, but the CCI is lower than the previous high (potential bearish signal)
• Bullish Divergence: Price forms a new low, but the CCI is higher than the previous low (potential bullish signal)
─────────────────────────────────────
◆ Advanced Setting Options
■ CCI Setting Adjustments
• CCI Source: Selectable options include Close (default), Open, High, Low, HL2, HLC3, OHLC4, etc.
• CCI Length: Adjust to lower values for short-term volatility, higher values for long-term trends
■ Linear Regression Setting Adjustments
• Period: Use lower values (20-50) for short-term analysis, higher values (100-200) for long-term analysis
• Deviation: Higher values create wider bands (more signals), lower values create narrower bands (more accurate signals)
■ Overbought/Oversold Level Adjustments
• CCI Levels: Adjust to more extreme values (±200) in highly volatile markets
• Linear Regression Band Levels: Adjustable to ±300 or ±200 depending on market conditions
─────────────────────────────────────
◆ Synergy with Other Indicators
• Bollinger Bands: Use alongside Bollinger Bands on the price chart to compare price volatility with CCI volatility
• MACD: Use with MACD for momentum and trend confirmation
• Fibonacci Retracement: Check CCI Linreg Bands signals with key support/resistance levels
• Moving Averages: Combine moving average crossovers with CCI Linreg Bands signals to improve reliability
─────────────────────────────────────
◆ Conclusion
52SIGNAL RECIPE CCI Linreg Bands provides a powerful and accurate technical analysis tool by combining traditional CCI with linear regression analysis. The dual overbought/oversold system increases the accuracy of trading signals and clearly visualizes trend direction and strength to help traders make decisions. You can achieve optimal results by adjusting various settings to match your trading style and market conditions.
─────────────────────────────────────
※ Disclaimer: Past performance does not guarantee future results. Always use appropriate risk management strategies.
═══ 52SIGNAL RECIPE CCI 선형회귀 밴드 ═══
◆ 개요
52SIGNAL RECIPE CCI 선형회귀 밴드는 CCI(Commodity Channel Index)와 선형회귀 밴드를 결합한 고급 기술적 지표입니다. 이 지표는 선형회귀 밴드를 사용하여 CCI의 변동성을 시각화하여 과매수/과매도 영역을 명확하게 식별하고 잠재적인 추세 반전 지점을 더 정확하게 포착하는 데 도움을 줍니다.
─────────────────────────────────────
◆ 주요 특징
• CCI 기반 과매수/과매도 분석: 전통적인 CCI 지표를 사용하여 시장의 과매수/과매도 상태를 식별
• 통합된 선형회귀 밴드: CCI에 선형회귀 분석을 적용하여 추세의 방향과 강도를 시각적으로 표현
• 이중 과매수/과매도 레벨: CCI와 선형회귀 밴드 모두에 과매수/과매도 레벨을 설정하여 신호의 정확도 향상
• 고급 시각화: 추세 방향에 따른 색상 변화와 명확한 밴드 표시로 직관적인 차트 분석 가능
• 다중 알림 설정: 다양한 조건에 대한 알림 기능으로 중요한 트레이딩 시점을 놓치지 않도록 보장
─────────────────────────────────────
◆ 기술적 기반
■ CCI (Commodity Channel Index)
• 기본 설정: 20기간 CCI에 가중이동평균(WMA) 적용
• 계산 방법: 평균 가격에 대한 편차를 측정하여 정규화한 값으로 표현
• 과매수/과매도 레벨: 기본값으로 +150(과매수)과 -150(과매도) 설정
■ 선형회귀 밴드
• 기간: 기본값 100일
• 편차: 기본값 4.5 표준편차
• 중심선: CCI 값에 대한 선형회귀 분석의 중심선
• 밴드 폭: 계산된 표준편차에 기반하여 중심선 주변의 변동성 범위 표시
• 과매수/과매도 레벨: 기본값으로 +250(과매수)와 -250(과매도) 설정
─────────────────────────────────────
◆ 실용적 응용
■ 트레이딩 신호 식별
• 매수 신호:
▶ CCI가 과매도 레벨(-150) 아래로 떨어질 때
▶ 선형회귀 밴드의 하단이 과매도 레벨(-250) 아래로 떨어질 때
▶ 두 조건이 동시에 충족될 때(극단적 과매도 상태) - 강한 매수 신호
• 매도 신호:
▶ CCI가 과매수 레벨(+150) 위로 상승할 때
▶ 선형회귀 밴드의 상단이 과매수 레벨(+250) 위로 상승할 때
▶ 두 조건이 동시에 충족될 때(극단적 과매수 상태) - 강한 매도 신호
■ 추세 분석
• 상승 추세: 선형회귀 중심선이 상승하고 CCI가 0선 위로 움직일 때
• 하락 추세: 선형회귀 중심선이 하락하고 CCI가 0선 아래로 움직일 때
• 추세 강도: 밴드 사이의 간격이 넓을수록 변동성이 크고, 좁을수록 추세가 안정적
■ 다이버전스 확인
• 약세 다이버전스: 가격이 신고점을 형성하지만 CCI가 이전 고점보다 낮을 때(잠재적 약세 신호)
• 강세 다이버전스: 가격이 신저점을 형성하지만 CCI가 이전 저점보다 높을 때(잠재적 강세 신호)
─────────────────────────────────────
◆ 고급 설정 옵션
■ CCI 설정 조정
• CCI 소스: 선택 가능한 옵션에는 종가(기본값), 시가, 고가, 저가, HL2, HLC3, OHLC4 등이 포함
• CCI 길이: 단기 변동성을 위해 낮은 값으로, 장기 추세를 위해 높은 값으로 조정
■ 선형회귀 설정 조정
• 기간: 단기 분석을 위해 낮은 값(20-50), 장기 분석을 위해 높은 값(100-200) 사용
• 편차: 높은 값은 더 넓은 밴드(더 많은 신호), 낮은 값은 더 좁은 밴드(더 정확한 신호) 생성
■ 과매수/과매도 레벨 조정
• CCI 레벨: 변동성이 큰 시장에서는 더 극단적인 값(±200)으로 조정
• 선형회귀 밴드 레벨: 시장 상황에 따라 ±300 또는 ±200으로 조정 가능
─────────────────────────────────────
◆ 다른 지표와의 시너지
• 볼린저 밴드: 가격 차트의 볼린저 밴드와 함께 사용하여 가격 변동성과 CCI 변동성 비교
• MACD: 모멘텀과 추세 확인을 위해 MACD와 함께 사용
• 피보나치 되돌림: CCI 선형회귀 밴드 신호를 주요 지지/저항 레벨과 함께 확인
• 이동평균선: 이동평균 교차와 CCI 선형회귀 밴드 신호를 결합하여 신뢰성 향상
─────────────────────────────────────
◆ 결론
52SIGNAL RECIPE CCI 선형회귀 밴드는 전통적인 CCI와 선형회귀 분석을 결합하여 강력하고 정확한 기술적 분석 도구를 제공합니다. 이중 과매수/과매도 시스템은 트레이딩 신호의 정확도를 높이고 추세 방향과 강도를 명확하게 시각화하여 트레이더의 의사 결정을 돕습니다. 다양한 설정을 트레이딩 스타일과 시장 상황에 맞게 조정하여 최적의 결과를 얻을 수 있습니다.
─────────────────────────────────────
※ 면책 조항: 과거 성과가 미래 결과를 보장하지 않습니다. 항상 적절한 리스크 관리 전략을 사용하세요.

GKD-C CCI Adaptive Smoother [Loxx]Giga Kaleidoscope GKD-C CCI Adaptive Smoother is a Confirmation module included in Loxx's "Giga Kaleidoscope Modularized Trading System".
█ GKD-C CCI Adaptive Smoother
Commodity Channel Index: History, Calculation, and Advantages
The Commodity Channel Index (CCI) is a versatile technical analysis indicator widely used by traders and analysts to identify potential trends, reversals, and trading opportunities in various financial markets. Developed by Donald Lambert in 1980, the CCI was initially designed to analyze the cyclical behavior of commodities. However, its applications have expanded over time to include stocks, currencies, and other financial instruments. The following provides an overview of the CCI's history, explain its calculation, and discuss its advantages compared to other indicators.
History
Donald Lambert, a commodities trader and technical analyst, created the Commodity Channel Index in response to the unique challenges posed by the cyclical nature of the commodities markets. Lambert aimed to develop an indicator that could help traders identify potential turning points in the market, allowing them to capitalize on price trends and reversals. The CCI quickly gained popularity among traders and analysts due to its ability to adapt to various market conditions and provide valuable insights into price movements.
Calculation
The CCI is calculated through the following steps:
1. Determine the typical price for each period: The typical price is calculated as the average of the high, low, and closing prices for each period.
Typical Price = (High + Low + Close) / 3
2. Calculate the moving average of the typical price: The moving average is computed over a specified period, typically 14 or 20 days.
3. Calculate the mean deviation: For each period, subtract the moving average from the typical price, and take the absolute value of the result. Then, compute the average of these absolute values over the specified period.
4. Calculate the CCI: Divide the difference between the typical price and its moving average by the product of the mean deviation and a constant, typically 0.015.
CCI = (Typical Price - Moving Average) / (0.015 * Mean Deviation)
Why CCI is Used and Its Advantages over Other Indicators
The CCI offers several advantages over other technical indicators, making it a popular choice among traders and analysts:
1. Versatility: Although initially developed for commodities, the CCI has proven to be effective in analyzing a wide range of financial instruments, including stocks, currencies, and indices. Its adaptability to different markets and timeframes makes it a valuable tool for various trading strategies.
2. Identification of overbought and oversold conditions: The CCI measures the strength of the price movement relative to its historical average. When the CCI reaches extreme values, it can signal overbought or oversold conditions, indicating potential trend reversals or price corrections.
3. Confirmation of price trends: The CCI can help traders confirm the presence of a price trend by identifying periods of strong momentum. A rising CCI indicates increasing positive momentum, while a falling CCI suggests increasing negative momentum.
4. Divergence analysis: Traders can use the CCI to identify divergences between the indicator and price action. For example, if the price reaches a new high, but the CCI fails to reach a corresponding high, it can signal a weakening trend and potential reversal.
5. Independent of price scale: Unlike some other technical indicators, the CCI is not affected by the price scale of the asset being analyzed. This characteristic allows traders to apply the CCI consistently across various instruments and markets.
The Commodity Channel Index is a powerful and versatile technical analysis tool that has stood the test of time. Developed to address the unique challenges of the commodities markets, the CCI has evolved into an essential tool for traders and analysts in various financial markets. Its ability to identify trends, reversals, and trading opportunities, as well as its versatility and adaptability, sets it apart from other technical indicators. By incorporating the CCI into their analytical toolkit, traders can gain valuable insights into market conditions, enabling them to make more informed decisions and improve their overall trading performance.
As financial markets continue to evolve and grow more complex, the importance of reliable and versatile technical analysis tools like the CCI cannot be overstated. In an environment characterized by rapidly changing market conditions, the ability to quickly identify trends, reversals, and potential trading opportunities is crucial for success. The CCI's adaptability to different markets, timeframes, and instruments makes it an indispensable resource for traders seeking to navigate the increasingly dynamic financial landscape.
Additionally, the CCI can be effectively combined with other technical analysis tools, such as moving averages, trend lines, and candlestick patterns, to create a more comprehensive and robust trading strategy. By using the CCI in conjunction with these complementary techniques, traders can develop a more nuanced understanding of market behavior and enhance their ability to identify high-probability trading opportunities.
In conclusion, the Commodity Channel Index is a valuable and versatile tool in the world of technical analysis. Its ability to adapt to various market conditions and provide insights into price trends, reversals, and trading opportunities make it an essential resource for traders and analysts alike. As the financial markets continue to evolve, the CCI's proven track record and adaptability ensure that it will remain a cornerstone of technical analysis for years to come.
What is the Smoother Moving Average?
The smoother function is a custom algorithm designed to smooth the price data of a financial asset using a moving average technique. It takes the price (src) and the period of the rolling window sample (len) to reduce noise in the data and reveal underlying trends.
smoother(float src, int len)=>
wrk = src, wrk2 = src, wrk4 = src
wrk0 = 0., wrk1 = 0., wrk3 = 0.
alpha = 0.45 * (len - 1.0) / (0.45 * (len - 1.0) + 2.0)
wrk0 := src + alpha * (nz(wrk ) - src)
wrk1 := (src - wrk) * (1 - alpha) + alpha * nz(wrk1 )
wrk2 := wrk0 + wrk1
wrk3 := (wrk2 - nz(wrk4 )) * math.pow(1.0 - alpha, 2) + math.pow(alpha, 2) * nz(wrk3 )
wrk4 := wrk3 + nz(wrk4 )
wrk4
Here's a detailed breakdown of the code, explaining each step and its purpose:
1. wrk, wrk2, and wrk4: These variables are assigned the value of src, which represents the source price of the asset. This step initializes the variables with the current price data, serving as a starting point for the smoothing calculations.
wrk0, wrk1, and wrk3: These variables are initialized to 0. They will be used as temporary variables to hold intermediate results during the calculations.
Calculation of the alpha parameter:
2. The alpha parameter is calculated using the formula: 0.45 * (len - 1.0) / (0.45 * (len - 1.0) + 2.0). The purpose of this calculation is to determine the smoothing factor that will be used in the subsequent calculations. This factor will influence the balance between responsiveness to recent price changes and smoothness of the resulting moving average. A higher value of alpha will result in a more responsive moving average, while a lower value will produce a smoother curve.
Calculation of wrk0:
3. wrk0 is updated with the expression: src + alpha * (nz(wrk ) - src). This step calculates the first component of the moving average, which is based on the current price (src) and the previous value of wrk (if it exists, otherwise 0 is used). This calculation applies the alpha parameter to weight the contribution of the previous wrk value, effectively making the moving average more responsive to recent price changes.
Calculation of wrk1:
4. wrk1 is updated with the expression: (src - wrk) * (1 - alpha) + alpha * nz(wrk1 ). This step calculates the second component of the moving average, which is based on the difference between the current price (src) and the current value of wrk. The alpha parameter is used to weight the contribution of the previous wrk1 value, allowing the moving average to be even more responsive to recent price changes.
Calculation of wrk2:
5. wrk2 is updated with the expression: wrk0 + wrk1. This step combines the first and second components of the moving average (wrk0 and wrk1) to produce a preliminary smoothed value.
Calculation of wrk3:
6. wrk3 is updated with the expression: (wrk2 - nz(wrk4 )) * math.pow(1.0 - alpha, 2) + math.pow(alpha, 2) * nz(wrk3 ). This step refines the preliminary smoothed value (wrk2) by accounting for the differences between the current smoothed value and the previous smoothed values (wrk4 and wrk3 ). The alpha parameter is used to weight the contributions of the previous smoothed values, providing a balance between smoothness and responsiveness.
Calculation of wrk4:
7. Calculation of wrk4:
wrk4 is updated with the expression: wrk3 + nz(wrk4 ). This step combines the refined smoothed value (wrk3) with the previous smoothed value (wrk4 , or 0 if it doesn't exist) to produce the final smoothed value. The purpose of this step is to ensure that the resulting moving average incorporates information from past values, making it smoother and more representative of the underlying trend.
8. Return wrk4:
The function returns the final smoothed value wrk4. This value represents the Smoother Moving Average for the given data point in the price series.
In summary, the smoother function calculates a custom moving average by using a series of steps to weight and combine recent price data with past smoothed values. The resulting moving average is more responsive to recent price changes while still maintaining a smooth curve, which helps reveal underlying trends and reduce noise in the data. The alpha parameter plays a key role in balancing the responsiveness and smoothness of the moving average, allowing users to customize the behavior of the algorithm based on their specific needs and preferences.
What is the CCI Adaptive Smoother?
The Commodity Channel Index (CCI) Adaptive Smoother is an innovative technical analysis tool that combines the benefits of the CCI indicator with a Smoother Moving Average. By adapting the CCI calculation based on the current market volatility, this method offers a more responsive and flexible approach to identifying potential trends and trading signals in financial markets.
The CCI is a momentum-based oscillator designed to determine whether an asset is overbought or oversold. It measures the difference between the typical price of an asset and its moving average, divided by the mean absolute deviation of the typical price. The traditional CCI calculation relies on a fixed period, which may not be suitable for all market conditions, as volatility can change over time.
The introduction of the Smoother Moving Average to the CCI calculation addresses this limitation. The Smoother Moving Average is a custom smoothing algorithm that combines elements of exponential moving averages with additional calculations to fine-tune the smoothing effect based on a given parameter. This algorithm assigns more importance to recent data points, making it more sensitive to recent changes in the data.
The CCI Adaptive Smoother dynamically adjusts the period of the Smoother Moving Average based on the current market volatility. This is accomplished by calculating the standard deviation of the close prices over a specified period and then computing the simple moving average of the standard deviation. By comparing the average standard deviation with the current standard deviation, the adaptive period for the Smoother Moving Average can be determined.
This adaptive approach allows the CCI Adaptive Smoother to be more responsive to changing market conditions. In periods of high volatility, the adaptive period will be shorter, resulting in a more responsive moving average. Conversely, in periods of low volatility, the adaptive period will be longer, producing a smoother moving average. This flexibility enables the CCI Adaptive Smoother to better identify trends and potential trading signals in a variety of market environments.
Furthermore, the CCI Adaptive Smoother is a prime example of the evolution of technical analysis methodologies. As markets continue to become more complex and dynamic, it is crucial for analysts and traders to adapt and improve their techniques to stay competitive. The incorporation of adaptive algorithms, like the Smoother Moving Average, demonstrates the potential for blending traditional indicators with cutting-edge methods to create more powerful and versatile tools for market analysis.
The versatility of the CCI Adaptive Smoother makes it suitable for various trading strategies, including trend-following, mean-reversion, and breakout systems. By providing a more precise measurement of overbought and oversold conditions, the CCI Adaptive Smoother can help traders identify potential entry and exit points with greater accuracy. Additionally, its responsiveness to changing market conditions allows for more timely adjustments in trading positions, reducing the risk of holding onto losing trades.
While the CCI Adaptive Smoother is a valuable tool, it is essential to remember that no single indicator can provide a complete picture of the market. As seasoned analysts and traders, we must always consider a holistic approach, incorporating multiple indicators and techniques to confirm signals and validate our trading decisions. By combining the CCI Adaptive Smoother with other technical analysis tools, such as trend lines, support and resistance levels, and candlestick patterns, traders can develop a more comprehensive understanding of the market and make more informed decisions.
The development of the CCI Adaptive Smoother also highlights the increasing importance of computational power and advanced algorithms in the field of technical analysis. As financial markets become more interconnected and influenced by various factors, including macroeconomic events, geopolitical developments, and technological innovations, the need for sophisticated tools to analyze and interpret complex data sets becomes even more critical.
Machine learning and artificial intelligence (AI) are becoming increasingly relevant in the world of trading and investing. These technologies have the potential to revolutionize how technical analysis is performed, by automating the discovery of patterns, relationships, and trends in the data. By leveraging machine learning algorithms and AI-driven techniques, traders can uncover hidden insights, improve decision-making processes, and optimize trading strategies.
The CCI Adaptive Smoother is just one example of how advanced algorithms can enhance traditional technical indicators. As the adoption of machine learning and AI continues to grow in the financial sector, we can expect to see the emergence of even more sophisticated and powerful analysis tools. These innovations will undoubtedly lead to a new era of technical analysis, where the ability to quickly adapt to changing market conditions and extract meaningful insights from complex data becomes increasingly critical for success.
In conclusion, the CCI Adaptive Smoother is an essential step forward in the evolution of technical analysis. It demonstrates the potential for combining traditional indicators with advanced algorithms to create more responsive and versatile tools for market analysis. As technology continues to advance and reshape the financial landscape, it is crucial for traders and analysts to stay informed and embrace innovation. By integrating cutting-edge tools like the CCI Adaptive Smoother into their arsenal, traders can gain a competitive edge and enhance their ability to navigate the increasingly complex world of financial markets.
Additional Features
This indicator allows you to select from 33 source types. They are as follows:
Close
Open
High
Low
Median
Typical
Weighted
Average
Average Median Body
Trend Biased
Trend Biased (Extreme)
HA Close
HA Open
HA High
HA Low
HA Median
HA Typical
HA Weighted
HA Average
HA Average Median Body
HA Trend Biased
HA Trend Biased (Extreme)
HAB Close
HAB Open
HAB High
HAB Low
HAB Median
HAB Typical
HAB Weighted
HAB Average
HAB Average Median Body
HAB Trend Biased
HAB Trend Biased (Extreme)
What are Heiken Ashi "better" candles?
Heiken Ashi "better" candles are a modified version of the standard Heiken Ashi candles, which are a popular charting technique used in technical analysis. Heiken Ashi candles help traders identify trends and potential reversal points by smoothing out price data and reducing market noise. The "better formula" was proposed by Sebastian Schmidt in an article published by BNP Paribas in Warrants & Zertifikate, a German magazine, in August 2004. The aim of this formula is to further improve the smoothing of the Heiken Ashi chart and enhance its effectiveness in identifying trends and reversals.
Standard Heiken Ashi candles are calculated using the following formulas:
Heiken Ashi Close = (Open + High + Low + Close) / 4
Heiken Ashi Open = (Previous Heiken Ashi Open + Previous Heiken Ashi Close) / 2
Heiken Ashi High = Max (High, Heiken Ashi Open, Heiken Ashi Close)
Heiken Ashi Low = Min (Low, Heiken Ashi Open, Heiken Ashi Close)
The "better formula" modifies the standard Heiken Ashi calculation by incorporating additional smoothing, which can help reduce noise and make it easier to identify trends and reversals. The modified formulas for Heiken Ashi "better" candles are as follows:
Better Heiken Ashi Close = (Open + High + Low + Close) / 4
Better Heiken Ashi Open = (Previous Better Heiken Ashi Open + Previous Better Heiken Ashi Close) / 2
Better Heiken Ashi High = Max (High, Better Heiken Ashi Open, Better Heiken Ashi Close)
Better Heiken Ashi Low = Min (Low, Better Heiken Ashi Open, Better Heiken Ashi Close)
Smoothing Factor = 2 / (N + 1), where N is the chosen period for smoothing
Smoothed Better Heiken Ashi Open = (Better Heiken Ashi Open * Smoothing Factor) + (Previous Smoothed Better Heiken Ashi Open * (1 - Smoothing Factor))
Smoothed Better Heiken Ashi Close = (Better Heiken Ashi Close * Smoothing Factor) + (Previous Smoothed Better Heiken Ashi Close * (1 - Smoothing Factor))
The smoothed Better Heiken Ashi Open and Close values are then used to calculate the smoothed Better Heiken Ashi High and Low values, resulting in "better" candles that provide a clearer representation of the market trend and potential reversal points.
It's important to note that, like any other technical analysis tool, Heiken Ashi "better" candles are not foolproof and should be used in conjunction with other indicators and analysis techniques to make well-informed trading decisions.
Heiken Ashi "better" candles, as mentioned previously, provide a clearer representation of market trends and potential reversal points by reducing noise and smoothing out price data. When using these candles in conjunction with other technical analysis tools and indicators, traders can gain valuable insights into market behavior and make more informed decisions.
To effectively use Heiken Ashi "better" candles in your trading strategy, consider the following tips:
Trend Identification: Heiken Ashi "better" candles can help you identify the prevailing trend in the market. When the majority of the candles are green (or another color, depending on your chart settings) and there are no or few lower wicks, it may indicate a strong uptrend. Conversely, when the majority of the candles are red (or another color) and there are no or few upper wicks, it may signal a strong downtrend.
Trend Reversals: Look for potential trend reversals when a change in the color of the candles occurs, especially when accompanied by longer wicks. For example, if a green candle with a long lower wick is followed by a red candle, it could indicate a bearish reversal. Similarly, a red candle with a long upper wick followed by a green candle may suggest a bullish reversal.
Support and Resistance: You can use Heiken Ashi "better" candles to identify potential support and resistance levels. When the candles are consistently moving in one direction and then suddenly change color with longer wicks, it could indicate the presence of a support or resistance level.
Stop-Loss and Take-Profit: Using Heiken Ashi "better" candles can help you manage risk by determining optimal stop-loss and take-profit levels. For instance, you can place your stop-loss below the low of the most recent green candle in an uptrend or above the high of the most recent red candle in a downtrend.
Confirming Signals: Heiken Ashi "better" candles should be used in conjunction with other technical indicators, such as moving averages, oscillators, or chart patterns, to confirm signals and improve the accuracy of your analysis.
In this implementation, you have the choice of AMA, KAMA, or T3 smoothing. These are as follows:
Kaufman Adaptive Moving Average (KAMA)
The Kaufman Adaptive Moving Average (KAMA) is a type of adaptive moving average used in technical analysis to smooth out price fluctuations and identify trends. The KAMA adjusts its smoothing factor based on the market's volatility, making it more responsive in volatile markets and smoother in calm markets. The KAMA is calculated using three different efficiency ratios that determine the appropriate smoothing factor for the current market conditions. These ratios are based on the noise level of the market, the speed at which the market is moving, and the length of the moving average. The KAMA is a popular choice among traders who prefer to use adaptive indicators to identify trends and potential reversals.
Adaptive Moving Average
The Adaptive Moving Average (AMA) is a type of moving average that adjusts its sensitivity to price movements based on market conditions. It uses a ratio between the current price and the highest and lowest prices over a certain lookback period to determine its level of smoothing. The AMA can help reduce lag and increase responsiveness to changes in trend direction, making it useful for traders who want to follow trends while avoiding false signals. The AMA is calculated by multiplying a smoothing constant with the difference between the current price and the previous AMA value, then adding the result to the previous AMA value.
T3
The T3 moving average is a type of technical indicator used in financial analysis to identify trends in price movements. It is similar to the Exponential Moving Average (EMA) and the Double Exponential Moving Average (DEMA), but uses a different smoothing algorithm.
The T3 moving average is calculated using a series of exponential moving averages that are designed to filter out noise and smooth the data. The resulting smoothed data is then weighted with a non-linear function to produce a final output that is more responsive to changes in trend direction.
The T3 moving average can be customized by adjusting the length of the moving average, as well as the weighting function used to smooth the data. It is commonly used in conjunction with other technical indicators as part of a larger trading strategy.
█ Giga Kaleidoscope Modularized Trading System
Core components of an NNFX algorithmic trading strategy
The NNFX algorithm is built on the principles of trend, momentum, and volatility. There are six core components in the NNFX trading algorithm:
1. Volatility - price volatility; e.g., Average True Range, True Range Double, Close-to-Close, etc.
2. Baseline - a moving average to identify price trend
3. Confirmation 1 - a technical indicator used to identify trends
4. Confirmation 2 - a technical indicator used to identify trends
5. Continuation - a technical indicator used to identify trends
6. Volatility/Volume - a technical indicator used to identify volatility/volume breakouts/breakdown
7. Exit - a technical indicator used to determine when a trend is exhausted
What is Volatility in the NNFX trading system?
In the NNFX (No Nonsense Forex) trading system, ATR (Average True Range) is typically used to measure the volatility of an asset. It is used as a part of the system to help determine the appropriate stop loss and take profit levels for a trade. ATR is calculated by taking the average of the true range values over a specified period.
True range is calculated as the maximum of the following values:
-Current high minus the current low
-Absolute value of the current high minus the previous close
-Absolute value of the current low minus the previous close
ATR is a dynamic indicator that changes with changes in volatility. As volatility increases, the value of ATR increases, and as volatility decreases, the value of ATR decreases. By using ATR in NNFX system, traders can adjust their stop loss and take profit levels according to the volatility of the asset being traded. This helps to ensure that the trade is given enough room to move, while also minimizing potential losses.
Other types of volatility include True Range Double (TRD), Close-to-Close, and Garman-Klass
What is a Baseline indicator?
The baseline is essentially a moving average, and is used to determine the overall direction of the market.
The baseline in the NNFX system is used to filter out trades that are not in line with the long-term trend of the market. The baseline is plotted on the chart along with other indicators, such as the Moving Average (MA), the Relative Strength Index (RSI), and the Average True Range (ATR).
Trades are only taken when the price is in the same direction as the baseline. For example, if the baseline is sloping upwards, only long trades are taken, and if the baseline is sloping downwards, only short trades are taken. This approach helps to ensure that trades are in line with the overall trend of the market, and reduces the risk of entering trades that are likely to fail.
By using a baseline in the NNFX system, traders can have a clear reference point for determining the overall trend of the market, and can make more informed trading decisions. The baseline helps to filter out noise and false signals, and ensures that trades are taken in the direction of the long-term trend.
What is a Confirmation indicator?
Confirmation indicators are technical indicators that are used to confirm the signals generated by primary indicators. Primary indicators are the core indicators used in the NNFX system, such as the Average True Range (ATR), the Moving Average (MA), and the Relative Strength Index (RSI).
The purpose of the confirmation indicators is to reduce false signals and improve the accuracy of the trading system. They are designed to confirm the signals generated by the primary indicators by providing additional information about the strength and direction of the trend.
Some examples of confirmation indicators that may be used in the NNFX system include the Bollinger Bands, the MACD (Moving Average Convergence Divergence), and the MACD Oscillator. These indicators can provide information about the volatility, momentum, and trend strength of the market, and can be used to confirm the signals generated by the primary indicators.
In the NNFX system, confirmation indicators are used in combination with primary indicators and other filters to create a trading system that is robust and reliable. By using multiple indicators to confirm trading signals, the system aims to reduce the risk of false signals and improve the overall profitability of the trades.
What is a Continuation indicator?
In the NNFX (No Nonsense Forex) trading system, a continuation indicator is a technical indicator that is used to confirm a current trend and predict that the trend is likely to continue in the same direction. A continuation indicator is typically used in conjunction with other indicators in the system, such as a baseline indicator, to provide a comprehensive trading strategy.
What is a Volatility/Volume indicator?
Volume indicators, such as the On Balance Volume (OBV), the Chaikin Money Flow (CMF), or the Volume Price Trend (VPT), are used to measure the amount of buying and selling activity in a market. They are based on the trading volume of the market, and can provide information about the strength of the trend. In the NNFX system, volume indicators are used to confirm trading signals generated by the Moving Average and the Relative Strength Index. Volatility indicators include Average Direction Index, Waddah Attar, and Volatility Ratio. In the NNFX trading system, volatility is a proxy for volume and vice versa.
By using volume indicators as confirmation tools, the NNFX trading system aims to reduce the risk of false signals and improve the overall profitability of trades. These indicators can provide additional information about the market that is not captured by the primary indicators, and can help traders to make more informed trading decisions. In addition, volume indicators can be used to identify potential changes in market trends and to confirm the strength of price movements.
What is an Exit indicator?
The exit indicator is used in conjunction with other indicators in the system, such as the Moving Average (MA), the Relative Strength Index (RSI), and the Average True Range (ATR), to provide a comprehensive trading strategy.
The exit indicator in the NNFX system can be any technical indicator that is deemed effective at identifying optimal exit points. Examples of exit indicators that are commonly used include the Parabolic SAR, the Average Directional Index (ADX), and the Chandelier Exit.
The purpose of the exit indicator is to identify when a trend is likely to reverse or when the market conditions have changed, signaling the need to exit a trade. By using an exit indicator, traders can manage their risk and prevent significant losses.
In the NNFX system, the exit indicator is used in conjunction with a stop loss and a take profit order to maximize profits and minimize losses. The stop loss order is used to limit the amount of loss that can be incurred if the trade goes against the trader, while the take profit order is used to lock in profits when the trade is moving in the trader's favor.
Overall, the use of an exit indicator in the NNFX trading system is an important component of a comprehensive trading strategy. It allows traders to manage their risk effectively and improve the profitability of their trades by exiting at the right time.
How does Loxx's GKD (Giga Kaleidoscope Modularized Trading System) implement the NNFX algorithm outlined above?
Loxx's GKD v1.0 system has five types of modules (indicators/strategies). These modules are:
1. GKD-BT - Backtesting module (Volatility, Number 1 in the NNFX algorithm)
2. GKD-B - Baseline module (Baseline and Volatility/Volume, Numbers 1 and 2 in the NNFX algorithm)
3. GKD-C - Confirmation 1/2 and Continuation module (Confirmation 1/2 and Continuation, Numbers 3, 4, and 5 in the NNFX algorithm)
4. GKD-V - Volatility/Volume module (Confirmation 1/2, Number 6 in the NNFX algorithm)
5. GKD-E - Exit module (Exit, Number 7 in the NNFX algorithm)
(additional module types will added in future releases)
Each module interacts with every module by passing data between modules. Data is passed between each module as described below:
GKD-B => GKD-V => GKD-C(1) => GKD-C(2) => GKD-C(Continuation) => GKD-E => GKD-BT
That is, the Baseline indicator passes its data to Volatility/Volume. The Volatility/Volume indicator passes its values to the Confirmation 1 indicator. The Confirmation 1 indicator passes its values to the Confirmation 2 indicator. The Confirmation 2 indicator passes its values to the Continuation indicator. The Continuation indicator passes its values to the Exit indicator, and finally, the Exit indicator passes its values to the Backtest strategy.
This chaining of indicators requires that each module conform to Loxx's GKD protocol, therefore allowing for the testing of every possible combination of technical indicators that make up the six components of the NNFX algorithm.
What does the application of the GKD trading system look like?
Example trading system:
Backtest: Strategy with 1-3 take profits, trailing stop loss, multiple types of PnL volatility, and 2 backtesting styles
Baseline: Hull Moving Average
Volatility/Volume: Hurst Exponent
Confirmation 1: CCI Adaptive Smoother as shown on the chart above
Confirmation 2: Williams Percent Range
Continuation: CCI Adaptive Smoother
Exit: Rex Oscillator
Each GKD indicator is denoted with a module identifier of either: GKD-BT, GKD-B, GKD-C, GKD-V, or GKD-E. This allows traders to understand to which module each indicator belongs and where each indicator fits into the GKD protocol chain.
Giga Kaleidoscope Modularized Trading System Signals (based on the NNFX algorithm)
Standard Entry
1. GKD-C Confirmation 1 Signal
2. GKD-B Baseline agrees
3. Price is within a range of 0.2x Volatility and 1.0x Volatility of the Goldie Locks Mean
4. GKD-C Confirmation 2 agrees
5. GKD-V Volatility/Volume agrees
Baseline Entry
1. GKD-B Baseline signal
2. GKD-C Confirmation 1 agrees
3. Price is within a range of 0.2x Volatility and 1.0x Volatility of the Goldie Locks Mean
4. GKD-C Confirmation 2 agrees
5. GKD-V Volatility/Volume agrees
6. GKD-C Confirmation 1 signal was less than 7 candles prior
Volatility/Volume Entry
1. GKD-V Volatility/Volume signal
2. GKD-C Confirmation 1 agrees
3. Price is within a range of 0.2x Volatility and 1.0x Volatility of the Goldie Locks Mean
4. GKD-C Confirmation 2 agrees
5. GKD-B Baseline agrees
6. GKD-C Confirmation 1 signal was less than 7 candles prior
Continuation Entry
1. Standard Entry, Baseline Entry, or Pullback; entry triggered previously
2. GKD-B Baseline hasn't crossed since entry signal trigger
3. GKD-C Confirmation Continuation Indicator signals
4. GKD-C Confirmation 1 agrees
5. GKD-B Baseline agrees
6. GKD-C Confirmation 2 agrees
1-Candle Rule Standard Entry
1. GKD-C Confirmation 1 signal
2. GKD-B Baseline agrees
3. Price is within a range of 0.2x Volatility and 1.0x Volatility of the Goldie Locks Mean
Next Candle:
1. Price retraced (Long: close < close or Short: close > close )
2. GKD-B Baseline agrees
3. GKD-C Confirmation 1 agrees
4. GKD-C Confirmation 2 agrees
5. GKD-V Volatility/Volume agrees
1-Candle Rule Baseline Entry
1. GKD-B Baseline signal
2. GKD-C Confirmation 1 agrees
3. Price is within a range of 0.2x Volatility and 1.0x Volatility of the Goldie Locks Mean
4. GKD-C Confirmation 1 signal was less than 7 candles prior
Next Candle:
1. Price retraced (Long: close < close or Short: close > close )
2. GKD-B Baseline agrees
3. GKD-C Confirmation 1 agrees
4. GKD-C Confirmation 2 agrees
5. GKD-V Volatility/Volume Agrees
1-Candle Rule Volatility/Volume Entry
1. GKD-V Volatility/Volume signal
2. GKD-C Confirmation 1 agrees
3. Price is within a range of 0.2x Volatility and 1.0x Volatility of the Goldie Locks Mean
4. GKD-C Confirmation 1 signal was less than 7 candles prior
Next Candle:
1. Price retraced (Long: close < close or Short: close > close)
2. GKD-B Volatility/Volume agrees
3. GKD-C Confirmation 1 agrees
4. GKD-C Confirmation 2 agrees
5. GKD-B Baseline agrees
PullBack Entry
1. GKD-B Baseline signal
2. GKD-C Confirmation 1 agrees
3. Price is beyond 1.0x Volatility of Baseline
Next Candle:
1. Price is within a range of 0.2x Volatility and 1.0x Volatility of the Goldie Locks Mean
2. GKD-C Confirmation 1 agrees
3. GKD-C Confirmation 2 agrees
4. GKD-V Volatility/Volume Agrees
]█ Setting up the GKD
The GKD system involves chaining indicators together. These are the steps to set this up.
Use a GKD-C indicator alone on a chart
1. Inside the GKD-C indicator, change the "Confirmation Type" setting to "Solo Confirmation Simple"
Use a GKD-V indicator alone on a chart
**nothing, it's already useable on the chart without any settings changes
Use a GKD-B indicator alone on a chart
**nothing, it's already useable on the chart without any settings changes
Baseline (Baseline, Backtest)
1. Import the GKD-B Baseline into the GKD-BT Backtest: "Input into Volatility/Volume or Backtest (Baseline testing)"
2. Inside the GKD-BT Backtest, change the setting "Backtest Special" to "Baseline"
Volatility/Volume (Volatility/Volume, Backte st)
1. Inside the GKD-V indicator, change the "Testing Type" setting to "Solo"
2. Inside the GKD-V indicator, change the "Signal Type" setting to "Crossing" (neither traditional nor both can be backtested)
3. Import the GKD-V indicator into the GKD-BT Backtest: "Input into C1 or Backtest"
4. Inside the GKD-BT Backtest, change the setting "Backtest Special" to "Volatility/Volume"
5. Inside the GKD-BT Backtest, a) change the setting "Backtest Type" to "Trading" if using a directional GKD-V indicator; or, b) change the setting "Backtest Type" to "Full" if using a directional or non-directional GKD-V indicator (non-directional GKD-V can only test Longs and Shorts separately)
6. If "Backtest Type" is set to "Full": Inside the GKD-BT Backtest, change the setting "Backtest Side" to "Long" or "Short
7. If "Backtest Type" is set to "Full": To allow the system to open multiple orders at one time so you test all Longs or Shorts, open the GKD-BT Backtest, click the tab "Properties" and then insert a value of something like 10 orders into the "Pyramiding" settings. This will allow 10 orders to be opened at one time which should be enough to catch all possible Longs or Shorts.
Solo Confirmation Simple (Confirmation, Backtest)
1. Inside the GKD-C indicator, change the "Confirmation Type" setting to "Solo Confirmation Simple"
1. Import the GKD-C indicator into the GKD-BT Backtest: "Input into Backtest"
2. Inside the GKD-BT Backtest, change the setting "Backtest Special" to "Solo Confirmation Simple"
Solo Confirmation Complex without Exits (Baseline, Volatility/Volume, Confirmation, Backtest)
1. Inside the GKD-V indicator, change the "Testing Type" setting to "Chained"
2. Import the GKD-B Baseline into the GKD-V indicator: "Input into Volatility/Volume or Backtest (Baseline testing)"
3. Inside the GKD-C indicator, change the "Confirmation Type" setting to "Solo Confirmation Complex"
4. Import the GKD-V indicator into the GKD-C indicator: "Input into C1 or Backtest"
5. Inside the GKD-BT Backtest, change the setting "Backtest Special" to "GKD Full wo/ Exits"
6. Import the GKD-C into the GKD-BT Backtest: "Input into Exit or Backtest"
Solo Confirmation Complex with Exits (Baseline, Volatility/Volume, Confirmation, Exit, Backtest)
1. Inside the GKD-V indicator, change the "Testing Type" setting to "Chained"
2. Import the GKD-B Baseline into the GKD-V indicator: "Input into Volatility/Volume or Backtest (Baseline testing)"
3. Inside the GKD-C indicator, change the "Confirmation Type" setting to "Solo Confirmation Complex"
4. Import the GKD-V indicator into the GKD-C indicator: "Input into C1 or Backtest"
5. Import the GKD-C indicator into the GKD-E indicator: "Input into Exit"
6. Inside the GKD-BT Backtest, change the setting "Backtest Special" to "GKD Full w/ Exits"
7. Import the GKD-E into the GKD-BT Backtest: "Input into Backtest"
Full GKD without Exits (Baseline, Volatility/Volume, Confirmation 1, Confirmation 2, Continuation, Backtest)
1. Inside the GKD-V indicator, change the "Testing Type" setting to "Chained"
2. Import the GKD-B Baseline into the GKD-V indicator: "Input into Volatility/Volume or Backtest (Baseline testing)"
3. Inside the GKD-C 1 indicator, change the "Confirmation Type" setting to "Confirmation 1"
4. Import the GKD-V indicator into the GKD-C 1 indicator: "Input into C1 or Backtest"
5. Inside the GKD-C 2 indicator, change the "Confirmation Type" setting to "Confirmation 2"
6. Import the GKD-C 1 indicator into the GKD-C 2 indicator: "Input into C2"
7. Inside the GKD-C Continuation indicator, change the "Confirmation Type" setting to "Continuation"
8. Inside the GKD-BT Backtest, change the setting "Backtest Special" to "GKD Full wo/ Exits"
9. Import the GKD-E into the GKD-BT Backtest: "Input into Exit or Backtest"
Full GKD with Exits (Baseline, Volatility/Volume, Confirmation 1, Confirmation 2, Continuation, Exit, Backtest)
1. Inside the GKD-V indicator, change the "Testing Type" setting to "Chained"
2. Import the GKD-B Baseline into the GKD-V indicator: "Input into Volatility/Volume or Backtest (Baseline testing)"
3. Inside the GKD-C 1 indicator, change the "Confirmation Type" setting to "Confirmation 1"
4. Import the GKD-V indicator into the GKD-C 1 indicator: "Input into C1 or Backtest"
5. Inside the GKD-C 2 indicator, change the "Confirmation Type" setting to "Confirmation 2"
6. Import the GKD-C 1 indicator into the GKD-C 2 indicator: "Input into C2"
7. Inside the GKD-C Continuation indicator, change the "Confirmation Type" setting to "Continuation"
8. Import the GKD-C Continuation indicator into the GKD-E indicator: "Input into Exit"
9. Inside the GKD-BT Backtest, change the setting "Backtest Special" to "GKD Full w/ Exits"
10. Import the GKD-E into the GKD-BT Backtest: "Input into Backtest"
Baseline + Volatility/Volume (Baseline, Volatility/Volume, Backtest)
1. Inside the GKD-V indicator, change the "Testing Type" setting to "Baseline + Volatility/Volume"
2. Inside the GKD-V indicator, make sure the "Signal Type" setting is set to "Traditional"
3. Import the GKD-B Baseline into the GKD-V indicator: "Input into Volatility/Volume or Backtest (Baseline testing)"
4. Inside the GKD-BT Backtest, change the setting "Backtest Special" to "Baseline + Volatility/Volume"
5. Import the GKD-V into the GKD-BT Backtest: "Input into C1 or Backtest"
6. Inside the GKD-BT Backtest, change the setting "Backtest Type" to "Full". For this backtest, you must test Longs and Shorts separately
7. To allow the system to open multiple orders at one time so you can test all Longs or Shorts, open the GKD-BT Backtest, click the tab "Properties" and then insert a value of something like 10 orders into the "Pyramiding" settings. This will allow 10 orders to be opened at one time which should be enough to catch all possible Longs or Shorts.
Requirements
Inputs
Confirmation 1: GKD-V Volatility / Volume indicator
Confirmation 2: GKD-C Confirmation indicator
Continuation: GKD-C Confirmation indicator
Solo Confirmation Simple: GKD-B Baseline
Solo Confirmation Complex: GKD-V Volatility / Volume indicator
Solo Confirmation Super Complex: GKD-V Volatility / Volume indicator
Stacked 1: None
Stacked 2+: GKD-C, GKD-V, or GKD-B Stacked 1
Outputs
Confirmation 1: GKD-C Confirmation 2 indicator
Confirmation 2: GKD-C Continuation indicator
Continuation: GKD-E Exit indicator
Solo Confirmation Simple: GKD-BT Backtest
Solo Confirmation Complex: GKD-BT Backtest or GKD-E Exit indicator
Solo Confirmation Super Complex: GKD-C Continuation indicator
Stacked 1: GKD-C, GKD-V, or GKD-B Stacked 2+
Stacked 2+: GKD-C, GKD-V, or GKD-B Stacked 2+ or GKD-BT Backtest
Additional features will be added in future releases.

Real Woodies CCIAs always, this is not financial advice and use at your own risk. Trading is risky and can cost you significant sums of money if you are not careful. Make sure you always have a proper entry and exit plan that includes defining your risk before you enter a trade.
Ken Wood is a semi-famous trader that grew in popularity in the 1990s and early 2000s due to the establishment of one of the earliest trading forums online. This forum grew into "Woodie's CCI Club" due to Wood's love of his modified Commodity Channel Index (CCI) that he used extensively. From what I can tell, the website is still active and still follows the same core principles it did in the early days, the CCI is used for entries, range bars are used to help trader's cut down on the noise, and the optional addition of Woodie's Pivot Points can be used as further confirmation of support and resistance. This is my take on his famous "Woodie's CCI" that has become standard on many charting packages through the years, including a TradingView sponsored version as one of the many stock indicators provided by TradingView. Woodie has updated his CCI through the years to include several very cool additions outside of the standard CCI. I will have to say, I am a bit biased, but I think this is hands down one of the best indicators I have ever used, and I am far too young to have been part of the original CCI Club. Being a daytrader primarily, this fits right in my timeframe wheel house. Woodie designed this indicator to work on a day-trading time scale and he frequently uses this to trade futures and commodity contracts on the 30 minute, often even down to the one minute timeframe. This makes it unique in that it is probably one of the only daytrading-designed indicators out there that I am aware of that was not a popular indicator, like the MACD or RSI, that was just adopted by daytraders.
The CCI was originally created by Donald Lambert in 1980. Over time, it has become an extremely popular house-hold indicator, like the Stochastics, RSI, or MACD. However, like the RSI and Stochastics, there are extensive debates on how the CCI is actually meant to be used. Some trade it like a reversal indicator, where values greater than 100 or less than -100 are considered overbought or oversold, respectively. Others trade it like a typical zero-line cross indicator, where once the value goes above or below the zero-line, a trade should be considered in that direction. Lastly, some treat it as strictly a momentum indicator, where values greater than 100 or less than -100 are seen as strong momentum moves and when these values are reached, a new strong trend is establishing in the direction of the move. The CCI itself is nothing fancy, it just visualizes the distance of the closing price away from a user-defined SMA value and plots it as a line. However, Woodie's CCI takes this simple concept and adds to it with an indicator with 5 pieces to it designed to help the trader enter into the highest probability setups. Bear with me, it initially looks super complicated, but I promise it is pretty straight-forward and a fun indicator to use.
1) The CCI Histogram. This is your standard CCI value that you would find on the normal CCI. Woodie's CCI uses a value of 14 for most trades and a value of 20 when the timeframe is equal to or greater than 30minutes. I personally use this as a 20-period CCI on all time frames, simply for the fact that the 20 SMA is a very popular moving average and I want to know what the crowd is doing. This is your coloured histogram with 4 colours. A gray colouring is for any bars above or below the zero line for 1-4 bars. A yellow bar is a "trend bar", where the long period CCI has been above/below the zero line for 5 consecutive bars, indicating that a trend in the current direction has been established. Blue bars above and red bars below are simply 6+n number of bars above or below the zero line confirming trend. These are used for the Zero-Line Reject Trade (explained below). The CCI Histogram has a matching long-period CCI line that is painted the same colour as the histogram, it is the same thing but is used just to outline the Histogram a bit better.
2) The CCI Turbo line. This is a sped-up 6 period CCI. This is to be used for the Zero-Line Reject trades, trendline breaks, and to identify shorter term overbought/oversold conditions against the main trend. This is coloured as the white line.
3) The Least Squares Moving Average Baseline (LSMA) Zero Line. You will notice that the Zero Line of the indicator is either green or red. This is based on when price is above or below the 25-period LSMA on the chart. The LSMA is a 25 period linear regression moving average and is one of the best moving averages out there because it is more immune to noise than a typical MA. Statistically, an LSMA is designed to find the line of best fit across the lookback periods and identify whether price is advancing, declining, or flat, without the whipsaw that other MAs can be privy to. The zero line of the indicator will turn green when the close candle is over the LSMA or red when it is below the LSMA. This is meant to be a confirmation tool only and the CCI Histogram and Turbo Histogram can cross this zero line without any corresponding change in the colour of the zero line on that immediate candle.
4) The +100 and -100 lines are used in two ways. First, they can be used by the CCI Histogram and CCI Turbo as a sort of minor price resistance and if the CCI values cannot get through these, it is considered weakness in that trade direction until they do so. You will notice that both of these lines are multi-coloured. They have been plotted with the ChopZone Indicator, another TradingView built-in indicator. The ChopZone is a trend identification tool that uses the slope and the direction of a 34-period EMA to identify when price is trending or range bound. While there are ~10 different colours, the main two a trader needs to pay attention to are the turquoise/cyan blue, which indicates price is in an uptrend, and dark red, which indicates price is in a downtrend based on the slope and direction of the 34 EMA. All other colours indicate "chop". These colours are used solely for the Zero-Line Reject and pattern trades discussed below. They are plotted both above and below so you can easily see the colouring no matter what side of the zero line the CCI is on.
5) The +200 and -200 lines are also used in two ways. First, they are considered overbought/oversold levels where if price exceeds these lines then it has moved an extreme amount away from the average and is likely to experience a pullback shortly. This is more useful for the CCI Histogram than the Turbo CCI, in all honesty. You will also notice that these are coloured either red, green, or yellow. This is the Sidewinder indicator portion. The documentation on this is extremely sparse, only pointing to a "relationship between the LSMA and the 34 EMA" (see here: tlc.thinkorswim.com). Since I am not a member of Woodie's CCI Club and never intend to be I took some liberty here and decided that the most likely relationship here was the slope of both moving averages. Therefore, the Sidewinder will be green when both the LSMA and the 34 EMA are rising, red when both are falling, and yellow when they are not in agreement with one another (i.e. one rising/flat while the other is flat/falling). I am a big fan of Dr. Alexander Elder as those who follow me know, so consider this like Woodie's version of the Elder Impulse System. I will fully admit that this version of the Sidewinder is a guess and may not represent the real Sidewinder indicator, but it is next to impossible to find any information on this, so I apologize, but my version does do something useful anyways. This is also to be used only with the Zero-Line Reject trades. They are plotted both above and below so you can easily see the colouring no matter what side of the zero line the CCI is on.
How to Trade It According to Woodie's CCI Club:
Now that I have all of my components and history out of the way, this is what you all care about. I will only provide a brief overview of the trades in this system, but there are quite a few more detailed descriptions listed in the Woodie's CCI Club pamphlet. I have had little success trading the "patterns" but they do exist and do work on occasion. I just prefer to trade with the flow of the markets rather than getting overly scalpy. If you are interested in these patterns, see the pamphlet here (www.trading-attitude.com), hop into the forums and see for yourself, or check out a couple of the YouTube videos.
1) Zero line cross. As simple as any other momentum oscillator out there. When the long period CCI crosses above or below the zero line open a trade in that direction. Extra confirmation can be had when the CCI Turbo has already broken the +100/-100 line "resistance or support". Trend traders may wish to wait until the yellow "trend confirmation bar" has been printed.
2) Zero Line Reject. This is when the CCI Turbo heads back down to the zero line and then bounces back in the same direction of the prevailing trend. These are fantastic continuation trades if you missed the initial entry either on the zero line cross or on the trend bar establishment. ZLR trades are only viable when you have the ChopZone indicator showing a trend (turquoise/cyan for uptrend, dark red for downtrend), the LSMA line is green for an uptrend or red for a downtrend, and the SideWinder is either green confirming the uptrend or red confirming the downtrend.
3) Hook From Extreme. This is the exact same as the Zero Line Reject trade, however, the CCI Turbo now goes to the +100/-100 line (whichever is opposite the currently established trend) and then hooks back into the established trend direction. Ideally the HFE trade needs to have the Long CCI Histogram above/below the corresponding 100 level and the CCI Turbo both breaks the 100 level on the trend side and when it does break it has increased ~20 points from the previous value (i.e. CCI Histogram = +150 with LSMA, CZ, and SW all matching up and trend bars printed on CCI Histogram, CCI Turbo went to -120 and bounced to +80 on last 2 bars, current bar closes with CCI Turbo closing at +110).
4) Trend Line Break. Either the CCI Turbo or CCI Histogram, whichever you prefer (I find the Turbo a bit more accurate since its a faster value) creates a series of higher highs/lows you can draw a trend line linking them. When the line breaks the trendline that is your signal to take a counter trade position. For example, if the CCI Turbo is making consistently higher lows and then breaks the trendline through the zero line, you can then go short. This is a good continuation trade.
5) The Tony Trade. Consider this like a combination zero line reject, trend line break, and weak zero line cross all in one. The idea is that the SW, CZ, and LSMA values are all established in one direction. The CCI Histogram should be in an established trend and then cross the zero line but never break the 100 level on the new side as long as it has not printed more than 9 bars on the new side. If the CCI Histogram prints 9 or less bars on the new side and then breaks the trendline and crosses back to the original trend side, that is your signal to take a reversal trade. This is best used in the Elder Triple Screen method (discussed in final section) as a failed dip or rip.
6) The GB100 Trade. This is a similar trade as the Tony Trade, however, the CCI Histogram can break the 100 level on the new side but has to have made less than 6 bars on the new side. A trendline break is not necessary here either, it is more of a "pop and drop" or "momentum failure" trade trying in the new direction.
7) The Famir Trade. This is a failed CCI Long Histogram ZLR trade and is quite complicated. I have never traded this but it is in the pamphlet. Essentially you have a typical ZLR reject (i.e. all components saying it is likely a long/short continuation trade), but the ZLR only stays around the 50 level, goes back to the trend side, fails there as well immediately after 1 bar and then rebreaks to the new side. This is important to be considered with the LSMA value matching the side of the trade, so if the Famir says to go long, you need the LSMA indicator to also say to go long.
8) The Vegas Trade. This is essentially a trend-reversal trade that takes into account the LSMA and a cup and handle formation on the CCI Long Histogram after it has reached an extreme value (+200/-200). You will see the CCI Histogram hit the extreme value, head towards the zero line, and then sort of round out back in the direction of the extreme price. The low point where it reversed back in the direction of the extreme can be considered support or resistance on the CCI and once the CCI Long Histogram breaks this level again, with LSMA confirmation, you can take a counter trend trade with a stop under/over the highest/lowest point of the last 2 bars as you want to be out quickly if you are wrong without much damage but can get a huge win if you are right and add later to the position once a new trade has formed.
9) The Ghost Trade. This is nothing more than a(n) (inverse) head and shoulders pattern created on the CCI. Draw a trend line connecting the head and shoulders and trade a reversal trade once the CCI Long Histogram breaks the trend line. Same deal as the Vegas Trade, stop over/under the most recent 2 bar high/low and add later if it is a winner but cut quickly if it is a loser.
Like I said, this is a complicated system and could quite literally take years to master if you wanted to go into the patterns and master them. I prefer to trade it in a much simpler format, using the Elder Triple Screen System. First, since I am a day trader, I look to use the 20 period Woodie's on the hourly and look at the CZ, SW, and LSMA values to make sure they all match the direction of the CCI Long Histogram (a trend establishment is not necessary here). It shows you the hourly trend as your "tide". I then drill down to the 15 minute time frame and use the Turbo CCI break in the opposite direction of the trend as my "wave" and to indicate when there is a dip or rip against the main trend. Lastly, I drill down to a 3 minute time frame and enter when the CCI Long Histogram turns back to match the main trend ("ripple") as long as the CCI Turbo has broken the 100 level in the matched direction.
Enjoy, and please read the pamphlet if you have any questions about the patterns as they are not how I use these and will not be able to answer those questions.

MTF CCI with timeframe control function and signal/alertJapanese below. / 日本語説明は下記
Summary
This indicator shows CCI of the current timeframe and another CCI from upper timeframe as MTF CCI with ability to show signals and set alerts when crossing upper/bottom bands.
For general use of CCI, please refer to the link below(by TradingView)
jp.tradingview.com
How is it different from other MTF CCI indicators?
Problems with other MTF CCI indicators are;
-If you set higher timeframe CCI(MTF CCI), it will also be shown on further higher time frames.
i.e. If you set 4hour chart’s CCI on 1 hour or lower time frame charts, it will also appear on daily and weekly chart, which is not necessary.
To tackle these problems, this indicator has incorporated functions below.
-To be able to control timeframes where MTF CCI is displayed to eliminate unnecessary information when you open higher time frame’s charts.
For example, if you select daily timeframe for MTF CCI, the CCI will be shown only on 4 hour or lower timeframes.
These are the values added on this indicator.
Specifications
-This indicator shows one CCI from the current timeframe and another CCI from another timeframe(MTF).
-For MTF CCI, you can select upper timeframe from monthly, weekly, daily, 4hour, 1hour, 30mins, 15mins, 5mins.
Again, if you select weekly for MTF, for instance, then MTF CCI will be displayed on daily or lower timeframes. Other timeframes work same.
-For both CCI(current timeframe) and CCI(MTF), signals will be shown when they cross over/under upper band and lower band, which you can control display on style tab of the indicator.
-Alert can be set same as signal conditions.
Please see the sample chart below.
Brown triangle is signal for CCI(current timeframe) and maroon signal is for MTF CCI.
--------------------------------------------------------------------------------------------------
現在時間軸のCCIと上位足のCCIを表示するマルチタイムフレームCCI(MTF CCI)インジケーターです。アッパーバンド、ロワーバンドと交差した時にシグナルを表示するとともに、アラートの設定も可能です。
CCIの一般的な使い方は以下のリンク(TradingView)を参照ください。
jp.tradingview.com
他のマルチタイムフレームCCIとの違い
他のマルチタイムフレームCCIのインジケーターでは、以下の問題に直面します。
・上位足のCCIを表示すると、さらに上位足でもそのCCIが表示され見にくくなる。
例: 4時間足のCCIを下位足で表示可能な様に設定すると、日足や週足でも表示され、チャートがノイズだらけに・・・
この問題に対して、このインジケーターでは、
・上位足のCCIを表示する時間軸を制御することで上位足で不必要な情報を表示させない。
という機能を加えることでこれらの問題を解決しています。
機能概要
・このインジケーターでは現在の時間軸のCCIと上位足から一つのCCIを表示します。
・上位足は月足、週足、日足、4時間足、1時間足、30分足、15分足、5分足から選択することが可能です。
・上位足のCCIは選択した時間軸未満の時間軸に表示されます。
例:
日足のCCI : 4時間足、1時間足、30分足、15分足、5分足、1分足チャートにのみ表示
4時間足のCCI : 1時間足、30分足、15分足、5分足、1分足チャートにのみ表示
・上位足のCCIは選択した時間軸未満の時間軸に表示されます。
・現在時間軸のCCI、MTF CCIともに、アッパーバンド/ロワーバンドと交差したタイミングでシグナルを表示することができます。(アッパーバンド/ロワーバンドそれぞれに対して上に交差、下に交差のタイミングで表示されます。不要なものはスタイル設定画面で非表示とすることができます。)
・シグナルは設定画面で表示・非表示の切り替えができます。
・シグナルと同じ条件でアラート通知の設定が可能です。
サンプルチャート
1時間足に4時間足のCCIを表示したものです。茶色の三角が現在時間軸のCCIのシグナル。赤の三角がMTF CCIのシグナルです。

The real breakout indicator CCI + Money Flow + Buy / SellComponents of the indicator
1. CCI (Commodity Channel Index)
The CCI component measures the deviation of the price from its statistical average. It is used to identify overbought or oversold conditions and is integrated into the trend logic to determine potential trend reversals. High values may indicate overbought conditions, while low values could signify oversold situations.
Detailed
The CCI (Commodity Channel Index) used in "The Real Breakout Indicator Hawk" is an enhanced version compared to the traditional CCI, offering several advantages:
1. Weighting and Smoothing Mechanism
In this version, the CCI values are weighted and smoothed using custom parameters (c1, c2, c3), which allows for greater flexibility in adjusting the sensitivity of the CCI to market conditions. This smoothing reduces noise and provides clearer signals compared to the standard CCI, which can be prone to whipsaws in volatile markets.
2. Multi-level Calculation
The indicator uses an array-based approach to calculate multiple variations of CCI values (with p as the parameter for different levels of calculation), which is then combined to create a more robust signal. This multi-level approach allows for capturing different market cycles, unlike the traditional CCI that only uses a single period for calculation.
3. Integration with Moving Averages and Trend Detection
Unlike the original CCI, which is often used in isolation, this version integrates with the trend detection logic by combining it with moving averages and money flow. The enhanced CCI contributes to the broader trend analysis, ensuring that buy/sell signals are not just based on CCI overbought/oversold levels but also validated by moving averages and slope calculations.
4. Trend-Weighted CCI
This version adds weight to recent price action trends, making it more adaptive to current market momentum. The CCI values are influenced by recent high and low prices, adding a trend-following aspect that is missing from the original CCI, which treats all price deviations equally.
This image of EURAD shows for example that when CCI component is green a strong trend is detected which can hold for up to 10 days in this example, ideal for swing trades;
EURAUD 2H
5. Improved Overbought/Oversold Detection
The script incorporates a dynamic overbought/oversold detection zone based on the enhanced CCI. It accounts for market volatility, allowing it to adjust its thresholds (such as the 200 level) more effectively in different market environments. This makes the enhanced CCI better suited for varying market conditions compared to the fixed thresholds of the original CCI.
You can see that the red diamond signal is generated at the absolute top of the price range after which price started to reverse, the detection is based on a cross over value together with Money Flow strength
BTCUSDT 2H
6. Strong Buy/Sell Confirmation
The enhanced CCI works in tandem with other components like Money Flow and Moving Averages to confirm buy or sell signals. This cross-validation makes the indicator less reliant on CCI alone and ensures that the signals generated are stronger and less prone to false positives, which is a common issue with the standalone CCI.
The green diamond buy signal in a strong downtrend is mostly a short retrace of price before continuing down further, yo can use this as an entry signal after the bounce up into an FVG for example. However when price is at a support, meaning price is not moving down further and this occurs this could be a potential reversal signal as shown on the right side on the chart below. FVG is not respected, retested and price continues up.
BTCUSDT 2H
Summary:
In summary, the enhanced CCI in this indicator improves over the original CCI by providing better noise reduction, multi-level analysis, trend integration, and adaptability to different market conditions. These improvements lead to more reliable and actionable trading signals.
2. Money Flow (MF) www.tradingview.com
The Money Flow component tracks the flow of capital in and out of an asset. Positive values indicate strong buying pressure, while negative values show selling pressure. This is smoothed to avoid noise and is used to confirm strong buy or sell conditions.
The Money Flow (MF) in "The Real Breakout Indicator Hawk" measures the flow of capital into or out of an asset, helping to assess the underlying buying or selling pressure in the market.
1. Positive Money Flow (Buying Pressure)
When the MF is positive, it indicates that more money is flowing into the asset, which suggests strong buying interest. This helps confirm that a price increase or breakout to the upside is supported by demand.
2. Negative Money Flow (Selling Pressure)
A negative MF indicates that capital is leaving the asset, reflecting selling pressure. This is a sign that the market is under bearish conditions, and prices are likely to decline or break down.
3. Confirmation of Buy and Sell Signals
The MF is used to confirm buy and sell signals generated by other components of the indicator. When the MF aligns with other bullish signals, it strengthens the buy condition, and similarly, when the MF shows strong selling pressure, it reinforces a sell signal.
4. Filtering Noise
The MF is smoothed to filter out noise, ensuring that only significant movements in buying or selling pressure are considered. This helps avoid false signals and makes the MF a reliable tool for detecting true market strength.
5. Range Sensitivity
The MF operates within defined ranges, ensuring that buy or sell signals are only triggered when the flow of money is strong enough, adding precision to signal generation.
In summary, the Money Flow component is crucial for validating market direction, enhancing signal reliability, and helping traders make more informed decisions based on the underlying capital movement in the market.
3. Moving Averages (MA)
Multiple types of moving averages (SMA, EMA, HMA, etc.) are used to smooth price action and highlight the trend direction. The script supports different types of moving averages, and their slopes are calculated to assist in identifying changes in trend momentum.
The Moving Averages (MA) section of "The Real Breakout Indicator Hawk" plays a critical role in smoothing price data, identifying trends, and generating buy/sell signals. Here’s a breakdown of what it does and how you can use it effectively without diving into the script:
1. Moving Average Types
This section allows the user to choose from different types of moving averages, each with unique characteristics:
SMA (Simple Moving Average): Takes the average of closing prices over a specific period. It’s slower and better suited for detecting long-term trends.
EMA (Exponential Moving Average): Gives more weight to recent prices, making it more responsive to new price action and suitable for short-term trading.
HMA (Hull Moving Average): A smoother and faster moving average, useful for reducing lag in fast-moving markets.
LVMA (Linear Weighted Moving Average): Places the most weight on recent prices, making it even more responsive than EMA.
Alma (Arnaud Legoux Moving Average): A smoother version that reduces noise while maintaining responsiveness to recent price action.
2. Smoothing and Trend Detection
The moving average smooths out price data to remove small fluctuations and focuses on the overall trend. When prices are trading above the moving average, it suggests that the market is in an uptrend. When prices are below the moving average, it indicates a downtrend.
3. Trend Confirmation
The moving average serves as a confirmation tool. When the price crosses above the moving average, it could signal the start of a bullish trend, and when the price crosses below, it may indicate the beginning of a bearish trend.
4. Buy and Sell Signals
Buy Signal: The system detects a buy signal when:
The moving average crosses above 0, indicating a potential upward momentum.
Other indicators like Money Flow and CCI align to confirm the trend.
Sell Signal: A sell signal is triggered when:
The moving average crosses below 0, signaling a potential downtrend.
This signal is further validated by other components such as Money Flow and CCI to reduce false signals.
5. Using Moving Averages in Trading
Crossover Strategy: One of the simplest ways to use moving averages is by employing a crossover strategy. For instance:
When the shorter-term moving average (e.g., 20-period) crosses above a longer-term moving average (e.g., 50-period), this is a bullish crossover, indicating a buy signal.
Conversely, when the shorter-term moving average crosses below the longer-term moving average, this is a bearish crossover, indicating a sell signal.
Trend Following: If you’re trading with the trend, you can use a moving average to stay in the trade as long as the price remains above (for long positions) or below (for short positions) the moving average.
Support and Resistance: Moving averages can also act as dynamic support or resistance levels. For example, in an uptrend, the CCI might bounce off the moving average, offering a good entry point for a long position. In a downtrend, the moving average could act as resistance where prices may reverse, offering a shorting opportunity.
To use the MA section effectively:
Choose the right type of moving average based on your trading style (e.g., use EMA for faster response or SMA for long-term trends).
Watch for crossovers as buy/sell signals, especially in combination with other indicators.
Follow the trend by observing whether the price is above or below the moving average.
Use the moving average as a dynamic support/resistance level to find optimal entry/exit points.
This approach makes the moving average a versatile tool for identifying trends, refining entry and exit points, and confirming overall market direction.
an example when MA crosses below 0, keep in mind that when it it starts curving up and turning green there is a reversal brewing, this could take time...
BTCUSDT 2H
4. Buy Signals
Buy signals are generated when the moving average crosses up, and the Money Flow and other trend-based conditions are met, including CCI levels confirming the strength of the breakout. Additionally, slope calculations and other momentum indicators provide extra confirmation for entries.
5. Sell Signals
Sell signals occur when the moving average crosses down, combined with negative Money Flow, confirming downward pressure. Other trend-based conditions, including the CCI, must also align to validate the signal, and slope calculations ensure that momentum is on the sell side.
6. Slope and Trend Detection
The script includes calculations for the slope of price action over a lookback period to measure trend strength and direction. The slope is normalized to help identify when the market is gaining or losing momentum. This slope is used in conjunction with the moving averages and Money Flow to give more accurate trend signals.
The Slope and Trend Detection component in "The Real Breakout Indicator Hawk" is designed to measure the direction and strength of the market’s trend by calculating the slope of the price action over a specific period. This helps to identify whether the market is gaining or losing momentum, and it is a key element in refining buy/sell signals.
Here’s how the Slope and Trend Detection works and how you can use it effectively without diving into the script:
1. Slope Calculation
Slope is essentially the rate of change of the moving average (or price) over a given number of bars. It measures how steeply the price is moving up or down.
The script calculates the slope by measuring the difference between the moving average over a defined number of bars (e.g., 12 bars in this case). A larger slope indicates a stronger trend, while a smaller slope suggests a weaker or consolidating trend.
2. Normalized Slope
The slope is normalized, meaning it is adjusted to fall within a range that makes it easier to compare across different time frames and markets. This normalization helps to gauge whether the slope is strong or weak relative to historical data.
Positive slopes (above 0) indicate an uptrend or rising price momentum, while negative slopes (below 0) indicate a downtrend or falling price momentum.
3. Trend Detection
The slope of the moving average is used to detect the current trend:
If the slope is positive, the market is in an uptrend.
If the slope is negative, the market is in a downtrend.
The stronger the slope (the steeper it is), the stronger the trend. A small slope indicates a weak trend or consolidation.
4. Slope Thresholds
The system uses thresholds to determine the significance of the slope. These thresholds are set as upper and lower bounds:
Upper Threshold: If the slope exceeds this threshold, the trend is considered strong, and it could trigger a buy signal.
Lower Threshold: If the slope falls below this threshold (into the negative range), it indicates a strong downtrend, and it could trigger a sell signal.
These thresholds help filter out weak or false signals that occur in sideways or low-momentum markets.
5. Positive and Negative Slope Arrays
The system keeps track of both positive and negative slopes over a defined lookback period (e.g., 500 bars). By storing these values, it creates a historical context that helps to assess the current slope in relation to past price movements.
It calculates the standard deviation and the average of these slopes to dynamically adjust the thresholds for each market condition, making the trend detection more adaptive to different types of assets or market phases.
6. Using Slope and Trend Detection in Trading
Buy Signal with Positive Slope: When the slope is positive and exceeds a certain threshold, it confirms that the market is in a strong uptrend. This can be used as a signal to enter a long position or add to existing long trades.
Sell Signal with Negative Slope: When the slope turns negative and falls below the lower threshold, it signals a strong downtrend, indicating a potential short-selling opportunity or the time to exit long positions.
Avoiding Flat Markets: If the slope remains close to zero (neither strongly positive nor negative), it suggests a lack of clear trend or a consolidating market. In these conditions, it might be better to avoid taking new trades or use additional filters to confirm signals.
7. Slope-Based Trend Strength Indicator
You can also use the slope as a measure of trend strength:
Strong Trend: When the slope is steep (either positive or negative), it indicates strong momentum, and you can be more confident in holding a trade in that direction.
Weak Trend or Consolidation: When the slope is flat, it indicates weak price momentum, which may signal a period of consolidation or indecision in the market.
8. Visual Representation
The slope is often visually represented as a gradient or line that fluctuates around a central point (usually zero). Positive values are shown in one color (e.g., green for an uptrend), while negative values are shown in another color (e.g., red for a downtrend). This allows traders to quickly identify the current trend direction and its strength.
Summary:
To use Slope and Trend Detection effectively:
Monitor the slope to determine the trend direction (positive = uptrend, negative = downtrend).
Look for thresholds to identify strong trends. For instance, a steep positive slope signals a strong uptrend, while a steep negative slope signals a strong downtrend.
Use slope changes to confirm buy/sell signals. For example, if you receive a buy signal and the slope is positive and increasing, it confirms that momentum is behind the trade.
Avoid low-slope periods when the slope is close to zero, indicating a lack of trend or sideways market conditions.
This approach helps traders stay on the right side of the trend while avoiding periods of low momentum, enhancing the accuracy of trade signals.
7. Banker Fund Flow Trend
This component identifies potential large institutional moves by tracking specific patterns in price and volume data. When the institutional or "banker" entry or exit conditions are met, it highlights these moments with candles and generates alerts.
The Banker Fund Flow Trend in "The Real Breakout Indicator Hawk" helps detect the flow of institutional (or "smart money") into and out of the market by tracking price trends and large player activity. It uses red and yellow candles to signal when institutional money is influencing the market.
Key Points:
Yellow Candles (Banker Entry):
A yellow candle is plotted when institutional money starts flowing into the market.
This signals a potential buy opportunity, as large market players are likely pushing prices upward.
Red Candles (Banker Exit):
A red candle appears when institutional money starts exiting the market.
This is a signal to consider selling or exiting long positions, as institutional selling could drive prices lower.
Usage:
Yellow candles: Use these as signals to enter long trades or add to existing positions, confirming upward momentum driven by institutional buyers.
Red candles: Treat these as signals to exit long trades or consider short positions, as institutional selling may lead to further downside.
BTCUSDT 2H
The yellow and red candles provide clear, actionable signals for aligning trades with institutional flows, ensuring you’re following the "smart money."
8. Dynamic Buy/Sell Calculations
A dynamic component is designed to refine the buy and sell signals further based on additional conditions like price patterns, volatility, and Money Flow. This ensures that signals are more responsive to changing market conditions.
The Dynamic Buy/Sell Calculations in "The Real Breakout Indicator Hawk" are designed to refine entry and exit points for trades by using additional conditions beyond simple crossovers. These calculations adapt to the current market conditions, making them more responsive to changes in volatility, trend strength, and momentum.
Key Features:
Dynamic Buy Calculation:
The indicator generates a buy signal when multiple conditions align. These conditions include the money flow (MF) being within a favorable range, the moving average (MA) confirming upward momentum, and the CCI and other trend components indicating strength.
This makes the buy signal more reliable, as it considers multiple aspects of market behavior (price, momentum, and money flow) to avoid false entries.
Dynamic Sell Calculation:
Similarly, the sell signal is triggered when the dynamic conditions indicate downward momentum.
This includes:
The moving average crossing down.
Negative money flow, suggesting selling pressure.
Other trend signals confirming a bearish move.
The dynamic nature of these conditions ensures that sell signals are only generated when there’s a high probability of continued downside movement.
Adaptive to Market Conditions:
The dynamic nature of these calculations means that the buy/sell signals adapt to market changes, like volatility spikes or sudden trend reversals. Instead of relying on static conditions, the system adjusts to current price movements and volatility.
Avoiding Noise:
By adding multiple filters like MF thresholds, slope, and moving averages, the dynamic calculations help reduce false signals that occur in noisy, sideways markets. This helps traders avoid entering trades during periods of low momentum or unclear trends.
How to Use:
Buy Signals: Use these signals to enter long trades when the dynamic conditions align, confirming that upward momentum is strong and backed by institutional flows.
BTCUSDT 2H
Aqua marker/cross signals (price manipulation/continuation)
BTCUSDT 2H
Sell Signals: Use the sell signals to exit long positions or enter short trades when the market shows signs of bearish momentum, confirmed by multiple conditions like MA crossovers and negative money flow.
BTCUSDT 2H
In summary, the Dynamic Buy/Sell Calculations provide a more sophisticated approach to generating trade signals by combining various trend and momentum indicators, helping traders make more informed decisions in different market conditions.
This part of the code is identifying two key trading signals: moments to buy and moments to sell based on the behavior of a calculated trend line.
Buy Condition:
The system looks for a situation where the trend has been moving downward but has started to reverse upward. Specifically, it checks if the trend was declining a little while ago, then stopped falling, and is now starting to rise. If these conditions are met and the trend is still below a certain level, the system considers this a possible time to buy.
Sell Condition:
The opposite happens for selling. The system monitors for a situation where the trend has been moving upward but starts to turn downward. It checks if the trend was rising, leveled off, and now seems to be starting to fall. If these conditions are met and the trend is above a certain level, this could indicate a good time to sell.
Visual Markers:
To help the user easily see these signals on a chart, the system places symbols at specific points. A marker appears on the chart where the conditions for buying or selling are met, allowing the trader to quickly spot potential entry or exit points in the market.
In summary, this logic is designed to detect possible changes in trend direction and signal appropriate times to consider buying or selling, with clear visual markers on the chart for quick identification.
9. Alerts for Buy and Sell
The indicator provides built-in alert conditions for both buy and sell signals. When these conditions are met, the system generates alerts, making it suitable for automated monitoring.
Each of these components works together to detect potential breakout opportunities, trend continuations, and reversals, making the indicator suitable for both short-term and long-term trading strategies.

Optimized ADX DI CCI Strategy### Key Features:
- Combines ADX, DI+/-, CCI, and RSI for signal generation.
- Supports customizable timeframes for indicators.
- Offers multiple exit conditions (Moving Average cross, ADX change, performance-based stop-loss).
- Tracks and displays trade statistics (e.g., win rate, capital growth, profit factor).
- Visualizes trades with labels and optional background coloring.
- Allows countertrading (opening an opposite trade after closing one).
1. **Indicator Calculation**:
- **ADX and DI+/-**: Calculated using the `ta.dmi` function with user-defined lengths for DI and ADX smoothing.
- **CCI**: Computed using the `ta.cci` function with a configurable source (default: `hlc3`) and length.
- **RSI (optional)**: Calculated using the `ta.rsi` function to filter overbought/oversold conditions.
- **Moving Averages**: Used for CCI signal smoothing and trade exits, with support for SMA, EMA, SMMA (RMA), WMA, and VWMA.
2. **Signal Generation**:
- **Buy Signal**: Triggered when DI+ > DI- (or DI+ crosses over DI-), CCI > MA (or CCI crosses over MA), and optional ADX/RSI filters are satisfied.
- **Sell Signal**: Triggered when DI+ < DI- (or DI- crosses over DI+), CCI < MA (or CCI crosses under MA), and optional ADX/RSI filters are satisfied.
3. **Trade Execution**:
- **Entry**: Long or short trades are opened using `strategy.entry` when signals are detected, provided trading is allowed (`allow_long`/`allow_short`) and equity is positive.
- **Exit**: Trades can be closed based on:
- Opposite signal (if no other exit conditions are used).
- MA cross (price crossing below/above the exit MA for long/short trades).
- ADX percentage change exceeding a threshold.
- Performance-based stop-loss (trade loss exceeding a percentage).
- **Countertrading**: If enabled, closing a trade triggers an opposite trade (e.g., closing a long opens a short).
4. **Visualization**:
- Labels are plotted at trade entries/exits (e.g., "BUY," "SELL," arrows).
- Optional background coloring highlights open trades (green for long, red for short).
- A statistics table displays real-time metrics (e.g., capital, win rates).
5. **Trade Tracking**:
- Tracks the number of long/short trades, wins, and overall performance.
- Monitors equity to prevent trading if it falls to zero.
### 2.3 Key Components
- **Indicator Calculations**: Uses `request.security` to fetch indicator data for the specified timeframe.
- **MA Function**: A custom `ma_func` handles different MA types for CCI and exit conditions.
- **Signal Logic**: Combines crossover/under checks with recent bar windows for flexibility.
- **Exit Conditions**: Multiple configurable exit strategies for risk management.
- **Statistics Table**: Updates dynamically with trade and capital metrics.
## 3. Configuration Options
The script provides extensive customization through input parameters, grouped for clarity in the TradingView settings panel. Below is a detailed breakdown of each setting and its impact.
### 3.1 Strategy Settings (Global)
- **Initial Capital**: Default `10000`. Sets the starting capital for backtesting.
- **Effect**: Determines the base equity for calculating position sizes and performance metrics.
- **Default Quantity Type**: `strategy.percent_of_equity` (50% of equity).
- **Effect**: Controls the size of each trade as a percentage of available equity.
- **Pyramiding**: Default `2`. Allows up to 2 simultaneous trades in the same direction.
- **Effect**: Enables multiple entries if conditions are met, increasing exposure.
- **Commission**: 0.2% per trade.
- **Effect**: Simulates trading fees, reducing net profit in backtesting.
- **Margin**: 100% for long and short trades.
- **Effect**: Assumes no leverage; adjust for margin trading simulations.
- **Calc on Every Tick**: `true`.
- **Effect**: Ensures real-time signal updates for precise execution.
### 3.2 Indicator Settings
- **Indicator Timeframe** (`indicator_timeframe`):
- **Options**: `""` (chart timeframe), `1`, `5`, `15`, `30`, `60`, `240`, `D`, `W`.
- **Default**: `""` (uses chart timeframe).
- **Effect**: Determines the timeframe for ADX, DI, CCI, and RSI calculations. A higher timeframe reduces noise but may delay signals.
### 3.3 ADX & DI Settings
- **DI Length** (`adx_di_len`):
- **Default**: `30`.
- **Range**: Minimum `1`.
- **Effect**: Sets the period for calculating DI+ and DI-. Longer periods smooth trends but reduce sensitivity.
- **ADX Smoothing Length** (`adx_smooth_len`):
- **Default**: `14`.
- **Range**: Minimum `1`.
- **Effect**: Smooths the ADX calculation. Longer periods produce smoother ADX values.
- **Use ADX Filter** (`use_adx_filter`):
- **Default**: `false`.
- **Effect**: If `true`, requires ADX to exceed the threshold for signals to be valid, filtering out weak trends.
- **ADX Threshold** (`adx_threshold`):
- **Default**: `25`.
- **Range**: Minimum `0`.
- **Effect**: Sets the minimum ADX value for valid signals when the filter is enabled. Higher values restrict trades to stronger trends.
### 3.4 CCI Settings
- **CCI Length** (`cci_length`):
- **Default**: `20`.
- **Range**: Minimum `1`.
- **Effect**: Sets the period for CCI calculation. Longer periods reduce noise but may lag.
- **CCI Source** (`cci_src`):
- **Default**: `hlc3` (average of high, low, close).
- **Effect**: Defines the price data for CCI. `hlc3` is standard, but users can choose other sources (e.g., `close`).
- **CCI MA Type** (`ma_type`):
- **Options**: `SMA`, `EMA`, `SMMA (RMA)`, `WMA`, `VWMA`.
- **Default**: `SMA`.
- **Effect**: Determines the moving average type for CCI signal smoothing. EMA is more responsive; VWMA weights by volume.
- **CCI MA Length** (`ma_length`):
- **Default**: `14`.
- **Range**: Minimum `1`.
- **Effect**: Sets the period for the CCI MA. Longer periods smooth the MA but may delay signals.
### 3.5 RSI Filter Settings
- **Use RSI Filter** (`use_rsi_filter`):
- **Default**: `false`.
- **Effect**: If `true`, applies RSI-based overbought/oversold filters to signals.
- **RSI Length** (`rsi_length`):
- **Default**: `14`.
- **Range**: Minimum `1`.
- **Effect**: Sets the period for RSI calculation. Longer periods reduce sensitivity.
- **RSI Lower Limit** (`rsi_lower_limit`):
- **Default**: `30`.
- **Range**: `0` to `100`.
- **Effect**: Defines the oversold threshold for buy signals. Lower values allow trades in more extreme conditions.
- **RSI Upper Limit** (`rsi_upper_limit`):
- **Default**: `70`.
- **Range**: `0` to `100`.
- **Effect**: Defines the overbought threshold for sell signals. Higher values allow trades in more extreme conditions.
### 3.6 Signal Settings
- **Cross Window** (`cross_window`):
- **Default**: `0`.
- **Range**: `0` to `5` bars.
- **Effect**: Specifies the lookback period for detecting DI+/- or CCI crosses. `0` requires crosses on the current bar; higher values allow recent crosses, increasing signal frequency.
- **Allow Long Trades** (`allow_long`):
- **Default**: `true`.
- **Effect**: Enables/disables new long trades. If `false`, only closing existing longs is allowed.
- **Allow Short Trades** (`allow_short`):
- **Default**: `true`.
- **Effect**: Enables/disables new short trades. If `false`, only closing existing shorts is allowed.
- **Require DI+/DI- Cross for Buy** (`buy_di_cross`):
- **Default**: `true`.
- **Effect**: If `true`, requires a DI+ crossover DI- for buy signals; if `false`, DI+ > DI- is sufficient.
- **Require CCI Cross for Buy** (`buy_cci_cross`):
- **Default**: `true`.
- **Effect**: If `true`, requires a CCI crossover MA for buy signals; if `false`, CCI > MA is sufficient.
- **Require DI+/DI- Cross for Sell** (`sell_di_cross`):
- **Default**: `true`.
- **Effect**: If `true`, requires a DI- crossover DI+ for sell signals; if `false`, DI+ < DI- is sufficient.
- **Require CCI Cross for Sell** (`sell_cci_cross`):
- **Default**: `true`.
- **Effect**: If `true`, requires a CCI crossunder MA for sell signals; if `false`, CCI < MA is sufficient.
- **Countertrade** (`countertrade`):
- **Default**: `true`.
- **Effect**: If `true`, closing a trade triggers an opposite trade (e.g., close long, open short) if allowed.
- **Color Background for Open Trades** (`color_background`):
- **Default**: `true`.
- **Effect**: If `true`, colors the chart background green for long trades and red for short trades.
### 3.7 Exit Settings
- **Use MA Cross for Exit** (`use_ma_exit`):
- **Default**: `true`.
- **Effect**: If `true`, closes trades when the price crosses the exit MA (below for long, above for short).
- **MA Length for Exit** (`ma_exit_length`):
- **Default**: `20`.
- **Range**: Minimum `1`.
- **Effect**: Sets the period for the exit MA. Longer periods delay exits.
- **MA Type for Exit** (`ma_exit_type`):
- **Options**: `SMA`, `EMA`, `SMMA (RMA)`, `WMA`, `VWMA`.
- **Default**: `SMA`.
- **Effect**: Determines the MA type for exit signals. EMA is more responsive; VWMA weights by volume.
- **Use ADX Change Stop-Loss** (`use_adx_stop`):
- **Default**: `false`.
- **Effect**: If `true`, closes trades when the ADX changes by a specified percentage.
- **ADX % Change for Stop-Loss** (`adx_change_percent`):
- **Default**: `5.0`.
- **Range**: Minimum `0.0`, step `0.1`.
- **Effect**: Specifies the percentage change in ADX (vs. previous bar) that triggers a stop-loss. Higher values reduce premature exits.
- **Use Performance Stop-Loss** (`use_perf_stop`):
- **Default**: `false`.
- **Effect**: If `true`, closes trades when the loss exceeds a percentage threshold.
- **Performance Stop-Loss (%)** (`perf_stop_percent`):
- **Default**: `-10.0`.
- **Range**: `-100.0` to `0.0`, step `0.1`.
- **Effect**: Specifies the loss percentage that triggers a stop-loss. More negative values allow larger losses before exiting.
## 4. Visual and Statistical Output
- **Labels**: Displayed at trade entries/exits with arrows (↑ for buy, ↓ for sell) and text ("BUY," "SELL"). A "No Equity" label appears if equity is zero.
- **Background Coloring**: Optionally colors the chart background (green for long, red for short) to indicate open trades.
- **Statistics Table**: Displayed at the top center of the chart, updated on timeframe changes or trade events. Includes:
- **Capital Metrics**: Initial capital, current capital, capital growth (%).
- **Trade Metrics**: Total trades, long/short trades, win rate, long/short win rates, profit factor.
- **Open Trade Status**: Indicates if a long, short, or no trade is open.
## 5. Alerts
- **Buy Signal Alert**: Triggered when `buy_signal` is true ("Cross Buy Signal").
- **Sell Signal Alert**: Triggered when `sell_signal` is true ("Cross Sell Signal").
- **Usage**: Users can set up TradingView alerts to receive notifications for trade signals.
