Consecutive Bullish/Bearish Candles🔍 Overview:
This indicator detects market manipulation and deception by identifying sequences of consecutive bullish or bearish candles. It highlights potential reversal zones where trends may exhaust or trap traders before reversing.
📌 How It Works:
The user can set a custom number of consecutive bullish or bearish candles (default: 5).
If the set number of consecutive green (bullish) or red (bearish) candles appears, the indicator plots a signal on the chart.
This pattern often signals exhaustion, stop hunts, or market traps, making it useful for traders looking for reversal opportunities.
📊 Features:
✅ Customizable candle count for detection
✅ Visual signals (✅ for bullish, ❌ for bearish)
✅ Alerts support for automated notifications
✅ Works on all timeframes and all markets (crypto, stocks, forex)
⚠️ Note:
This indicator does not guarantee reversals but helps identify areas where traders may be trapped and a trend shift is likely. Always use it with other confluence factors like volume, support/resistance, and market sentiment.
🚀 Use this tool to spot market deception and trade smart!
Utilitas Pine

Wave Modulation Demo█ OVERVIEW
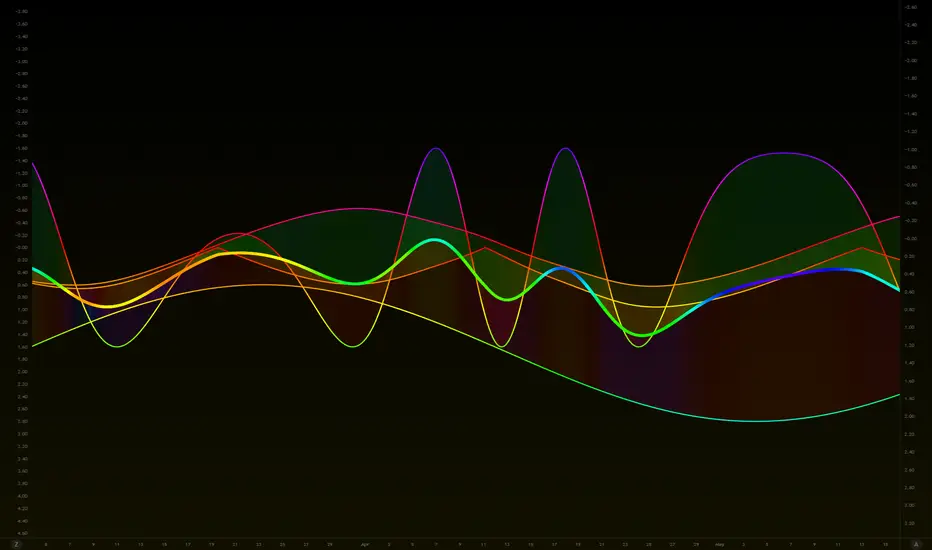
This script demonstrates Stacked Wave Modulation by visualizing four interconnected waves. Wave 1 is the base wave, influencing Wave 2's frequency, which in turn modulates Wave 3's amplitude, and finally, Wave 3 modulates Wave 4's phase. Explore the fascinating effects of wave modulation by adjusting the inputs for each wave and their modulation scales.
══════════════════════════════════════════════════
█ CONCEPTS
This script visualizes a cascade of wave modulations:
1 — Base Wave (Wave 1): This is the foundational wave. Its parameters (type, frequency, amplitude, phase, vertical shift) are directly controlled and serve as the basis for subsequent modulations.
2 — Frequency Modulation (Wave 2): Wave 2's frequency is modulated by Wave 1 . As Wave 1 oscillates, it dynamically changes the frequency of Wave 2 , creating interesting frequency variations. The Frequency Mod Scale input controls the intensity of this modulation.
3 — Amplitude Modulation (Wave 3): Building upon the cascade, Wave 3 's amplitude is modulated by Wave 2 . The peaks and troughs of Wave 2 influence the amplitude of Wave 3 , resulting in amplitude variations. The Amplitude Mod Scale input adjusts the strength of this amplitude modulation.
4 — Phase Modulation (Wave 4): Finally, Wave 4 's phase is modulated by Wave 3 . Wave 3 's oscillations shift the phase of Wave 4 , leading to phase-related distortions and dynamic wave patterns. The Phase Mod Scale input determines the extent of phase modulation.
5 — Stacked Wave (Average): The script calculates and plots the average of all four waves, providing a composite view of the combined modulation effects.
══════════════════════════════════════════════════
█ FEATURES
The script is organized into input groups for each wave, allowing for detailed customization:
1 — Wave 1: Base Wave
• Type : Select the waveform type for Wave 1 (Sine, Cosine, Triangle, Square).
• Frequency (Hz) : Sets the base frequency of Wave 1 in Hertz (cycles per second).
• Amplitude : Controls the vertical amplitude or height of Wave 1.
• Phase Shift (deg) : Adjusts the phase shift of Wave 1 in degrees, shifting the wave horizontally.
• Vertical Shift : Sets the vertical position of Wave 1 on the chart.
2 — Wave 2: Frequency Modulation
• Type : Select the waveform type for Wave 2.
• Base Frequency (Hz) : Sets the base frequency of Wave 2, before modulation.
• Amplitude : Controls the amplitude of Wave 2.
• Phase Shift (deg) : Adjusts the phase shift of Wave 2.
• Vertical Shift : Sets the vertical position of Wave 2.
• Frequency Mod Scale : Determines the degree to which Wave 1 modulates Wave 2's frequency. Higher values increase the modulation effect.
3 — Wave 3: Amplitude Modulation
• Type : Select the waveform type for Wave 3.
• Base Frequency (Hz) : Sets the base frequency of Wave 3.
• Amplitude : Controls the base amplitude of Wave 3, before modulation.
• Phase Shift (deg) : Adjusts the phase shift of Wave 3.
• Vertical Shift : Sets the vertical position of Wave 3.
• Amplitude Mod Scale : Determines the degree to which Wave 2 modulates Wave 3's amplitude. Higher values increase the modulation effect.
4 — Wave 4: Phase Modulation
• Type : Select the waveform type for Wave 4.
• Base Frequency (Hz) : Sets the base frequency of Wave 4.
• Amplitude : Controls the amplitude of Wave 4.
• Phase Shift (deg) : Sets the base phase shift of Wave 4, before modulation.
• Vertical Shift : Sets the vertical position of Wave 4.
• Phase Mod Scale : Determines the degree to which Wave 3 modulates Wave 4's phase. Higher values increase the modulation effect.
══════════════════════════════════════════════════
█ HOW TO USE
1. Add the "Stacked Wave Modulation Demo" script to your TradingView chart.
2. Explore the input settings. Each wave has its own group of customizable parameters.
3. Adjust the Type , Frequency , Amplitude , Phase Shift , and Vertical Shift for each wave to define their base characteristics.
4. Experiment with the modulation scales ( Frequency Mod Scale , Amplitude Mod Scale , Phase Mod Scale ) to control the intensity of the modulation effects between the waves.
5. Observe how the waves interact and how the modulations shape their forms and the final stacked wave (average).
══════════════════════════════════════════════════
█ NOTES
* This script utilizes the `waves` and `hsvColor` libraries. Look for other scripts on my profile.
* The frequencies are set in Hertz (cycles per second), which relate to bars on the chart. A frequency of 0.5 Hz means 0.5 cycles per bar, or 1 cycle every 2 bars.
* Adjusting the modulation scales allows you to fine-tune the visual impact of the modulation effects.
* The color of each wave plot is dynamically generated based on its value using the HSV color model for visual distinction.
* Feel free to modify and experiment with the script to create different modulation schemes or stacking methods.
Let me know if you have any other questions or would like further refinements!
Volume Flow Indicator Signals | iSolani
Volume Flow Indicator Signals | iSolani: Decoding Trend Momentum with Volume Precision
In markets where trends are fueled by institutional participation, discerning genuine momentum from false moves is critical. The Volume Flow Indicator Signals | iSolani cuts through this noise by synthesizing price action with volume dynamics, generating high-confidence signals when capital flows align with directional bias. This tool reimagines traditional volume analysis by incorporating volatility-adjusted thresholds and dual-layer smoothing, offering traders a laser-focused approach to trend identification.
Core Methodology
The indicator employs a multi-stage calculation to quantify volume-driven momentum:
Volatility-Adjusted Filter: Measures price changes via log returns, scaling significance using a 30-bar standard deviation multiplied by user-defined sensitivity (default: 2x).
Volume Normalization: Caps extreme volume spikes at 3x the 50-bar moving average, preventing distortion from anomalous trades.
Directional Volume Flow: Assigns positive/negative values to volume based on whether price movement exceeds volatility-derived thresholds.
Dual Smoothing: Applies consecutive SMA (3-bar) and EMA (14-bar) to create the Volume Flow Indicator (VFI) and its signal line, filtering out transient fluctuations.
Breaking New Ground
This implementation introduces three key innovations:
Adaptive Noise Gates: Unlike static volume oscillators, the sensitivity coefficient dynamically adjusts to market volatility, reducing false signals during choppy conditions.
Institutional Volume Capping: The vcoef parameter limits the influence of outlier volume spikes, focusing on sustained institutional activity rather than one-off trades.
Non-Repainting Signals: Generates single-per-trend labels (buy below bars, sell above) to avoid chart clutter while maintaining visual clarity.
Engine Under the Hood
The script executes through five systematic stages:
Data Preparation: Computes HLC3 typical price and its logarithmic rate of change.
Threshold Calculation: Derives dynamic cutoff levels using 30-period volatility scaled by user sensitivity.
Volume Processing: Filters raw volume through a 50-bar SMA, capping extremes at 3x average.
VFI Construction: Sums directional volume flow over 50 bars, smoothed with a 3-bar SMA.
Signal Generation: Triggers alerts when VFI crosses zero, confirmed by a 14-bar EMA crossover.
Standard Configuration
Optimized defaults balance responsiveness and reliability:
Volume MA: 50-bar smoothing window
Sensitivity: 2.0 (doubles volatility threshold)
Signal Smoothing: 14-bar EMA
Volume Cap: 3x average (hidden parameter)
VFI Smoothing: Enabled (3-bar SMA)
By fusing adaptive volume filtering with price confirmation logic, the Volume Flow Indicator Signals | iSolani transforms raw market data into institutional-grade trend signals. Its ability to mute choppy price action while amplifying high-conviction volume moves makes it particularly effective for spotting early trend reversals in equities, forex, and futures markets.

SMA Strategy Builder: Create & Prove Profitability📄 Pine Script Strategy Description (For Publishing on TradingView)
🎯 Strategy Title:
SMA Strategy Builder: Create & Prove Profitability
✨ Description:
This tool is designed for traders who want to build, customize, and prove their own SMA-based trading strategies. The strategy tracks capital growth in real-time, providing clear evidence of profitability after each trade. Users can adjust key parameters such as SMA period, take profit levels, and initial capital, making it a flexible solution for backtesting and strategy validation.
🔍 Key Features:
✅ SMA-Based Logic:
Core trading logic revolves around the Simple Moving Average (SMA).
SMA period is fully adjustable to suit various trading styles.
🎯 Customizable Take Profit (TP):
User-defined TP percentages per position.
TP line displayed as a Step Line with Breaks for clear segmentation.
Visual 🎯TP label for quick identification of profit targets.
💵 Capital Tracking (Proof of Profitability):
Initial capital is user-defined.
Capital balance updates after each closed trade.
Shows both absolute profit/loss and percentage changes for every position.
Darker green profit labels for better readability and dark red for losses.
📈 Capital Curve (Performance Visualization):
Capital growth curve available (hidden by default, can be enabled via settings).
📏 Dynamic Label Positioning:
Label positions adjust dynamically based on the price range.
Ensures consistent visibility across low and high-priced assets.
⚡ How It Works:
Long Entry:
Triggered when the price crosses above the SMA.
TP level is calculated as a user-defined percentage above the entry price.
Short Entry:
Triggered when the price crosses below the SMA.
TP level is calculated as a user-defined percentage below the entry price.
TP Execution:
Positions close immediately once the TP level is reached (no candle close confirmation needed).
🔔 Alerts:
🟩 Long Signal Alert: When the price crosses above the SMA.
🟥 Short Signal Alert: When the price crosses below the SMA.
🎯 TP Alert: When the TP target is reached.
⚙️ Customization Options:
📅 SMA Period: Choose the moving average period that best fits your strategy.
🎯 Take Profit (%): Adjust TP percentages for flexible risk management.
💵 Initial Capital: Set the starting capital for realistic backtesting.
📈 Capital Curve Toggle: Enable or disable the capital curve to track overall performance.
🌟 Why Use This Tool?
🔧 Flexible Strategy Creation: Adjust core parameters and create tailored SMA-based strategies.
📈 Performance Proof: Capital tracking acts as real proof of profitability after each trade.
🎯 Immediate TP Execution: No waiting for candle closures; profits lock in as soon as targets are hit.
💹 Comprehensive Performance Insights: Percentage-based and absolute capital tracking with dynamic visualization.
🏦 Clean Visual Indicators: Strategy insights made clear with dynamic labeling and adjustable visuals.
⚠️ Disclaimer:
This script is provided for educational and informational purposes only. Trading financial instruments carries risk, and past performance does not guarantee future results. Always perform your own due diligence before making any trading decisions.

Stock Earnings Viewer for Pine ScreenerThe script, titled "Stock Earnings Viewer with Surprise", fetches actual and estimated earnings, calculates absolute and percent surprise values, and presents them for analysis. It is intended to use in Pine Screener, as on chart it is redundant.
How to Apply to Pine Screener
Favorite this script
Open pine screener www.tradingview.com
Select "Stock Earnings Viewer with Surprise" in "Choose indicator"
Click "Scan"
Data
Actual Earnings: The reported earnings per share (EPS) for the stock, sourced via request.earnings().
Estimated Earnings: Analyst-predicted EPS, accessed with field=earnings.estimate.
Absolute Surprise: The difference between actual and estimated earnings (e.g., actual 1.2 - estimated 1.0 = 0.2).
Percent Surprise (%): The absolute surprise as a percentage of estimated earnings (e.g., (0.2 / 1.0) * 100 = 20%). Note: This may return NaN or infinity if estimated earnings are zero, due to division by zero.
Practical Use
This screener script allows users to filter stocks based on earnings metrics. For example, you could screen for stocks where Percent Surprise > 15 to find companies exceeding analyst expectations significantly, or use Absolute Surprise < -0.5 to identify underperformers.

Astro R4.0Regarding the code that has a significant impact on Pine Community and many feel helped by it, this is the code that I ported from VBA to PineScript which comes from simontelescopium owner of astroexcel dot wordpress dot com and "astrofnc" by Keith Burnett, previously I used it personally but I forgot to give a citation to those who are entitled to them both so that when I shared it for community use and it has been shared by brother @BarefootJoey with the additions made by him personally, there was no citation for them.
Apologies for my negligence because I am only human.
Hopefully with this script it can help the community to see the potential for implementation in the trading world as a significant variable.
Finally, I publish this script as a reference to find out astronomical charts presented in table form to make it easier to visualize and debug as long as the input.timestamp() allow it.
Future updates for optimization using library of brother @BarefootJoey
Thank you.

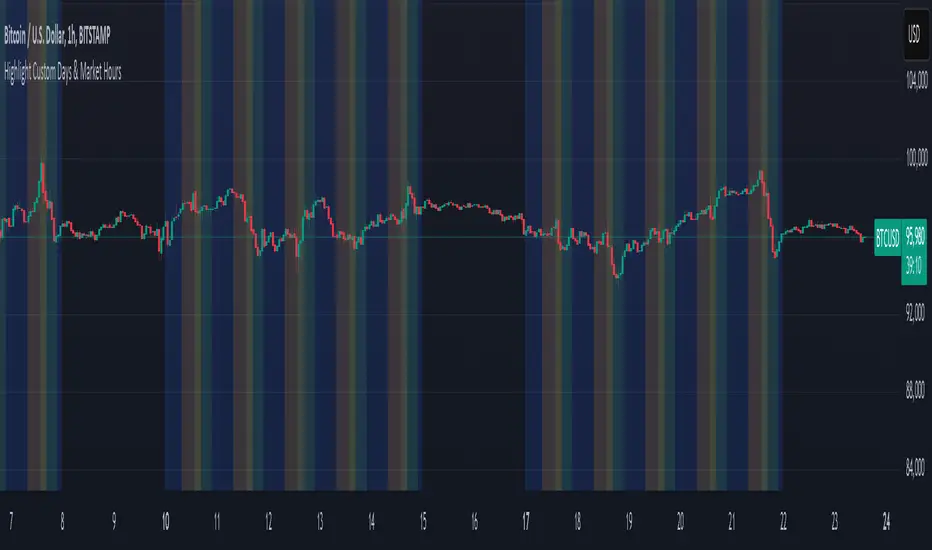
Mon to Fri + LSE and NYSE📌 Highlight Custom Days & Market Hours Indicator 📌
🔹 Overview:
This script allows traders to visually highlight specific weekdays and market sessions directly on their TradingView charts. With customizable checkboxes, you can choose which days of the week to highlight, along with session times for the New York Stock Exchange (NYSE) and London Stock Exchange (LSE).
🔹 Features:
✅ Select individual weekdays (Monday–Friday) to highlight in blue
✅ Highlight NYSE open hours (2:30 PM – 9:30 PM UK time) in green
✅ Highlight LSE open hours (8:00 AM – 4:30 PM UK time) in orange
✅ Ensures NYSE & LSE sessions are only highlighted on weekdays (no weekends)
✅ Clean and simple visualization for enhanced market awareness
🔹 How to Use:
1️⃣ Add the indicator to your TradingView chart
2️⃣ Use the settings panel to enable/disable specific weekdays
3️⃣ Toggle NYSE or LSE session highlights based on your trading preference
🚀 Perfect for traders who follow institutional sessions and want better time-based confluence in their strategies!
Auto Levels Test RHAuto Levels Test RH is an indicator that automatically draws support and resistance levels based on local extremes and the ZigZag pattern. It helps traders identify key levels for entering and exiting trades. The indicator analyzes the last 100 bars and determines significant price zones.

Cash And Carry Arbitrage BTC Compare Month 6 by SeoNo1Detailed Explanation of the BTC Cash and Carry Arbitrage Script
Script Title: BTC Cash And Carry Arbitrage Month 6 by SeoNo1
Short Title: BTC C&C ABT Month 6
Version: Pine Script v5
Overlay: True (The indicators are plotted directly on the price chart)
Purpose of the Script
This script is designed to help traders analyze and track arbitrage opportunities between the spot market and futures market for Bitcoin (BTC). Specifically, it calculates the spread and Annual Percentage Yield (APY) from a cash-and-carry arbitrage strategy until a specific expiry date (in this case, June 27, 2025).
The strategy helps identify profitable opportunities when the futures price of BTC is higher than the spot price. Traders can then buy BTC in the spot market and short BTC futures contracts to lock in a risk-free profit.
1. Input Settings
Spot Symbol: The real-time BTC spot price from Binance (BTCUSDT).
Futures Symbol: The BTC futures contract that expires in June 2025 (BTCUSDM2025).
Expiry Date: The expiration date of the futures contract, set to June 27, 2025.
These inputs allow users to adjust the symbols or expiry date according to their trading needs.
2. Price Data Retrieval
Spot Price: Fetches the latest closing price of BTC from the spot market.
Futures Price: Fetches the latest closing price of BTC futures.
Spread: The difference between the futures price and the spot price (futures_price - spot_price).
The spread indicates how much higher (or lower) the futures price is compared to the spot market.
3. Time to Maturity (TTM) and Annual Percentage Yield (APY) Calculation
Current Date: Gets the current timestamp.
Time to Maturity (TTM): The number of days left until the futures contract expires.
APY Calculation:
Formula:
APY = ( Spread / Spot Price ) x ( 365 / TTM Days ) x 100
This represents the annualized return from holding a cash-and-carry arbitrage position if the trader buys BTC at the spot price and sells BTC futures.
4. Display Information Table on the Chart
A table is created on the chart's top-right corner showing the following data:
Metric: Labels such as Spread and APY
Value: Displays the calculated spread and APY
The table automatically updates at the latest bar to display the most recent data.
5. Alert Condition
This sets an alert condition that triggers every time the script runs.
In practice, users can modify this alert to trigger based on specific conditions (e.g., APY exceeds a threshold).
6. Plotting the APY and Spread
APY Plot: Displays the annualized yield as a blue line on the chart.
Spread Plot: Visualizes the futures-spot spread as a red line.
This helps traders quickly identify arbitrage opportunities when the spread or APY reaches desirable levels.
How to Use the Script
Monitor Arbitrage Opportunities:
A positive spread indicates a potential cash-and-carry arbitrage opportunity.
The larger the APY, the more profitable the arbitrage opportunity could be.
Timing Trades:
Execute a buy on the BTC spot market and simultaneously sell BTC futures when the APY is attractive.
Close both positions upon futures contract expiry to realize profits.
Risk Management:
Ensure you have sufficient margin to hold both positions until expiry.
Monitor funding rates and volatility, which could affect returns.
Conclusion
This script is an essential tool for traders looking to exploit price discrepancies between the BTC spot market and futures market through a cash-and-carry arbitrage strategy. It provides real-time data on spreads, annualized returns (APY), and visual alerts, helping traders make informed decisions and maximize their profit potential.

Oblique StrategiesHi, this is a fun script that will print an Oblique Strategy to help you think laterally for the day of trading ahead of you.
Oblique Strategies are a concept conceived by Brian Eno the Music Producer, Artist, and modern-day philosopher. Oblique Strategies are a pack of 52 cards that have a creative suggestion on each one. When Brian was at a point at which he could not see a clear way forward in his creations, he would pick out a random card out of the Oblique Strategies pack, to help him think differently as to how to move forward. They are specifically devised for music creators, but i find the help in a multitude of situations.
Enjoy!

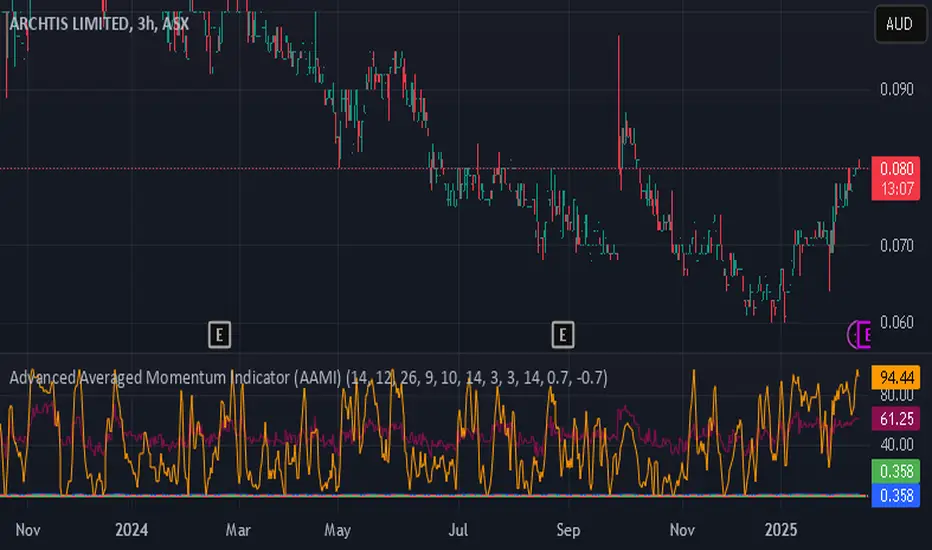
Advanced Averaged Momentum Indicator (AAMI)Key Features of AAMI:
Combination of Momentum Indicators: It averages normalized values from RSI, MACD histogram, raw Momentum, and Stochastic oscillator to give a comprehensive view of momentum.
Normalization: Each component is normalized to a scale from -1 to 1 to ensure they contribute equally to the AMI calculation.
Visual Cues: The indicator includes visual levels for neutral, overbought, and oversold conditions to aid in quick decision-making.
Alerts: Basic alert conditions are included for when AMI moves into overbought or oversold territory, which traders can customize further.
Customizable: All parameters can be adjusted within TradingView to tailor the indicator to different market conditions or trading strategies.
Smoothing: Included an SMA for AMI to reduce noise and give smoother signals.
Divergence Detection: Implemented a basic divergence detection mechanism to spot potential reversals.
Usage Tips:
Overbought/Oversold: When AMI goes above 0.7, it might suggest an overbought condition, potentially signaling a sell or take profit. Below -0.7 might indicate oversold conditions, suggesting a buy opportunity.
Divergence: Watch for divergences between the AMI and price action for signals of potential trend reversals.
Crossing Zero: The AMI crossing from negative to positive might be used as a buy signal, and vice versa for a sell signal.
This script provides a new way to view momentum by consolidating multiple traditional indicators into one, potentially offering clearer signals in complex market environments.
Cluster Reversal Zones📌 Cluster Reversal Zones – Smart Market Turning Point Detector
📌 Category : Public (Restricted/Closed-Source) Indicator
📌 Designed for : Traders looking for high-accuracy reversal zones based on price clustering & liquidity shifts.
🔍 Overview
The Cluster Reversal Zones Indicator is an advanced market reversal detection tool that helps traders identify key turning points using a combination of price clustering, order flow analysis, and liquidity tracking. Instead of relying on static support and resistance levels, this tool dynamically adjusts to live market conditions, ensuring traders get the most accurate reversal signals possible.
📊 Core Features:
✅ Real-Time Reversal Zone Mapping – Detects high-probability market turning points using price clustering & order flow imbalance.
✅ Liquidity-Based Support/Resistance Detection – Identifies strong rejection zones based on real-time liquidity shifts.
✅ Order Flow Sensitivity for Smart Filtering – Filters out weak reversals by detecting real market participation behind price movements.
✅ Momentum Divergence for Confirmation – Aligns reversal zones with momentum divergences to increase accuracy.
✅ Adaptive Risk Management System – Adjusts risk parameters dynamically based on volatility and trend state.
🔒 Justification for Mashup
The Cluster Reversal Zones Indicator contains custom-built methodologies that extend beyond traditional support/resistance indicators:
✔ Smart Price Clustering Algorithm: Instead of plotting fixed support/resistance lines, this system analyzes historical price clustering to detect active reversal areas.
✔ Order Flow Delta & Liquidity Shift Sensitivity: The tool tracks real-time order flow data, identifying price zones with the highest accumulation or distribution levels.
✔ Momentum-Based Reversal Validation: Unlike traditional indicators, this tool requires a momentum shift confirmation before validating a potential reversal.
✔ Adaptive Reversal Filtering Mechanism: Uses a combination of historical confluence detection + live market validation to improve accuracy.
🛠️ How to Use:
• Works well for reversal traders, scalpers, and swing traders seeking precise turning points.
• Best combined with VWAP, Market Profile, and Delta Volume indicators for confirmation.
• Suitable for Forex, Indices, Commodities, Crypto, and Stock markets.
🚨 Important Note:
For educational & analytical purposes only.

Candle Momentum ExhaustionCandle Momentum Exhaustion
The Candle Momentum Exhaustion indicator is designed to help traders spot potential turning points in a trend by identifying when the prevailing momentum may be “running on empty.” The indicator works by comparing the size of each candle’s body (the absolute difference between the open and close) to the average body size over a recent period. When a candle’s body exceeds a user‐defined multiple of this average, it is flagged as an “exhaustion” candle.
• A bullish exhaustion (shown with a red down–facing triangle above the bar) occurs when a very large bullish candle (close > open) is detected, suggesting that buyers may have pushed the price too far and the rally could be near its end.
• A bearish exhaustion (shown with a green up–facing triangle below the bar) occurs when a very large bearish candle (close < open) is detected, implying that selling pressure might be overdone.
These signals can alert you to a potential reversal or consolidation point. The script also includes alert conditions so that you can set up notifications whenever an exhaustion signal is generated.
How It Works
1. Average Candle Body:
The script computes a simple moving average (SMA) of the absolute candle bodies over a user-defined period (default is 14 bars).
2. Exhaustion Candidate:
A candle is flagged as an exhaustion candidate if its body size exceeds the average by more than the set multiplier (default is 2.0).
3. Signal Identification:
• If the exhaustion candle is bullish (close > open), it is marked with a red down–facing triangle above the bar.
• If it is bearish (close < open), it is marked with a green up–facing triangle below the bar.
4. Alerts:
The built-in alertcondition() calls allow you to set alerts (via TradingView’s alert system) so that you can be notified when an exhaustion event occurs.
Risk Disclaimer:
This indicator is provided for educational and informational purposes only and does not constitute financial, investment, or trading advice. Trading and investing involve significant risk, and you should not rely solely on this indicator when making any trading decisions. Past performance is not indicative of future results. Always perform your own due diligence and consult with a qualified financial advisor before making any financial decisions. The creator of this indicator shall not be held responsible for any losses incurred through its use.

Starfield Scroller█ OVERVIEW
This script creates a visually appealing starfield effect on your chart. It generates and animates multiple star fields, each customizable with its own parameters. Explore the input options to adjust the number of stars, their speed, and color.
█ CONCEPTS
The script is a simple demonstration, and utilizes a custom `starfield` function and my `geo` library for point management. It simulates a parallax effect by creating stars at random positions and moving them across the chart at varying speeds.
Star Creation
• Stars are generated with random X and Y coordinates within defined boundaries.
• Each star is assigned a random speed factor, influencing its movement speed.
• Star color is also influenced by its speed; faster stars appear more transparent.
Star Movement & Management
• The script maintains a dynamic array of Star structures. Each Star structure holds the star's creation bar index, location (as a Point ), speed factor, and the label used to display it.
• On each new bar, new stars are created and added to the array.
• Stars are moved horizontally based on their speed factor.
• Stars that move off-screen are deleted to manage resource usage.
• The maximum number of stars for each starfield instance is controlled by an input parameter.
Parallax Effect
• The varying speeds of the stars create a parallax effect, giving the illusion of depth to the starfield.
█ FEATURES
This script includes two independent starfield instances, each configurable via inputs.
Starfield 1:
• Max Stars 1: Maximum number of stars in the first starfield.
• New Stars Per Bar 1: Number of new stars created per bar for the first starfield.
• Max Star Speed 1: Maximum speed of the stars in the first starfield.
• Star Color 1: Color of the stars in the first starfield.
Starfield 2:
• Max Stars 2: Maximum number of stars in the second starfield.
• New Stars Per Bar 2: Number of new stars created per bar for the second starfield.
• Max Star Speed 2: Maximum speed of the stars in the second starfield.
• Star Color 2: Color of the stars in the second starfield.
█ HOW TO USE
1 — Add the script to your chart.
2 — Adjust the input parameters for each starfield to customize its appearance and behavior.
3 — Observe the animated starfield effect.
█ LIMITATIONS
• Excessive numbers of stars may impact performance. Adjust the maximum number of stars and new stars per bar accordingly.
• The script uses labels for rendering stars, which can have limitations on certain chart timeframes and settings.
█ NOTES
This script is intended for visual enhancement and does not provide trading signals. It demonstrates the use of custom types, arrays, and functions for creating complex visual effects in Pine Script™. The `geo` library is used for consistent point calculations.
█ THANKS
Thanks to the TradingView community for inspiration and support.

Walk Forward PatternsINTRO
In Euclidean geometry, every mathematical output has a planar projection. 'Walk Forward Patterns' can be considered a practical example of this concept. On the other hand, this indicator might also be viewed as an experiment in 'how playing with Lego as a child contributes to time series analysis' :)
OVERVIEW
This script dynamically generates the necessary optimization and testing ranges for Walk Forward Analysis based on user-defined bar count and length inputs. It performs automatic calculations for each step, offers 8 different window options depending on the inputs, and visualizes the results dynamically. I should also note that most of the window models consist of original patterns I have created.
ADDITIONAL INFO : WHAT IS WALK FORWARD ANALYSIS?
Although it is not the main focus of this indicator, providing a brief definition of Walk Forward Analysis can be helpful in correctly interpreting the results it generates. Walk Forward Analysis (WFA) is a systematic method for optimizing parameters and validating trading strategies. It involves dividing historical data into variable segments, where a strategy is first optimized on an in-sample period and then tested on an out-of-sample period. This process repeats by shifting the windows forward, ensuring that each test evaluates the strategy on unseen data, helping to assess its robustness and adaptability in real market conditions.
ORIGINALITY
There are very few studies on Walk Forward Analysis in TradingView. Even worse, there are no any open-source studies available. Someone has to start somewhere, I suppose. And in my personal opinion, determining the optimization and backtest intervals is the most challenging part of WFA. These intervals serve as a prerequisite for automated parameter optimization. I felt the need to publish this pattern module, which I use in my own WFA models, partly due to this gap on community scripts.
INDICATOR MECHANICS
To use the indicator effectively, you only need to perform four simple tasks:
Specify the total number of bars in your chart in the 'Bar Index' parameter.
Define the optimization (In-Sample Test) length.
Define the testing (Out-Of-Sample Test) length.
Finally, select the window type.
The indicator automatically models everything else (including the number of steps) based on your inputs. And the result; you now have a clear idea of which bars to use for your Walk Forward tests!
A COMMONLY USED WINDOW SELECTION METHOD: ROLLING
A more concrete definition of Walk Forward Analysis, specifically for the widely used Rolling method, can be described as follows:
Parameters that have performed well over a certain period are identified (Optimization: In-Sample).
These parameters are then tested on a shorter, subsequent period (Backtest: Out-of-Sample).
The process is repeated forward in time (At each step, the optimization and backtest periods are shifted by the backtest length).
If the cumulative percentage profit obtained from the backtest results is greater than half of the historical optimization profit, the strategy is considered "successful."
If the strategy is successful, the most recent (untested) optimization values are used for live trading.
OTHER WINDOW OPTIONS
ANCHORED: That's a pattern based on progressively expanding optimization ranges at each step. Backtest ranges move forward in a staircase-like manner.
STATIC: Optimization ranges remain fixed, while backtest ranges are shifted forward.
BLOCKED: Optimization ranges are shifted forward in groups of three blocks. Backtest ranges are also shifted in a staircase manner, even at the cost of creating gaps from the optimization end bars.
TRIANGULAR: Optimization ranges are shifted forward in triangular regions, while backtest ranges move in a staircase pattern.
RATIO: The optimization length increases by 25% of the initial step’s fixed length at each step. In other words, the length grows by 25% of the first step's length incrementally. Backtest ranges always start from the bar where the optimization ends.
FIBONACCI: A variation of the Ratio method, where the optimization shift factor is set to 0.618
RANDOM WALK
Unlike the window models explained above, we can also generate optimization and backtest ranges completely randomly—offering almost unlimited variations! When you select the "Random" option in the "Window" parameter on the indicator interface, random intervals are generated based on various trigonometric calculations. By changing the numerical value in the '🐒' parameter, you can create entirely unique patterns.
WHY THE 🐒 EMOJI?
Two reasons.
First, I think that as humanity, we are a species of tailless primates who become happy when we understand things :). At least evolutionarily. The entire history of civilization is built on the effort to express the universe in a scale we can comprehend. 'Knowledge' is an invention born from this effort, which is why we feel happiness when we 'understand'. Second, I can't think of a better metaphor for randomness than a monkey sitting at a keyboard. See: Monkey Test.
Anyway, I’m rambling :)
NOTES
The indicator generates results for up to 100 steps. As the number of steps increases, the table may extend beyond the screen—don’t forget to zoom out!
FINAL WORDS
I haven’t published a Walk Forward script yet . However, there seem to be examples that can perform parameter optimization in the true sense of the word, producing more realistic results without falling into overfitting in my library. Hopefully, I’ll have the chance to publish one in the coming weeks. Sincerely thanks to Kıvanç Özbilgiç, Robert Pardo, Kevin Davey, Ernest P. Chan for their inspiring publishments.
DISCLAIMER
That's just a script, nothing more. I hope it helps everyone. Do not forget to manage your risk. And trade as safely as possible. Best of luck!
© dg_factor

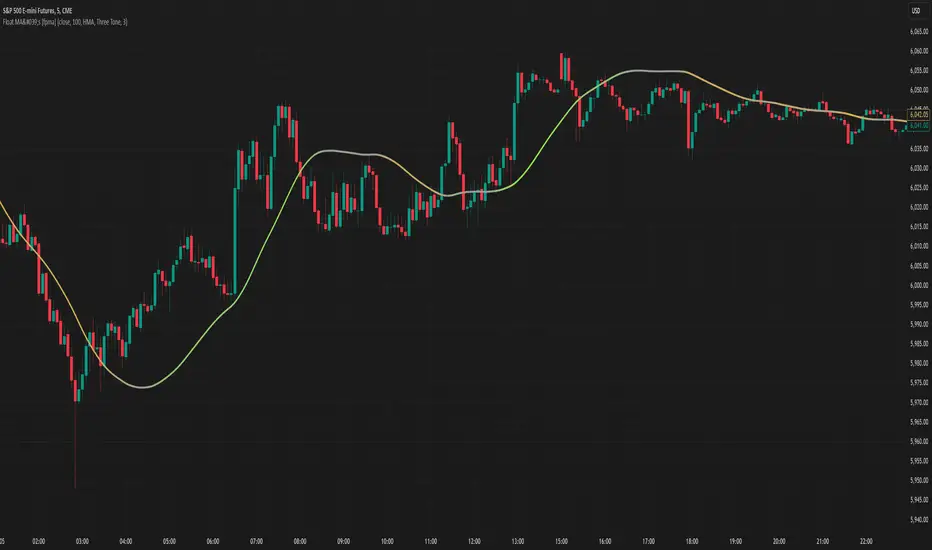
Moving Averages With Continuous Periods [macp]This script reimagines traditional moving averages by introducing floating-point period calculations, allowing for fractional lengths rather than being constrained to whole numbers. At its core, it provides SMA, WMA, and HMA variants that can work with any decimal length, which proves especially valuable when creating dynamic indicators or fine-tuning existing strategies.
The most significant improvement lies in the Hull Moving Average implementation. By properly handling floating-point mathematics throughout the calculation chain, this version reduces the overshoot tendencies that often plague integer-based HMAs. The result is a more responsive yet controlled indicator that better captures price action without excessive whipsaw.
The visual aspect incorporates a trend gradient system that can adapt to different trading styles. Rather than using fixed coloring, it offers several modes ranging from simple solid colors to more nuanced three-tone gradients that help identify trend transitions. These gradients are normalized against ATR to provide context-aware visual feedback about trend strength.
From a practical standpoint, the floating-point approach eliminates the subtle discontinuities that occur when integer-based moving averages switch periods. This makes the indicator particularly useful in systems where the MA period itself is calculated from market conditions, as it can smoothly transition between different lengths without artificial jumps.
At the heart of this implementation lies the concept of continuous weights rather than discrete summation. Traditional moving averages treat each period as a distinct unit with integer indexing. However, when we move to floating-point periods, we need to consider how fractional periods should behave. This leads us to some interesting mathematical considerations.
Consider the Weighted Moving Average kernel. The weight function is fundamentally a slope: -x + length where x represents the position in the averaging window. The normalization constant is calculated by integrating (in our discrete case, summing) this slope across the window. What makes this implementation special is how it handles the fractional component - when the length isn't a whole number, the final period gets weighted proportionally to its fractional part.
For the Hull Moving Average, the mathematics become particularly intriguing. The standard HMA formula HMA = WMA(2*WMA(price, n/2) - WMA(price, n), sqrt(n)) is preserved, but now each WMA calculation operates in continuous space. This creates a smoother cascade of weights that better preserves the original intent of the Hull design - to reduce lag while maintaining smoothness.
The Simple Moving Average's treatment of fractional periods is perhaps the most elegant. For a length like 9.7, it weights the first 9 periods fully and the 10th period at 0.7 of its value. This creates a natural transition between integer periods that traditional implementations miss entirely.
The Gradient Mathematics
The trend gradient system employs normalized angular calculations to determine color transitions. By taking the arctangent of price changes normalized by ATR, we create a bounded space between 0 and 1 that represents trend intensity. The formula (arctan(Δprice/ATR) + 90°)/180° maps trend angles to this normalized space, allowing for smooth color transitions that respect market volatility context.
This mathematical framework creates a more theoretically sound foundation for moving averages, one that better reflects the continuous nature of price movement in financial markets. The implementation recognizes that time in markets isn't truly discrete - our sampling might be, but the underlying process we're trying to measure is continuous. By allowing for fractional periods, we're creating a better approximation of this continuous reality.
This floating-point moving average implementation offers tangible benefits for traders and analysts who need precise control over their indicators. The ability to fine-tune periods and create smooth transitions makes it particularly valuable for automated systems where moving average lengths are dynamically calculated from market conditions. The Hull Moving Average calculation now accurately reflects its mathematical formula while maintaining responsiveness, making it a practical choice for both systematic and discretionary trading approaches. Whether you're building dynamic indicators, optimizing existing strategies, or simply want more precise control over your moving averages, this implementation provides the mathematical foundation to do so effectively.
[AcerX] Leverage, TP & Optimal TP CalculatorHow It Works
Inputs:
Portfolio Allocation (%): The percentage of your portfolio you're willing to risk on the trade.
Stop Loss (%): The stop loss distance below the entry price.
Taker Fee (%) and Maker Fee (%): The fees applied on entry and exit.
Calculations:
The script calculates the required "raw" leverage to risk 1% of your portfolio.
It floors the computed leverage to an integer ("effectiveLeverage").
If the computed leverage is less than 1, it shows an error message (and suggests the maximum allocation for at least 1× leverage).
Otherwise, it calculates the TP levels for target profits of 1.2%, 1.5%, and 2%, and an "Optimal TP" that nets a 1% profit after fees.
Display:
A table is drawn on the top right corner of your chart displaying the effective leverage, the TP levels, and an error message if applicable.
Simply add this script as a new indicator in TradingView, and adjust the inputs as needed.
Happy trading!

RT + TL v12This is a script to populate gamma/vanna/charm levels from option greeks heatmaps in Vexly. Heavy levels indicate levels with highest confluence. TLU and TLL are upper and lower levels. The levels are posted everyday on their discord server.
Range Trader another tool in Vexly, the levels from which can be plotted as well. Just copy the headline from range trader into "RT Range" and the modes into "RT mode"
Example:
RT Mode will take this string as input and plot the levels:
upper_mode
6049.037
mp_mode
6035.407
lower_mode
6021.776
RT Range will take this string as input and plot the levels:
6044.893 - 6017.652
Hope this helps

QoQ Economic & Financial Indicator ChangesA straightforward indicator for analyzing quarter-over-quarter (QoQ) percentage changes in economic and financial data series. Perfect for visualizing dynamic changes in:
Economic Indicators (GDP, House Price Indices, Employment Figures)
Company Financial Metrics (Revenue, EPS, Operating Margins)
Balance Sheet Items (Assets, Liabilities, Equity)
Cash Flow Statement Components
Other Quarterly Economic & Financial Data
Features:
Automatically calculates QoQ percentage changes
Color-coded visualization (green for positive, red for negative changes)
Displays exact percentage values
Includes adjustable scale factor for different data series
Zero line reference for easy trend identification

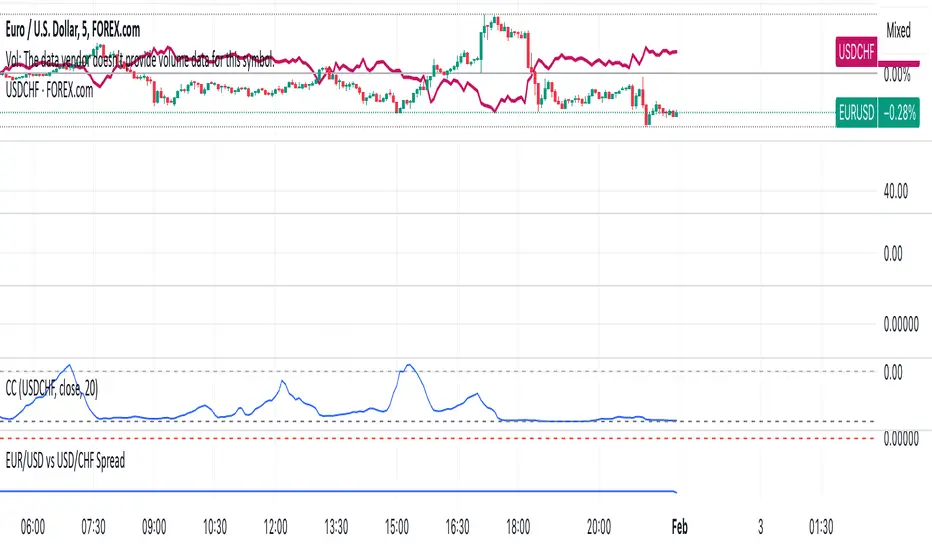
EUR/USD vs USD/CHF SpreadA typical Pine Script for spread trading would include:
Fetching Data: Getting the real-time price of EUR/USD and USD/CHF.
Calculating the Synthetic EUR/CHF Price: Since EUR/USD * USD/CHF ≈ EUR/CHF, we use this relation to analyze deviations.
Computing the Spread: Taking the difference between EUR/USD and the synthetic EUR/CHF price.
Z-Score Normalization: Measuring how far the spread deviates from the mean (Mean Reversion).
Overlay and Visuals: Plotting the spread and key levels to visualize trading signals.
TOTAL3/BTC This Pine Script™ code, named "TOTAL3/BTC with Arrow," is designed for cryptocurrency analysis on TradingView.
This script essentially provides a visual tool for traders to gauge when altcoins might be gaining or losing ground relative to Bitcoin through moving average analysis and color-coded trend indication.
Intention was to help the community with a script based on classic TA only.
Use it with SASDv2r indicator.
Feel free to make it better. If you did so, please let me know.
Main elements:
Data Fetching: It retrieves market cap data for all cryptocurrencies excluding Bitcoin and Ethereum (TOTAL3) and for Bitcoin (BTC).
Ratio Calculation: The script calculates the ratio of TOTAL3 to BTC market caps, which indicates how altcoins (excluding ETH) are performing relative to Bitcoin.
Plotting the Ratio: This ratio is plotted on the chart with a blue line, allowing traders to see the relative performance visually.
Moving Averages: Two Simple Moving Averages (SMA) are calculated for this ratio, one for 20 periods (ma20) and another for 50 periods (ma50), though these are not plotted in the current version of the code.
Reference Lines: Horizontal lines are added at ratios of 0.3 and 0.8 to serve as visual equilibrium points or thresholds for analysis.
Complex Moving Average: The script uses constants (len, len2, cc, smoothe) from another script, suggesting it's adapting or simplifying another's logic for multi-timeframe analysis.
Average Calculation: Two SMAs (avg and avg2) are computed using the constants defined, focusing on different lengths for trend analysis.
Direction Determination: It checks if the moving average is trending up or down by comparing the current value with its value smoothe bars earlier.
Color Coding: The color of the plotted moving average changes based on its direction (lime for up, red for down, aqua if no clear direction), aiding in quick visual interpretation of trends.
Plotting: Finally, the script plots this multi-timeframe moving average with a dynamic color to reflect the current market trend of the TOTAL3/BTC ratio, with a thicker line for visibility.

SASDv2rSensitive Altcoin Season Detector V2
This Pine Script™ code, titled "SASDv2r" (Sensitive Altcoin Season Detector version 2 revised), is designed for cryptocurrency trading analysis on the TradingView platform and tailored for those interested in tracking when altcoins might be outperforming Bitcoin, potentially indicating a market shift towards altcoins.
Feel free to use and modify. If you made it better, please let me know. Intention was to help the community with a tool for retail traders have no access to advanced, MV indicators. Solution uses classic TA only.
Use it witl TOTAL3/BTC indicator.
Please check: it gave signal just before last alt season % rose more than 250%.
Market Cap Data Fetching: The script fetches market capitalization data for Bitcoin, Ethereum, and all other altcoins (excluding Bitcoin and Ethereum) using request.security function.
Altcoin to Bitcoin Ratio: It calculates the ratio of total market cap of altcoins to Bitcoin's market cap (altToBtcRatio), which is central to identifying an "altcoin season."
Moving Averages: Several moving averages are computed for different time frames (50-day SMA, 200-day SMA, 20-day SMA, and 10-day EMA) to analyze trends in the altcoin to Bitcoin ratio.
Momentum Indicators: The script uses RSI (Relative Strength Index) and MACD (Moving Average Convergence Divergence) to gauge momentum and potential reversal points in the market.
Custom Indicators: It includes Volume Weighted Moving Average (VWMA) and a custom momentum indicator (altMomentum and altMomentumAvg) to provide additional insights into market movements.
Volatility Measurement: Bollinger Bands are calculated to assess volatility in the altcoin to Bitcoin ratio, which helps identify periods of high or low market activity.
Visual Analysis: Various plots are added to the chart for visual interpretation, including the altcoin to Bitcoin ratio, different moving averages, and Bollinger Bands.
Alt Season Detection: The script defines conditions for detecting when an "altcoin season" might be starting, based on crossovers of moving averages, RSI levels, MACD signals, and other custom criteria.
Performance Tracking: After signaling an alt season, the script evaluates the performance over the next 30 days by checking if there's been an increase in the altcoin to Bitcoin ratio, adding labels for positive or negative trends.(this one is in progress). Logic still gives false signals and aim is to identify failed signals.
Visual Signals: Labels are placed on the chart to visually indicate the beginning of a potential alt season or the performance outcome after a signal, aiding traders in making informed decisions.

IBOX For the indicator to appear correctly on the DE40's 5-minute char t, set it to overlay mode.
Variables: Variables are declared to store the high and low points of the first trading hour.
Draw box:
The box representing the range of the first trading hour is drawn in gray.
First trading hour range:
The code checks if it is the first trading hour (9-10 am). If so, the high and low points are stored.
Fibonacci calculation: Based on the range of the first trading hour, the Fibonacci levels 1,61, 2, 2,61, 4,61 above and below the box are calculated.
