Session Gap Fill [LuxAlgo]The Session Gap Fill tool detects and highlights filled and unfilled price gaps between regular sessions. It features a dashboard with key statistics about the detected gaps.
The tool is highly customizable, allowing users to filter by different types of gaps and customize how they are displayed on the chart.
🔶 USAGE
By default, the tool detects all price gaps between sessions. A price gap is defined as a difference between the opening price of one session and the closing price of the previous session. In this case, the tool uses the opening price of the first bar of the session against the closing price of the previous bar.
A bullish gap is detected when the session open price is higher than the last close, and a bearish gap is detected when the session open price is lower than the last close.
Gaps represent a change in market sentiment, a difference in what market participants think between the close of one trading session and the open of the next.
What is useful to traders is not the gap itself, but how the market reacts to it.
Unfilled gaps occur when prices do not return to the previous session's closing price.
Filled gaps occur when prices come back to the previous session's close price.
By analyzing how markets react to gaps, traders can understand market sentiment, whether different prices are accepted or rejected, and take advantage of this information to position themselves in favor of bullish or bearish market sentiment.
Next, we will cover the Gap Type Filter and Statistics Dashboard.
🔹 Gap Type Filter
Traders can choose from three options: display all gaps, display only overlapping gaps, or display only non-overlapping gaps. All gaps are displayed by default.
An overlapping gap is defined when the first bar of the session has any price in common with the previous bar. No overlapping gap is defined when the two bars do not share any price levels.
As we will see in the next section, there are clear differences in market behavior around these types of gaps.
🔹 Statistics Dashboard
The Statistics Dashboard displays key metrics that help traders understand market behavior around each type of gap.
Gaps: The percentage of bullish and bearish gaps.
Filled: The percentage of filled bullish and bearish gaps.
Reversed: The percentage of filled gaps that move in favor of the gap
Bars Avg.: The average number of bars for a gap to be filled.
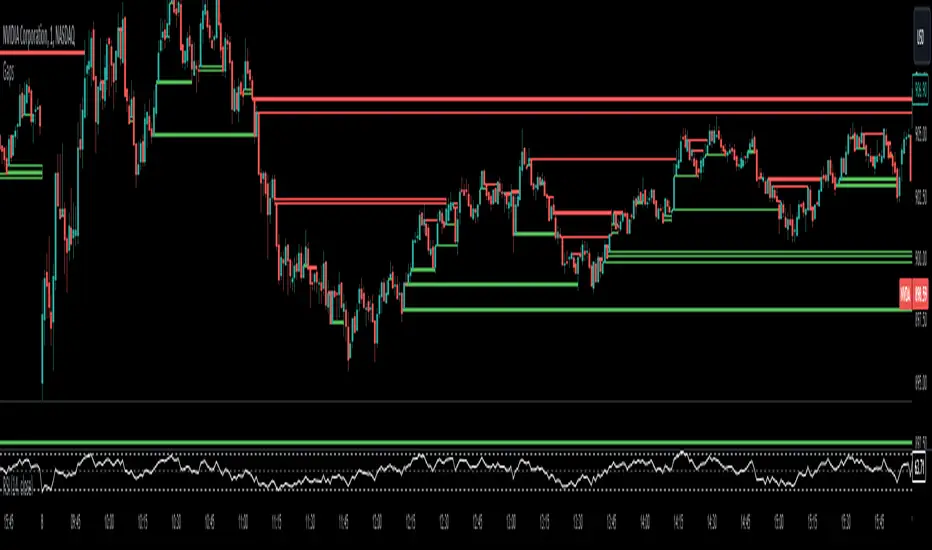
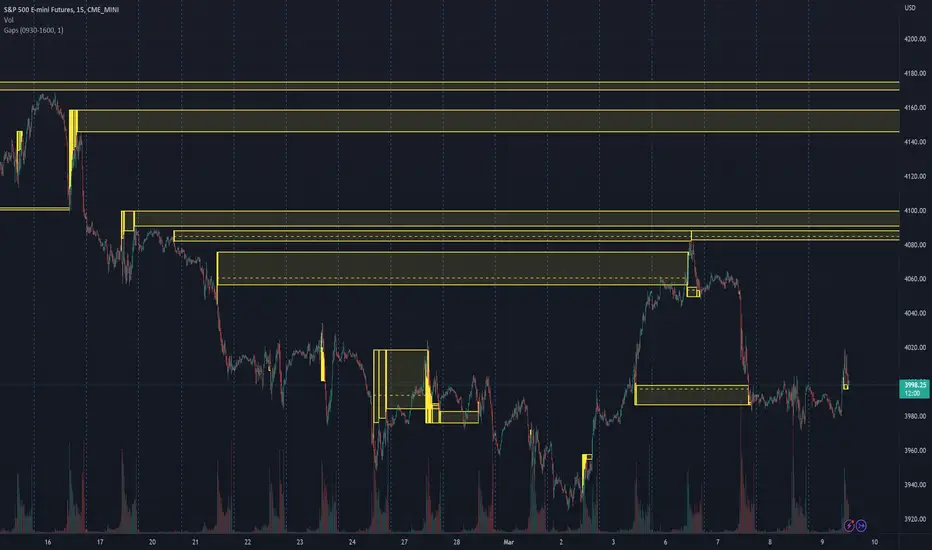
Now, let's analyze the chart on the left of the image to understand those stats. These are the stats for all gaps, both overlapping and non-overlapping.
Of the total, bullish gaps represent 55%, and bearish ones represent 44%. The gap bias is pretty balanced in this market.
The second statistic, Filled, shows that 63% of gaps are filled, both bullish and bearish. Therefore, there is a higher probability that a gap will be filled than not.
The third statistic is reversed. This is the percentage of filled gaps where prices move in favor of the gap. This applies to filled bullish gaps when the close of the session is above the open, and to filled bearish gaps when the close of the session is below the open. In other words, first there is a gap, then it fills, and finally it reverses. As we can see in the chart, this only happens 35% of the time for bullish gaps and 29% of the time for bearish gaps.
The last statistic is Bars Avg., which is the average number of bars for a gap to be filled. On average, it takes between one and two bars for both bullish and bearish gaps. On average, gaps fill quickly.
As we can see on the chart, selecting different types of gaps yields different statistics and market behavior. For example, overlapping gaps have a greater than 90% chance of being filled, whereas non-overlapping gaps have a less than 40% chance.
🔶 SETTINGS
Gap Type: Select the type of gap to display.
🔹 Dashboard
Dashboard: Enable or disable the dashboard.
Position: Select the location of the dashboard.
Size: Select the dashboard size.
🔹 Style
Filled Bullish Gap: Enable or disable this gap and choose the color.
Filled Bearish Gap: Enable or disable this gap and choose the color.
Unfilled Gap: Enable or disable this gap and choose the color.
Max Deviation Level: Enable or disable this level and choose the color.
Open Price Level: Enable or disable this level and choose the color.
Gapfill

Auto Gap DetectorThis indicator uses previous sessions open/close (whichever is closest) and the new sessions open to automatically detect both a gap up or gap down on any timeframe but is intended for use on on the daily timeframe ONLY. This is not the traditional definition of a gap but the one that i use for my strategy and has been more consistent and conservative than others.
We have also provided instructions on how to create alerts for these indicators below.
Happy Trading!
White Boxes: indicate an overnight gap up/down that is incomplete or not filled.
Green Boxes: When a gap fill is complete the white box will be changed to a green box so that it may still be used as a reference for support and resistance on following sessions.
*Color, transparency and borders of boxes can be customized in settings.
Set Up Alerts
Now, let’s make sure you get notified when a gap has occurred and when it has been filled happens:
Open the Alerts Menu
On the chart, click the bell icon (top right of the screen) to create an alert.
Configure the Auto Gap indicator
In the “Condition” dropdown, select “Auto Gap indicator".
Below that, select “Overnight Gap Detected or Overnight Gap Filled.”
*Note: if you want to detect when both a gap has been detected and when it has been filled you must create two separate alerts.
Set “Once Per Bar Close” in the next dropdown (this ensures it only triggers after the period ends, avoiding false signals mid-bar).
Choose how you want to be notified (e.g., popup, email, or phone app—set this under “Notifications”).
Configure the Auto Gap Alert
Click the bell icon again to create a second alert.
Feel free to leave comments requesting any upgrades or potential bugs. Thank you!

Gap Detector [MS]This indicator helps traders identify and visualize price gaps in market data. When price movements create gaps between trading sessions or periods, the script highlights these areas with colored clouds and markers.
Key Features:
Automatically detects price gaps based on a customizable gap percentage threshold
Visualizes gaps using color-coded clouds (green when price moves upward, red for downward price action)
Places small triangle markers at gap locations for easy identification of gaps, and if many happen close together
Shows gray clouds when price is within the last gap
Use it For:
Watching for gap-fills
Gap support/resistance levels
Trading gap breakouts
...and more
How it Works:
The script compares each bar's opening price with the previous bar's closing price. A gap is identified when the opening price is significantly different from the previous close (beyond the user-defined gap percentage). The gap area is then marked with a colored cloud:
Green clouds: Show gaps where price jumped higher
Red clouds: Show gaps where price dropped lower
Gray clouds: Indicate price action within the gap
Settings:
Gap %: Controls the minimum price difference required to identify a gap (default 0.01 or 1%)
This indicator can help traders:
Identify potential support/resistance levels at gap areas
Monitor gap-filling scenarios
Spot significant price movements between trading sessions
The script is designed to work across all timeframes and markets.

Gap Finder Pro (incl. Island Gaps)Hello Traders!
Unlock the power of gap trading with Gap Finder Pro , a comprehensive tool designed to identify, analyze, and visualize price gaps in any market. This advanced indicator goes beyond simple gap detection, offering you a wealth of features to enhance your gap trading strategies.
Key Features
Precise gap detection for both up and down gaps
Island gap identification and analysis
Detailed statistics for data-driven decision making
Customizable visual elements for clear chart analysis
Flexible settings to adapt to various trading styles and timeframes (works on daily and intraday charts)
Understanding and Trading Gaps
Price gaps occur when an asset opens at a different price than its previous close, creating a blank space on the chart. Gaps can signal significant market sentiment shifts and often present lucrative trading opportunities. Gap Finder Pro helps you capitalize on these opportunities
Island Gaps: A Powerful Trading Signal
Island gaps, a rare but potent chart pattern, occur when a gap is followed by a period of price consolidation and then another gap in the opposite direction. The indicator automatically detects and highlights these formations, allowing you to spot potential trend reversals or continuation patterns quickly.
Comprehensive Statistics
Make data-driven decisions with the built-in statistics panel. Analyze:
Total number of gaps (up and down)
Average and median gap sizes
Gap fill rates and average time to fill
Percentage of gaps filled within specific timeframes
Breakdown of gap types (standard vs. island)
These statistics empower you to understand market behavior better and refine your gap trading strategies over time.
Trading Strategies
Island Gap Reversals: Capitalize on the powerful reversal signals provided by island gaps.
Breakout Trading: Look for gaps in a V-formation as potential signs of strong trend continuation.
Gap Fill Trading: Use the indicator to identify unfilled gaps and set targets for potential mean reversion trades.
(For example, enter short for a up gap fill if a down candle closes below the previous candle's low.)
Statistical Edge: Leverage the comprehensive statistics to develop gap-based trading systems.
Whether you're a seasoned gap trader or looking to incorporate gap analysis into your trading strategy, Gap Finder Pro provides the tools and insights you need to make informed decisions in any market condition. Elevate your trading with this powerful, all-encompassing gap analysis indicator.

SPX Mapped Gaps [Mxwll]Hello traders 👋
This indicator "SPX Mapped Gaps" detects gaps from the SPX (or the trader's choice of index/asset) and plots them for the asset on your chart!
Features
Selectable comparison symbol
Gaps from the selected symbol (SPX by default) are plotted for the asset on your chart - serving as potential support/resistance levels!
Closest gaps from comparison symbol displayed in upper-right table
Overlapped gaps deleted automatically - less clutter!
How this script works
The "SPX Mapped Gaps" is designed to help traders determine price levels for the asset on their chart where a major index (any asset) gapped up or down.
Of course, a gap that occurs on SPX (4-digit price) is incompatible with the price chart of BTC (5-digit price). To circumvent this, the percentage distance of the gap from SPX is determined, and a gap level is drawn equidistantly (up/down) from the open price of the asset on your chart. With this method, the proportion of the gap is maintained at the price area it occurred for the asset on your chart!
The image above outlines functionality for the indicator!
Key points:
Up gaps are denoted by green boxes
Down gaps are denoted by red boxes
All gaps are listed with their start and end price for the comparison asset (SPX for the example). These labels can be hidden at the user's discretion.
Gaps are expected to act as support/resistance during their lifetime
The image above explains the output of the script, including line style indications!
Solid lines indicate that the leverage used for at your entry price constitutes an active trade. Dotted lines mean the trade has already achieved your profit target for that leverage, or stopped out.
The image above explains the table attached to the indicator!
This table displays the closest gaps to the current asset price. The status (up gap or down gap) from the gap to the current price is also detailed.
Why are gaps on the SPX, or major index, relevant to BTC and other assets?
When a gap on the major indices occurs, it's expected that strong aggregate buying or selling pressure will transpire for BTC and other coins. Due to this, the presence of a gap on a major index might correspond to increased activity on smaller market-cap assets with some degree of positive correlation to the index. Consequently, the price level for the asset at which a gap for the major index occurred may function as support/resistance for future price!
That is all for this - thanks traders!

Fair Value Gap (FVG) Oscillator [UAlgo]The "Fair Value Gap (FVG) Oscillator " is designed to identify and visualize Fair Value Gaps (FVG) within a given lookback period on a trading chart. This indicator helps traders by highlighting areas where price gaps may signify potential trading opportunities, specifically bullish and bearish patterns. By leveraging volume and Average True Range (ATR) data, the FVG Oscillator aims to enhance the accuracy of pattern recognition and provide more reliable signals for trading decisions.
🔶 Identification of Fair Value Gap (FVG)
Fair Value Gaps (FVG) are specific price areas where gaps occur, and they are often considered significant in technical analysis. These gaps can indicate potential future price movements as the market may return to fill these gaps. This indicator identifies two types of FVGs:
Bullish FVG: Occurs when the current low price is higher than the high price two periods ago. This condition suggests a potential upward price movement.
Obtains with:
low > high
Bearish FVG: Occurs when the current high price is lower than the low price two periods ago. This condition suggests a potential downward price movement.
Obtains with:
high < low
The FVG Oscillator not only identifies these gaps but also verifies them using volume and ATR conditions to ensure more reliable trading signals.
🔶 Key Features
Lookback Period: Users can set the lookback period to determine how far back the indicator should search for FVG patterns.
ATR Multiplier: The ATR Multiplier is used to adjust the sensitivity of the ATR-based conditions for verifying FVG patterns.
Volume SMA Period: This setting determines the period for the Simple Moving Average (SMA) of the volume, which helps in identifying high volume conditions.
Why ATR and Volume are Used?
ATR (Average True Range) and volume are integrated into the Fair Value Gap (FVG) Oscillator to enhance the accuracy and reliability of the identified patterns. ATR measures market volatility, helping to filter out insignificant price gaps and focus on impactful ones, ensuring that the signals are relevant and strong. Volume, on the other hand, confirms the strength of price movements. High volume often indicates the sustainability of these movements, reducing the likelihood of false signals. Together, ATR and volume ensure that the detected FVGs are both significant and supported by market activity, providing more trustworthy trading signals.
Normalized Values: The FVG counts are normalized to enhance the visual representation and interpretation of the patterns on the chart.
Visual Customization and Plotting: Users can customize the colors for positive (bullish) and negative (bearish) areas, and choose whether to display these areas on the chart, also plots the bullish and bearish FVG counts, a zero line, and the net value of FVG counts. Additionally, it uses histograms to display the width of verified bullish and bearish patterns.
🔶 Disclaimer:
Use with Caution: This indicator is provided for educational and informational purposes only and should not be considered as financial advice. Users should exercise caution and perform their own analysis before making trading decisions based on the indicator's signals.
Not Financial Advice: The information provided by this indicator does not constitute financial advice, and the creator (UAlgo) shall not be held responsible for any trading losses incurred as a result of using this indicator.
Backtesting Recommended: Traders are encouraged to backtest the indicator thoroughly on historical data before using it in live trading to assess its performance and suitability for their trading strategies.
Risk Management: Trading involves inherent risks, and users should implement proper risk management strategies, including but not limited to stop-loss orders and position sizing, to mitigate potential losses.
No Guarantees: The accuracy and reliability of the indicator's signals cannot be guaranteed, as they are based on historical price data and past performance may not be indicative of future results.

LumleyTrading GapsName: LumleyTrading Gaps
Description:
The Gap Tracker Indicator is a powerful tool designed for traders to identify, monitor, and capitalize on price gaps in financial markets. It serves two primary functions:
Identifying Gaps: The indicator scans price action to detect instances where the current trading session's opening price significantly differs from the previous session's closing price. These disparities indicate the presence of price gaps.
Tracking Gap Fills: Once a gap is identified, the indicator continues to monitor the price movement. It dynamically adjusts its parameters to track whether and when the price retraces back to fill the gap. As soon as the gap is filled, the indicator generates a signal to notify traders of this occurrence.
Key Features:
Customizable Parameters: Traders can adjust the sensitivity and criteria for what constitutes a significant gap based on their trading preferences and the market conditions.
Visual Alerts: The indicator provides clear visual signals on price charts, highlighting the presence of gaps and indicating when they are filled. This helps traders to easily spot trading opportunities and make informed decisions.
Alert Notifications: In addition to visual cues, traders can opt to receive real-time alerts via email, SMS, or within their trading platform, ensuring they never miss an opportunity or a filled gap.
Historical Analysis: The indicator may also offer historical gap data, allowing traders to conduct backtesting and analyze the performance of trading strategies based on gap patterns.
Benefits:
Gap Trading Opportunities: Traders can use the indicator to identify potential areas of price continuation or reversal, leveraging the phenomenon of gap trading for profit.
Risk Management: By tracking gap fills, traders can manage their risk more effectively, knowing when a gap is likely to act as support or resistance and adjusting their positions accordingly.
Enhanced Decision Making: With real-time gap detection and fill tracking, traders gain valuable insights into market sentiment and price dynamics, empowering them to make timely and informed trading decisions.
Compatibility:
The Gap Tracker Indicator is compatible with popular trading platforms and can be seamlessly integrated into various technical analysis tools and strategies.
Conclusion:
In the fast-paced world of financial markets, identifying and understanding price gaps is crucial for successful trading. The Gap Tracker Indicator provides traders with a reliable tool to spot, track, and capitalize on gap opportunities, enhancing their trading efficiency and profitability.
Gap Removal IndicatorThis gap indicator shows the price of your chosen instrument as if no gaps had occurred overnight. It can be especially useful on highly-volatile exchange-listed instruments that track other 24/7 assets, because the normal candlestick chart of these instruments will create a large amount of noise that may decrease the accuracy of your indicators or make the trend harder to see.
Gaps are determined with the following code:
daychange = ta.change(dayofmonth)
gapup = daychange and open > math.max(open,close)
gapdown = daychange and open < math.min(open,close)
Whereas the gap value is determined by taking the overnight difference in prices:
downgap_change = math.min(open,close) - open
upgap_change = open - math.max(open,close)
The gap changes are cumulatively added and subtracted from the initial closing price to create the gap-adjusted price. The price will depend on how many bars your subscription allows, so pay more attention to the relative differences and/or trend than the cumulative gap-adjusted price itself.
The gap indicator comes pre-built with normal candlestick and Heikin-Ashi candle types, and four indicators (two EMAs, Bollinger bands, and a supertrend). All elements are configurable.

Gap Statistics (Zeiierman)█ Overview
The Gap Statistics (Zeiierman) indicator is crafted to monitor, analyze, and visually present price gaps on a trading chart. Price gaps are areas on a chart where the price jumps up or down from the previous close to the next open, creating a "gap" in the normal price pattern. This script delivers an extensive range of statistics related to these gaps, encompassing their size, direction (whether bullish or bearish), frequency of getting filled, as well as the average number of bars it takes for a gap to be filled. The indicator also visually represents the gaps, making it easier for traders to spot and analyze them.
█ How It Works
Gap Identification: The script identifies gaps by comparing the open price of a bar to the close price of the previous bar. If there is a discrepancy between the two, it is recognized as a gap.
Gap Classification: Once a gap is identified, it is classified based on its size (as a percentage of the previous close price) and direction (bullish or bearish). The gap is then added to a specific category based on its size.
Gap Tracking: The script keeps track of all identified gaps using arrays and user-defined types, storing details like their size, direction, and whether they have been filled.
Gap Filling: The script continuously monitors the price to check if any previously identified gaps get filled. A gap is considered filled if the price moves back into the gap area.
Statistics and Alerts: The script calculates various statistics like the total number of gaps, the number of filled gaps, the average number of bars it takes for a gap to fill, and the percentage of gaps that get filled. It also generates alerts when a new gap is identified or an existing gap gets filled.
█ How to Use
Gaps are often classified into four main types:
Common Gaps: These are not associated with any major news and are likely to get filled quickly.
Breakaway Gaps: These occur at the end of a price pattern and signal the beginning of a new trend.
Runaway Gaps: Also known as continuation gaps, these occur in the middle of a trend and signal a surge in interest in the stock.
Exhaustion Gaps: These occur near the end of a price pattern and signal a final attempt to hit new highs or lows.
The Gap Statistics (Zeiierman) indicator enhances a trader's ability to use gaps in their trading strategy in several ways:
Statistical Analysis: Traders get comprehensive statistics on gaps, such as their size, direction, and how often they get filled.
Performance Tracking: The indicator tracks how many bars it typically takes for a gap to fill, providing traders with an average timeframe for gap closure.
█ Settings
Display Gaps: Choose to display "All Gaps," "Active Gaps," or "None."
Show Gap Size: Toggle on/off the display of the gap size.
-----------------
Disclaimer
The information contained in my Scripts/Indicators/Ideas/Algos/Systems does not constitute financial advice or a solicitation to buy or sell any securities of any type. I will not accept liability for any loss or damage, including without limitation any loss of profit, which may arise directly or indirectly from the use of or reliance on such information.
All investments involve risk, and the past performance of a security, industry, sector, market, financial product, trading strategy, backtest, or individual's trading does not guarantee future results or returns. Investors are fully responsible for any investment decisions they make. Such decisions should be based solely on an evaluation of their financial circumstances, investment objectives, risk tolerance, and liquidity needs.
My Scripts/Indicators/Ideas/Algos/Systems are only for educational purposes!

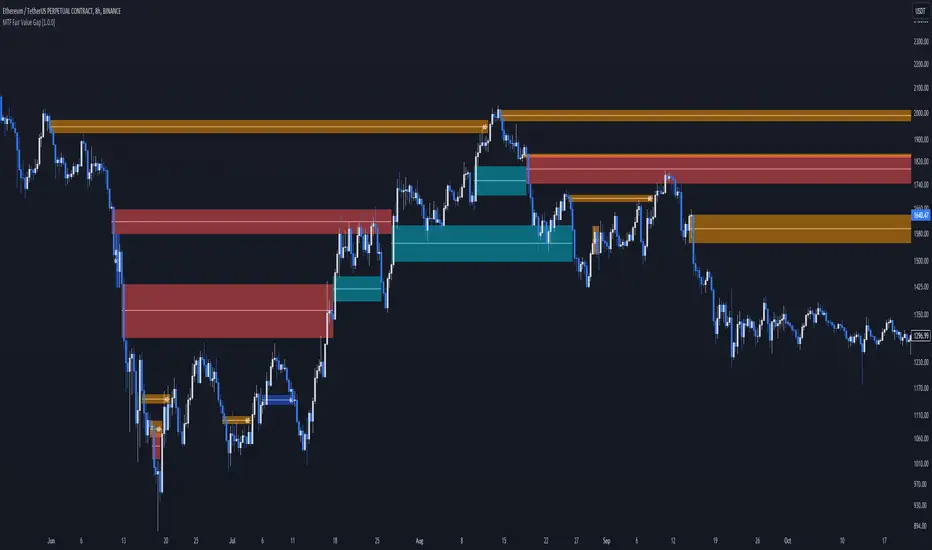
MTF Fair Value Gap [BigBeluga]The MTF Fair Value Gap (FVG) indicator provides multi-timeframe options to observe lower or higher gaps in different timeframes within your current one. This can enhance the confluence in your trading decisions.
🔶 USAGE
An FVG is formed when a candle has an 'empty' body, leaving a gap. These areas are often filled before the market continues to trend in its original direction.
In practical terms, FVGs serve to highlight support areas (bullish FVGs) and resistance zones (bearish FVGs). As a gap is filled, signaling the end of the existing imbalance, it tends to foreshadow an impending price reversal.
While this approach is inherently contrarian, individuals seeking a more trend-following strategy can opt to use FVG identification as straightforward signals. This entails taking a long position upon detecting a bullish FVG and adopting a short position in the presence of a bearish FVG.
🔹 Mitigation
The mitigation point is where the user selects when the FVG is considered filled or no longer usable.
Source => Choose the candle's low/high or close as the mitigation point.
Point => Choose the FVG's mitigation point to trigger after the candle's Source has filled it. Users can choose between the middle point or the top/bottom of the FVG.
ccc
🔹 MTF
This script can display MTF FVGs from different timeframes while showing the current one. This is extremely useful as it avoids the need to switch timeframes frequently and can add significant confluence with the current FVG.
🔹 Threshold
The Threshold is an input to remove insignificant FVGs that are too small to be truly useful. Users can choose between:
Auto => Automatically remove unusable FVGs.
Manual => Set an automatic Threshold.
🔶 TIPS
Users can choose how many FVGs to display on the current chart for better visualization.
Users can choose which FVGs to display: only the current one, only MTF ones, or both.
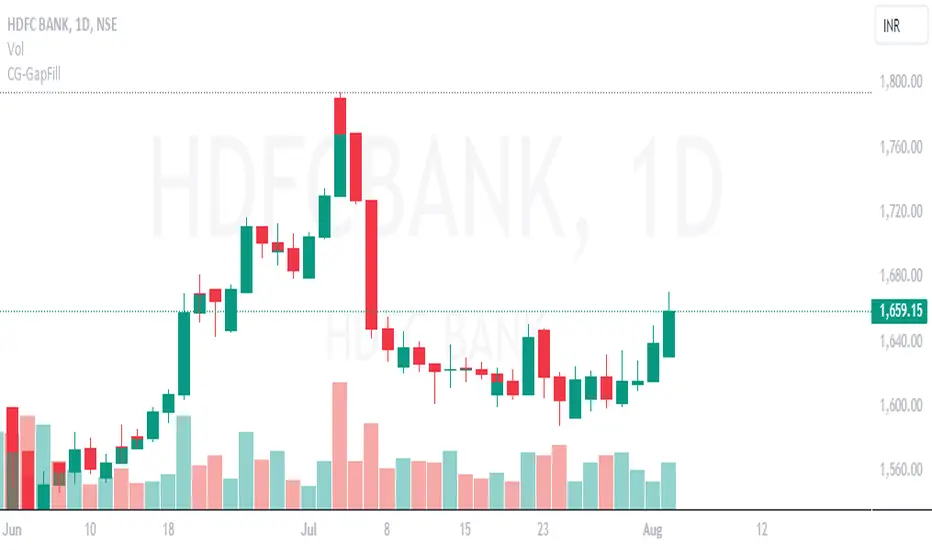
CG Gap Filling Invisible CandleThis script is used to Fill the GAP between two candles close price and next candle close price if there is GAP in the OPENING price of new candle.
This helps in identifying whether the GAP Candle is LEG candle (Big candles) or BASE candle (small accumulation candles) that can be used in marking the Demand and Supply zones based on LEG-IN, BASE and LEG-OUT candles.
LEG candles are formed by Imbalance between Buy Price (buyers) and Sell Price (sellers), that will lead to Demand and Supplies zones. This shows the aggression of institution in either BUY or SELL at certain price range.
Importance will be given to LEG-OUT candle.
If you see BIG Green LEG-OUT Candle, institutions are aggressive in BUYING (Bullish).
If it is RED LEG-OUT Candle, institutions are aggressive in SELLING (Bearish)
Bullish scenario:
LEG IN -- BASE -- LEG OUT
----------------------------------
Rally -- Base -- Rally
Drop -- Base -- Rally
Bearish scenario:
LEG IN -- BASE -- LEG OUT
----------------------------------
Drop -- Base -- Drop
Rally -- Base -- Drop
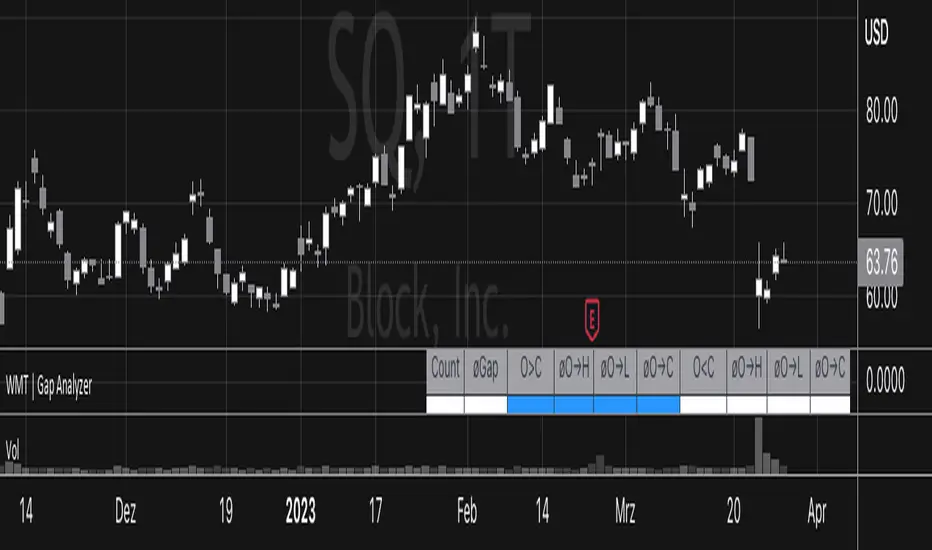
Gap Analyzer [WMT] - Data for Gap Up and Gap DownGet data for gaps with Gap Analyzer
Change the gap mode in settings to switch between a Gap Up (default) or Gap Down
Change the threshold for the minimum (Gap Up) and maximum (Gap Down) gap
Change Data Years -> Years of the look back period to calculate the stats
Retrieve valuable information for past statistics on how the instrument behaved with the given gap
Definitions for Gap Up
Price can fade lower from the open or (Gap Up Fade)
Price can continue higher from the open (Gap Up Continuation)
Definitions for Gap Down
Price can continue lower from the open or (Gap Down Continuation)
Price can bounce higher from the open (Gap Down Bounce)
For each of those, we get:
"øO→H": average percentage movement from open to high of the day
"øO→L": average percentage movement from open to low of the day
"øO→C": Average percentage movement from open to close of the day
Daily Opening GAPPlots the daily opening gap as a box. As price moves into the box the size of the box is reduced until the gap is closed and the box no longer extends forward.
There are options to include middle lines for the center of the gap, as well as quartile lines.
While there are plenty of opening gap scripts out there none that I found tracked the closing of the gap over time.
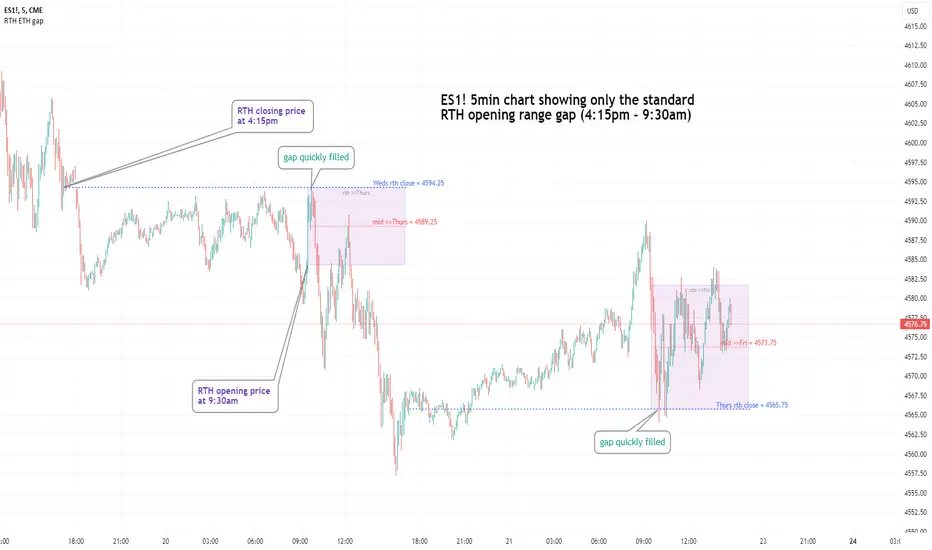
Regular vs Electronic Trading hours Gap (RTH vs ETH); 4pm-9:30am-Shows the gap between 4pm close and 9:30am open; the Regular trading hours Vs Electronic trading hours Gap (RTH vs ETH).
-Displays this as a box starting at 9:30am, whose bottom is the 9:30am open; top is previous day's 4pm close.
-Displays when chart is toggled to either of ETH or RTH.
-Useful reminder of area above/below opening bell price that price often has a tendency to want to fill in, partially or fully
--(all times here refer to America/New_York timezone)
//Options:
~Number of past boxes to show
~Extend boxes fully to the right
~Box background color, border color, and opacities
//Limitations:
-works only on timeframes 30mins or lower (works on 1,2,5,10,15,30minutes)
-will not work on non-typical low timeframes (like 4min or 7min) since they are not divisible into 30
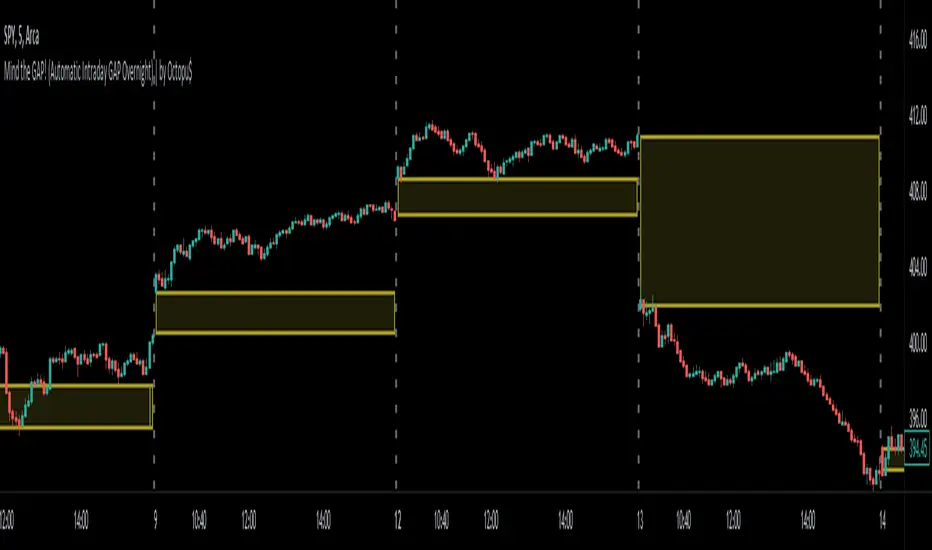
Mind the GAP! (Automatic Intraday GAP Overnight) | by Octopu$🤏 Mind the GAP! (Automatic Intraday GAP Overnight) | by Octopu$
Gaps are areas on a chart where the price of a stock moves sharply up or down, with little or no trading in between.
When it happens overnight (not considering Extended Hours), it is just considered as Price Level, for possible revisit.
A Gap is defined when the Open current Candle is Higher or Lower than the Close of the Last Candle:
When the Open of the current Candle is Higher than the Close of the Last Candle it is considered a Gap UP;
When the Open of the current Candle is Lower than the Close of the Last Candle it is considered a Gap DOWN;
Something interesting about Gap is that:
1. The Price Action can travel fast between these levels (Volatility);
2. One (or both) of these levels (Hi/Lo) can act as Support (or Breakout);
3. One (or both) of these levels (Hi/Lo) can act as Resistance (or Breakout).
This Indicator includes these Gaps added Automatically to your Chart.
It is also built-in with a Shadow between the lines for easy visualization.
Colors are also customizable and the Lines are also editable according t your preferences.
Any Time Frame. Any Ticker.
(Using SPY 5m just as an example:)
www.tradingview.com
AMEX:SPY
Features:
• Identifies Gaps on MC/MO
• Automatically adds Lines to these levels
• Includes shadow for easy visualization
Options:
• Customizable: Colors and Lines
• On/Off Switches for the Levels
• Show/Hide Previous Days
Notes:
v1.0
Indicator release
Changes and updates can come in the future for additional functionalities or per requests.
Did you like it? Boost it. Shoot a message! I'd appreciate if you dropped by to say thanks.
- Octopu$
🐙
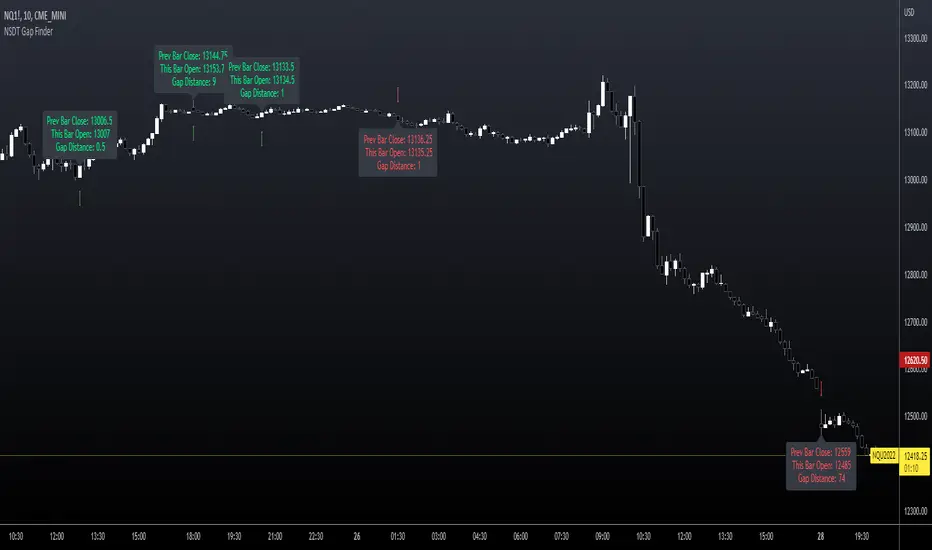
NSDT Gap FinderThis script plots gaps between candles.
It uses the "round_to_mintick" feature in the Pinescript code, so it works on any instrument out to 3 decimal places.
If there is a Gap Up (open of current candle is greater than the close of previous candle) it will plot a green arrow under the current candle and plot a label above the current candle to show the Gap Amount.
If there is a Gap Down (open of current candle is less than the close of previous candle) it will plot a red arrow over the current candle and plot a label below the current candle to show the Gap Amount.
You can turn the label and/or the arrow on and off.
I created this indicator to more easily identify gaps in the market. The probability of a gap being filled is extremely high. Some are right away (intraday candle to candle), some take a while (gap from previous day close to current day open), and some make take a long time (close at end of previous week to open at beginning of current week).
This is published free to use and open source code.
Please see my other similar Gap Indicators.
Daily Gap Range
USA Session - Previous Day Close Gap to Current Day Open
ICT FVG indicator [Focused Trader]This is simple fair value gap indicator. It draws FVG (fair value gaps) as boxes. If FVG is partially filled, it is also displayed and smaller size FVG is drawn. If FVG is filled totally, it is deleted from chart. There is limitation of 500 drawing objects for indicators on Tradingview, so keep in mind that this indicator will display only last 500 FVGs.
For simplicity, there is only one setting, which is coloring of FVGs. It is perhaps a good idea to lower your opacity (to about 10%) and choose color of FVG according to your preferences and current theme (dark or white).

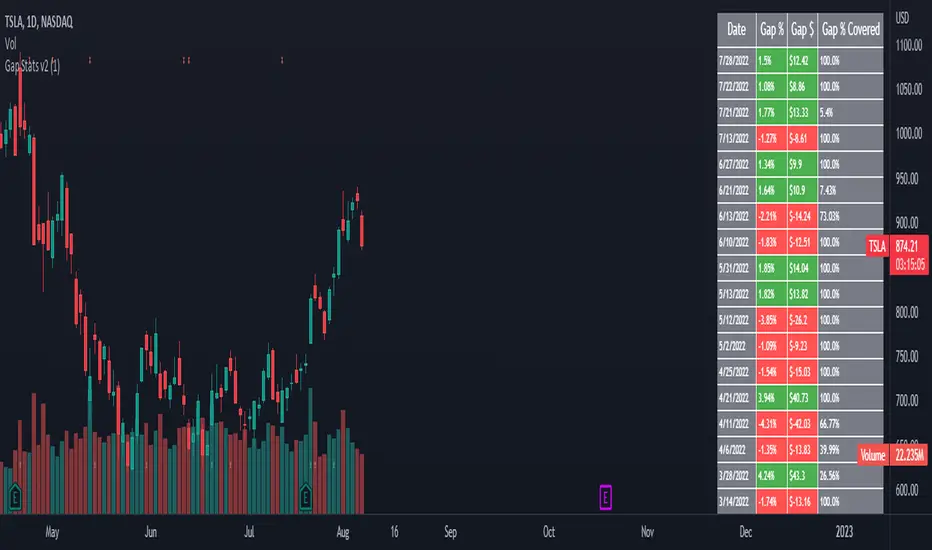
Gap Stats v2This helpful analysis tool displays a table of days a stock has gapped, how much it gapped by and what percentage of the gap was covered.
It is meant to be used on the daily timeframe and can help you distinguish if gaps are going to be filled or not. I like to use it mainly on medium + cap stocks
that have gapped overnight or pre-market and see what the tendency is with how it behaves after a major gap.
SUPERTREND MIXED ICHI-DMI-DONCHIAN-VOL-GAP-HLBox@RLSUPERTREND MIXED ICHI-DMI-VOL-GAP-HLBox@RL
by RegisL76
This script is based on several trend indicators.
* ICHIMOKU (KINKO HYO)
* DMI (Directional Movement Index)
* SUPERTREND ICHIMOKU + SUPERTREND DMI
* DONCHIAN CANAL Optimized with Colored Bars
* HMA Hull
* Fair Value GAP
* VOLUME/ MA Volume
* PRICE / MA Price
* HHLL BOXES
All these indications are visible simultaneously on a single graph. A data table summarizes all the important information to make a good trade decision.
ICHIMOKU Indicator:
The ICHIMOKU indicator is visualized in the traditional way.
ICHIMOKU standard setting values are respected but modifiable. (Traditional defaults = .
An oriented visual symbol, near the last value, indicates the progression (Ascending, Descending or neutral) of the TENKAN-SEN and the KIJUN-SEN as well as the period used.
The CLOUD (KUMO) and the CHIKOU-SPAN are present and are essential for the complete analysis of the ICHIMOKU.
At the top of the graph are visually represented the crossings of the TENKAN and the KIJUN.
Vertical lines, accompanied by labels, make it possible to quickly visualize the particularities of the ICHIMOKU.
A line displays the current bar.
A line visualizes the end of the CLOUD (KUMO) which is shifted 25 bars into the future.
A line visualizes the end of the chikou-span, which is shifted 25 bars in the past.
DIRECTIONAL MOVEMENT INDEX (DMI) : Treated conventionally : DI+, DI-, ADX and associated with a SUPERTREND DMI.
A visual symbol at the bottom of the graph indicates DI+ and DI- crossings
A line of oriented and colored symbols (DMI Line) at the top of the chart indicates the direction and strength of the trend.
SUPERTREND ICHIMOKU + SUPERTREND DMI :
Trend following by SUPERTREND calculation.
DONCHIAN CHANNEL: Treated conventionally. (And optimized by colored bars when overshooting either up or down.
The lines, high and low of the last values of the channel are represented to quickly visualize the level of the RANGE.
SUPERTREND HMA (HULL) Treated conventionally.
The HMA line visually indicates, according to color and direction, the market trend.
A visual symbol at the bottom of the chart indicates opportunities to sell and buy.
VOLUME:
Calculation of the MOBILE AVERAGE of the volume with comparison of the volume compared to the moving average of the volume.
The indications are colored and commented according to the comparison.
PRICE: Calculation of the MOBILE AVERAGE of the price with comparison of the price compared to the moving average of the price.
The indications are colored and commented according to the comparison.
HHLL BOXES:
Visualizes in the form of a box, for a given period, the max high and min low values of the price.
The configuration allows taking into account the high and low wicks of the price or the opening and closing values.
FAIR VALUE GAP :
This indicator displays 'GAP' levels over the current time period and an optional higher time period.
The script takes into account the high/low values of the current bar and compares with the 2 previous bars.
The "gap" is generated from the lack of overlap between these bars. Bearish or bullish gaps are determined by whether the gap is above or below HmaPrice, as they tend to fill, and can be used as targets.
NOTE: FAIR VALUE GAP has no values displayed in the table and/or label.
Important information (DATA) relating to each indicator is displayed in real time in a table and/or a label.
Each information is commented and colored according to direction, value, comparison etc.
Each piece of information indicates the values of the current bar and the previous value (in "FULL" mode).
The other possible modes for viewing the table and/or the label allow a more synthetic view of the information ("CONDENSED" and "MINIMAL" modes).
In order not to overload the vision of the chart too much, the visualization box of the RANGE DONCHIAN, the vertical lines of the shifted marks of the ICHIMOKU, as well as the boxes of the HHLL Boxes indicator are only visualized intermittently (managed by an adjustable time delay ).
The "HISTORICAL INFO READING" configuration parameter set to zero (by default) makes it possible to read all the information of the current bar in progress (Bar #0). All other values allow to read the information of a historical bar. The value 1 reads the information of the bar preceding the current bar (-1). The value 10 makes it possible to read the information of the tenth bar behind (-10) compared to the current bar, etc.
At the bottom of the DATAS table and label, lights, red, green or white indicate quickly summarize the trend from the various indicators.
Each light represents the number of indicators with the same trend at a given time.
Green for a bullish trend, red for a bearish trend and white for a neutral trend.
The conditions for determining a trend are for each indicator:
SUPERTREND ICHIMOHU + DMI: the 2 Super trends together are either bullish or bearish.
Otherwise the signal is neutral.
DMI: 2 main conditions:
BULLISH if DI+ >= DI- and ADX >25.
BEARISH if DI+ < DI- and ADX >25.
NEUTRAL if the 2 conditions are not met.
ICHIMOKU: 3 main conditions:
BULLISH if PRICE above the cloud and TENKAN > KIJUN and GREEN CLOUD AHEAD.
BEARISH if PRICE below the cloud and TENKAN < KIJUN and RED CLOUD AHEAD.
The other additional conditions (Data) complete the analysis and are present for informational purposes of the trend and depend on the context.
DONCHIAN CHANNEL: 1 main condition:
BULLISH: the price has crossed above the HIGH DC line.
BEARISH: the price has gone below the LOW DC line.
NEUTRAL if the price is between the HIGH DC and LOW DC lines
The 2 other complementary conditions (Datas) complete the analysis:
HIGH DC and LOW DC are increasing, falling or stable.
SUPERTREND HMA HULL: The script determines several trend levels:
STRONG BUY, BUY, STRONG SELL, SELL AND NEUTRAL.
VOLUME: 3 trend levels:
VOLUME > MOVING AVERAGE,
VOLUME < MOVING AVERAGE,
VOLUME = MOVING AVERAGE.
PRICE: 3 trend levels:
PRICE > MOVING AVERAGE,
PRICE < MOVING AVERAGE,
PRICE = MOVING AVERAGE.
If you are using this indicator/strategy and you are satisfied with the results, you can possibly make a donation (a coffee, a pizza or more...) via paypal to: lebourg.regis@free.fr.
Thanks in advance !!!
Have good winning Trades.
**************************************************************************************************************************
SUPERTREND MIXED ICHI-DMI-VOL-GAP-HLBox@RL
by RegisL76
Ce script est basé sur plusieurs indicateurs de tendance.
* ICHIMOKU (KINKO HYO)
* DMI (Directional Movement Index)
* SUPERTREND ICHIMOKU + SUPERTREND DMI
* DONCHIAN CANAL Optimized with Colored Bars
* HMA Hull
* Fair Value GAP
* VOLUME/ MA Volume
* PRIX / MA Prix
* HHLL BOXES
Toutes ces indications sont visibles simultanément sur un seul et même graphique.
Un tableau de données récapitule toutes les informations importantes pour prendre une bonne décision de Trade.
I- Indicateur ICHIMOKU :
L’indicateur ICHIMOKU est visualisé de manière traditionnelle
Les valeurs de réglage standard ICHIMOKU sont respectées mais modifiables. (Valeurs traditionnelles par défaut =
Un symbole visuel orienté, à proximité de la dernière valeur, indique la progression (Montant, Descendant ou neutre) de la TENKAN-SEN et de la KIJUN-SEN ainsi que la période utilisée.
Le NUAGE (KUMO) et la CHIKOU-SPAN sont bien présents et sont primordiaux pour l'analyse complète de l'ICHIMOKU.
En haut du graphique sont représentés visuellement les croisements de la TENKAN et de la KIJUN.
Des lignes verticales, accompagnées d'étiquettes, permettent de visualiser rapidement les particularités de l'ICHIMOKU.
Une ligne visualise la barre en cours.
Une ligne visualise l'extrémité du NUAGE (KUMO) qui est décalé de 25 barres dans le futur.
Une ligne visualise l'extrémité de la chikou-span, qui est décalée de 25 barres dans le passé.
II-DIRECTIONAL MOVEMENT INDEX (DMI)
Traité de manière conventionnelle : DI+, DI-, ADX et associé à un SUPERTREND DMI
Un symbole visuel en bas du graphique indique les croisements DI+ et DI-
Une ligne de symboles orientés et colorés (DMI Line) en haut du graphique, indique la direction et la puissance de la tendance.
III SUPERTREND ICHIMOKU + SUPERTREND DMI
Suivi de tendance par calcul SUPERTREND
IV- DONCHIAN CANAL :
Traité de manière conventionnelle.
(Et optimisé par des barres colorées en cas de dépassement soit vers le haut, soit vers le bas.
Les lignes, haute et basse des dernières valeurs du canal sont représentées pour visualiser rapidement la fourchette du RANGE.
V- SUPERTREND HMA (HULL)
Traité de manière conventionnelle.
La ligne HMA indique visuellement, selon la couleur et l'orientation, la tendance du marché.
Un symbole visuel en bas du graphique indique les opportunités de vente et d'achat.
*VI VOLUME :
Calcul de la MOYENNE MOBILE du volume avec comparaison du volume par rapport à la moyenne mobile du volume.
Les indications sont colorées et commentées en fonction de la comparaison.
*VII PRIX :
Calcul de la MOYENNE MOBILE du prix avec comparaison du prix par rapport à la moyenne mobile du prix.
Les indications sont colorées et commentées en fonction de la comparaison.
*VIII HHLL BOXES :
Visualise sous forme de boite, pour une période donnée, les valeurs max hautes et min basses du prix.
La configuration permet de prendre en compte les mèches hautes et basses du prix ou bien les valeurs d'ouverture et de fermeture.
IX - FAIR VALUE GAP
Cet indicateur affiche les niveaux de 'GAP' sur la période temporelle actuelle ET une période temporelle facultative supérieure.
Le script prend en compte les valeurs haut/bas de la barre actuelle et compare avec les 2 barres précédentes.
Le "gap" est généré à partir du manque de recouvrement entre ces barres.
Les écarts baissiers ou haussiers sont déterminés selon que l'écart est supérieurs ou inférieur à HmaPrice, car ils ont tendance à être comblés, et peuvent être utilisés comme cibles.
NOTA : FAIR VALUE GAP n'a pas de valeurs affichées dans la table et/ou l'étiquette.
Les informations importantes (DATAS) relatives à chaque indicateur sont visualisées en temps réel dans une table et/ou une étiquette.
Chaque information est commentée et colorée en fonction de la direction, de la valeur, de la comparaison etc.
Chaque information indique la valeurs de la barre en cours et la valeur précédente ( en mode "COMPLET").
Les autres modes possibles pour visualiser la table et/ou l'étiquette, permettent une vue plus synthétique des informations (modes "CONDENSÉ" et "MINIMAL").
Afin de ne pas trop surcharger la vision du graphique, la boite de visualisation du RANGE DONCHIAN, les lignes verticales des marques décalées de l'ICHIMOKU, ainsi que les boites de l'indicateur HHLL Boxes ne sont visualisées que de manière intermittente (géré par une temporisation réglable ).
Le paramètre de configuration "HISTORICAL INFO READING" réglé sur zéro (par défaut) permet de lire toutes les informations de la barre actuelle en cours (Barre #0).
Toutes autres valeurs permet de lire les informations d'une barre historique. La valeur 1 permet de lire les informations de la barre précédant la barre en cours (-1).
La valeur 10 permet de lire les information de la dixième barre en arrière (-10) par rapport à la barre en cours, etc.
Dans le bas de la table et de l'étiquette de DATAS, des voyants, rouge, vert ou blanc indique de manière rapide la synthèse de la tendance issue des différents indicateurs.
Chaque voyant représente le nombre d'indicateur ayant la même tendance à un instant donné. Vert pour une tendance Bullish, rouge pour une tendance Bearish et blanc pour une tendance neutre.
Les conditions pour déterminer une tendance sont pour chaque indicateur :
SUPERTREND ICHIMOHU + DMI : les 2 Super trends sont ensemble soit bullish soit Bearish. Sinon le signal est neutre.
DMI : 2 conditions principales :
BULLISH si DI+ >= DI- et ADX >25.
BEARISH si DI+ < DI- et ADX >25.
NEUTRE si les 2 conditions ne sont pas remplies.
ICHIMOKU : 3 conditions principales :
BULLISH si PRIX au dessus du nuage et TENKAN > KIJUN et NUAGE VERT DEVANT.
BEARISH si PRIX en dessous du nuage et TENKAN < KIJUN et NUAGE ROUGE DEVANT.
Les autres conditions complémentaires (Datas) complètent l'analyse et sont présents à titre informatif de la tendance et dépendent du contexte.
CANAL DONCHIAN : 1 condition principale :
BULLISH : le prix est passé au dessus de la ligne HIGH DC.
BEARISH : le prix est passé au dessous de la ligne LOW DC.
NEUTRE si le prix se situe entre les lignes HIGH DC et LOW DC
Les 2 autres conditions complémentaires (Datas) complètent l'analyse : HIGH DC et LOW DC sont croissants, descendants ou stables.
SUPERTREND HMA HULL :
Le script détermine plusieurs niveaux de tendance :
STRONG BUY, BUY, STRONG SELL, SELL ET NEUTRE.
VOLUME : 3 niveaux de tendance :
VOLUME > MOYENNE MOBILE, VOLUME < MOYENNE MOBILE, VOLUME = MOYENNE MOBILE.
PRIX : 3 niveaux de tendance :
PRIX > MOYENNE MOBILE, PRIX < MOYENNE MOBILE, PRIX = MOYENNE MOBILE.
Si vous utilisez cet indicateur/ stratégie et que vous êtes satisfait des résultats,
vous pouvez éventuellement me faire un don (un café, une pizza ou plus ...) via paypal à : lebourg.regis@free.fr.
Merci d'avance !!!
Ayez de bons Trades gagnants.

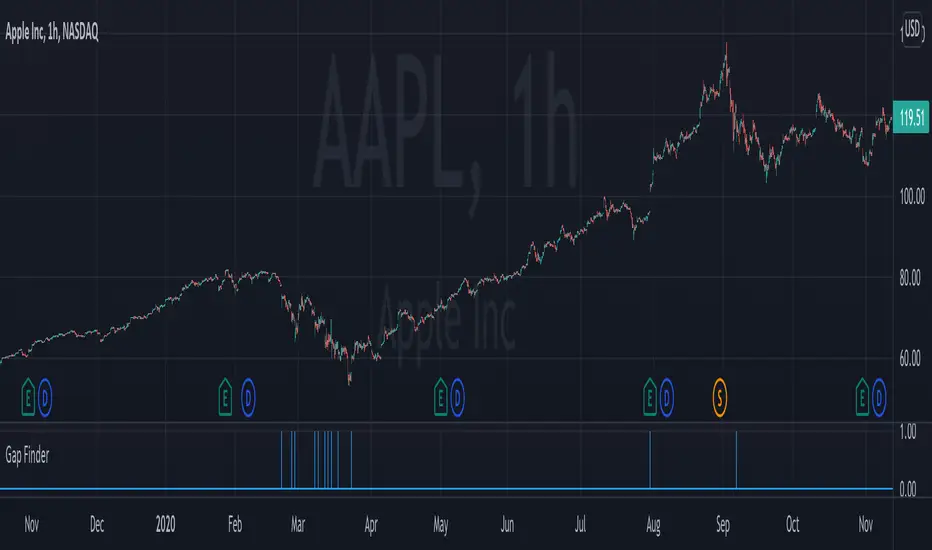
Gap FinderThis indicator finds gaps based on User specified input % threshold in the indicator settings. Histogram plot shows gaps as vertical lines for easy detection. Enjoy!
Customizable Gap FinderThis is a fully customizable gap finder. You can change the color of just about anything, on top of hiding filled/old gaps. This is so you can spot those tiny gaps on something such as futures. Be sure to play around with the settings.

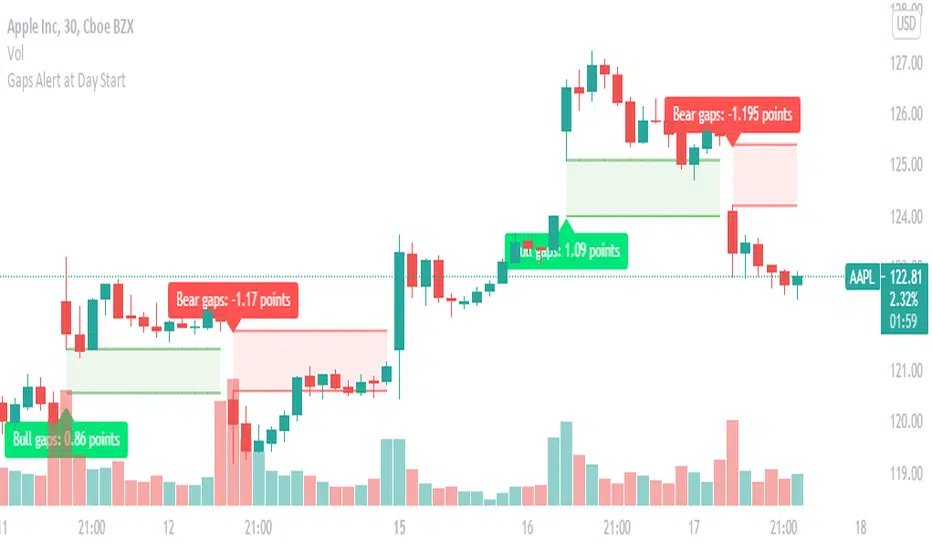
Gaps : set Alert to get Alert at Day StartGaps are areas on a chart where the price of a stock (or another financial instrument) moves sharply up or down,
with little or no trading in between. As a result, the asset's chart shows a gap in the normal price pattern.
The trader can interpret and exploit these gaps for profit.
What do i look for in these gaps, Will these gaps will fill or not fill?
When someone says a gap has been filled, that means the price has moved back to the original pre-gap level.
how you can benefit with this indicator?
this indicator instantly picks up the gap at the start of the day and also helps in identifying weather it is a bullish gap or a bearish gap
in this you can easily set up alerts, you will be instantly alerted if any gap occurs.
What does the visual on chart indicates ?
Green color gaps are bullish gaps or gap up ,label indicates the type of gap and the width of the gap
Red color gaps are bearish gaps or gap down ,label indicates the type of gap and the width of the gap
once you set alert you will Receive alert in the below format
Price (current price) 'Bear gap width: ' (gap Width in points)
Price (current price) 'Bull gap width: ' (gap Width in points)
This will work on all time frame equal to or less than "D".
DXY Helper for Binary Option by MrTuanDoanThe US Dollar Index (DXY) is really important for Binary traders who looking for setups on USD pairs.
With this indicator, you dont need another chart or switching between your current USD-pair chart and DXY chart.
What's the different with normal DXY?
THE DAILY GAP
If you know what happens when there is a GAP in DXY, this is your indicator.
FYI: I'll wait for the GAP TO BE FILLED. That means other USD-pairs will follow that "filling" direction.
Functions:
Draw DXY chart on other chart
Added Double Bollinger Bands
Added Parabolic SAR for the trend
Added GAP detection on chart
Added alert for GAP
Please always follow your Risk Managment
