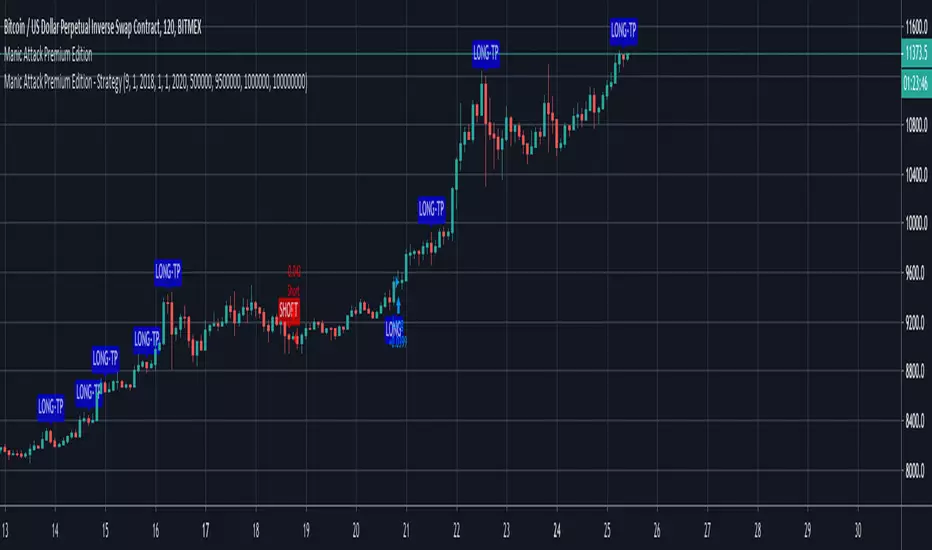
Combo Strategy 123 Reversal & FX Sniper: T3-CCI This is combo strategies for get a cumulative signal.
First strategy
This System was created from the Book "How I Tripled My Money In The
Futures Market" by Ulf Jensen, Page 183. This is reverse type of strategies.
The strategy buys at market, if close price is higher than the previous close
during 2 days and the meaning of 9-days Stochastic Slow Oscillator is lower than 50.
The strategy sells at market, if close price is lower than the previous close price
during 2 days and the meaning of 9-days Stochastic Fast Oscillator is higher than 50.
Second strategy
This simple indicator gives you a lot of useful information - when to enter, when to exit
and how to reduce risks by entering a trade on a double confirmed signal.
You can use in the xPrice any series: Open, High, Low, Close, HL2, HLC3, OHLC4 and ect...
WARNING:
- For purpose educate only
- This script to change bars colors.
Fx

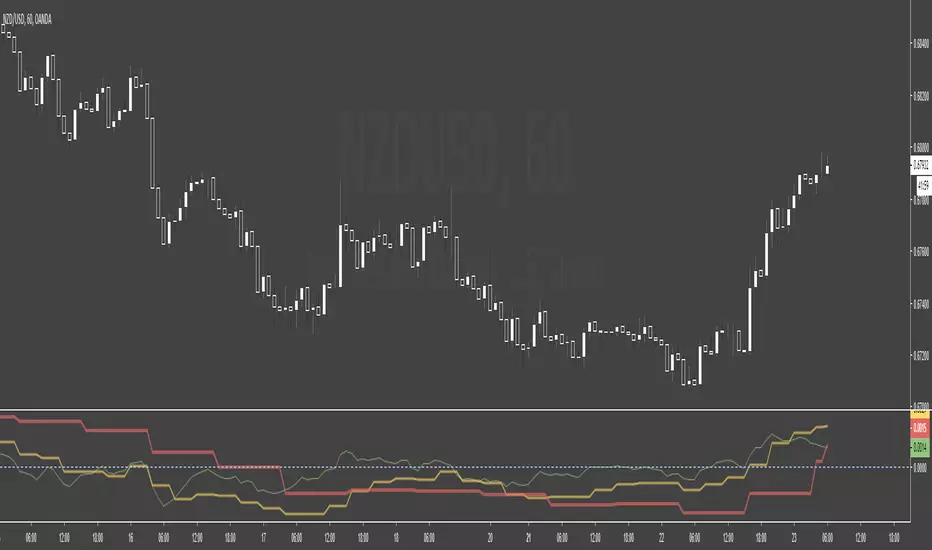
~Trend confirmation~トレンド早見表You can check the strength of 4 types of currencies.
Blue is dollar
Black is a circle
Green is pounds
Red is euro
You can change the color.
The higher the line, the more currency is being bought.
The lower the currency, the more the currency is sold.
If you want to script, please send DM
4種類の通貨の強さを確認することが出来ます。
青色はドル
黒色は円
緑色はポンド
赤色はユーロ
色の変更は可能です
線が上に行くほど通貨が買われています。
また下がるほど通貨は売られています。
スクリプト希望者はDMを御願いします。

~Wire drawing~~柴犬式線引き君柴犬式線引き君~It will automatically draw important lines.
It is formed from 5 lines.
The middle line is the most important. Build a scenario around this.
The other four have moved the middle line to a price that has moved significantly in the past.
If you want to script, please send DM
自動で重要な線を引いてくれます。
5本の線から形成されます。
真ん中の線が最も重要です。これを中心にシナリオを構築します。
その他4本は真ん中の線を過去に大きいく動いた価格に移動させています。
スクリプト希望者はDMを御願いします。

Fx Auto Supply and Demand [For Day Trading Only]Fx Auto Supply and Demand automatically plots important supply and demand levels for Forex day trading.

BlueFX Strategy GOLD M15We are releasing this separate script file for trading Gold on the M15 time frame using our strategy. This can now run independently from the main file instead of changing parameters and saving as a template - thus making the use of these specific settings even easier for our traders.
You can see the back testing profitability shown below, although you can not use back testing to predict the future, both the volume of trades, net profit, win rate and draw down demonstrate a solid foundation and data to move forward from.
The strategy itself is explained in the 'Blue FX Strategy' but see below too for more info.
Our strategy will help you identify the current trend in the markets and highlight when this is changing. The strategy itself is based upon 4 indicators lining up in total confluence to increase the probability of the trade being a success.
Absolutely no technical analysis is needed to trade this - this is a trading tool and has solid back testing results trading in isolation - although you may also use to support your own trading - the choice is yours.
When a trade is valid - a Buy or Sell label will appear with the Entry price, SL and multiple TP's shown on the chart.
IMPORTANT note, the test results show and confirm that the most profitable exit strategy with these Gold settings is 'FT&SL' this means we enter the trade with a Stop Loss (SL) and simply hold and follow the trend (Follow Trend = FT) until a reverse signal is printed.
In our supporting video (see related ideas) you can see the impact of changing this target between multiple TP's and the net effect on both win rate and overall net profitability.
The Lot size will also be displayed and this is based on the risk parameters you have set personally in the calculation section.
What is a Trading View Script?
A script is like an indicator but better, we can verify the success of our strategy by using Trading Views strategy tester function. As shown below and on the chart - you can see the 'Buy' and 'Close Buy' on the chart, supported by a live trading log showing you the entry, entry price date, volume and closing price.
This is a great function for numerous reasons; firstly, you know you are using a strategy that has provided a positive expectancy in back testing, secondly you can use this as a trading journal to support your trading too. This in itself can help you with your trading psychology - letting winning trades run is a prime example of this. Take confidence in the statistics and performance over time.
Ultimately, we believe we have saved YOU the need to firstly, find an edge and a strategy - and all of the time it takes to BACKTEST a strategy - to then find it may or may not work - and then you start again!
Disclaimer alert; Please remember past performance is exactly that - how our strategy performed over those dates tested, it is not obviously a guarantee of future performance.
Interested in access or more information?
No problem, simply drop us a DM via trading view for access information.
Thank you for reading.
Darren

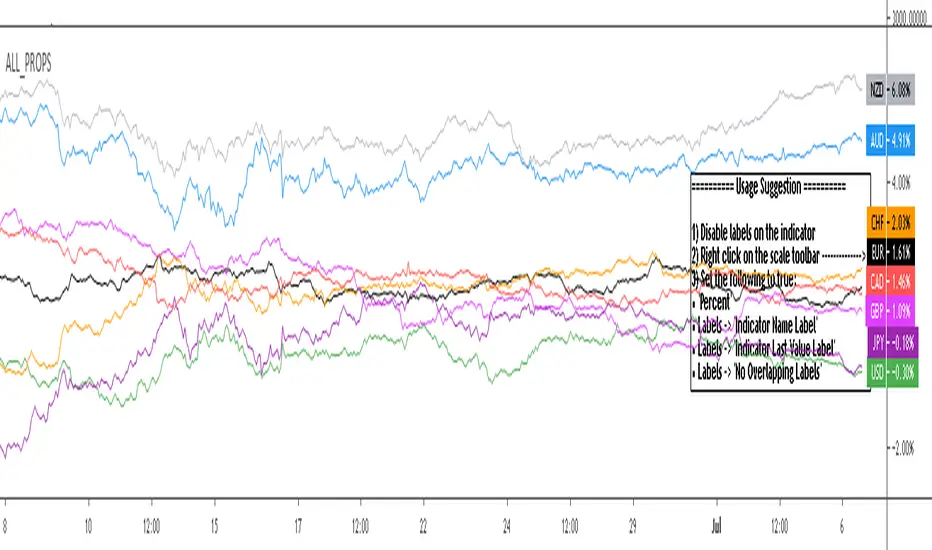
All_Props - non weighted currency indices for major fx pairsAll_Props - non weighted currency indices for major fx pairs
Quickly gauge major fx currency flows in one indicator
Extra use: 2 instances can be combined in the same indicator window to compare just the base currency vs the inverted quote currency. Note: You will need to set one of the instances to 'Only display base currency' and the other to 'Only display inverted quote currency' if you wish to use it in this manner. One of the instances should also have tradingview scaling set to 'Pin to Scale -> No scale fullscreen'
If you wish to update the indicator with new currency values then make a personal copy and update the 'Index Formulas: Copy and paste formulas here' section
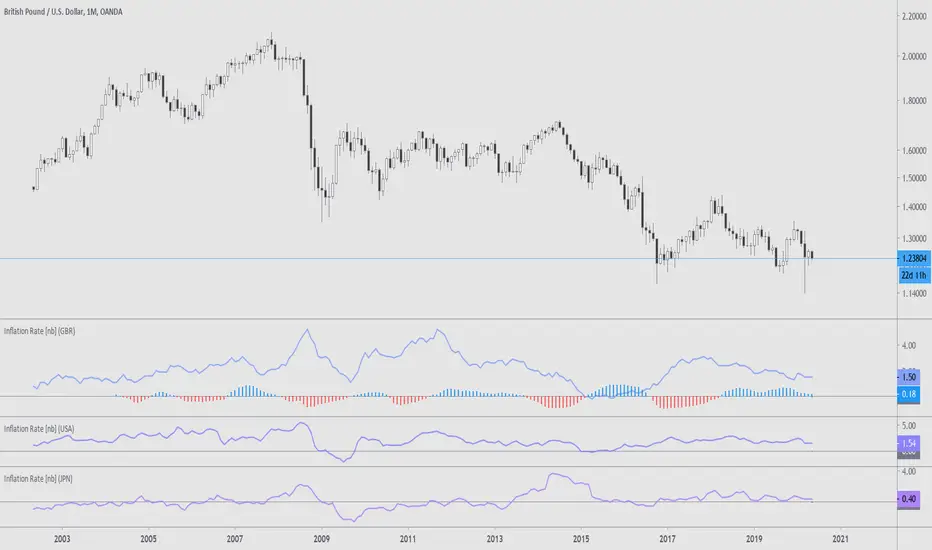
Many Inflation RateThis is a assortment of countries' inflation rates, sourced by Quandl. The countries are represented by their ISO 3166-1 alpha-3 codes in the options, and at the moment include:
ARG, AUS, CAN, CHE, DEU, EUR, FRA, GBR, ITA, JPN, NZL, RUS, USA
Included is a correlation to the current chart and the selected inflation rate. The correlation compares the monthly moving averages of YOY inflation and the chart closes over a period of two years. At the moment this doesn't seem to be the most efficient method of correlation/comparison, should there be one to begin with.
More information:
www.ons.gov.uk
www.bls.gov
voxeu.org
en.wikipedia.org
See here for a different version:
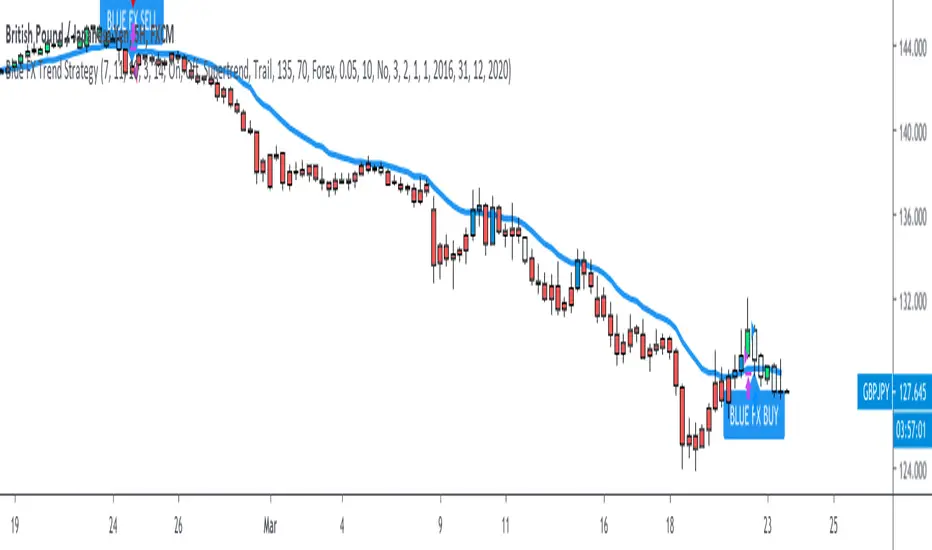
Blue FX Trend StrategyHi, welcome to the Blue FX Trend Strategy Script.
What does it do?
Our strategy will help you identify the current trend in the markets and highlight when this is changing. The strategy itself is based upon 4 indicators lining up in total confluence to increase the probability of the trade being a success, this is specifically an EMA, MACD settings, Supertrend criteria and also Momentum.
Absolutely no technical analysis is needed to trade this successfully - this can be used on all time frames and all pairs - obviously with varying profitability as all pairs work differently - this can be reviewed quickly in 'Strategy Tester' to hone in on your own desired settings.
When all criteria is in alignment the strategy will convert all candles to the relevant colour - Green for an uptrend and Red for a downtrend; a candle that is printed normally simply shows that no current trend is in place to warrant a colour change. A normal coloured candle could possibly indicate a change in current market direction or the market consolidating before a further move in the initial direction. When a new signal is valid 'Blue FX Buy'' or 'Blue FX Sell' will be displayed and the small arrow shown on candle open for entry.
How do I use it?
Our strategy is invite only - upon joining our group we will allow you access to the script. This will then simply display on your device ready for you to start trading from. There is substantial functionality within the strategy, you can;
See the success of the default settings in the past using the 'Strategy Tester' Function for numerous settings
1. Following the settings 'Trail'
2. Changing your TP function with the other criteria listed
3. Using a Fixed TP or SL function
Upon changing the Script to 'Fixed' you will see numerous trades on the chart displayed differently.
Scaling into a profitable position is also possible - this is ideally done when the candle colour confirms the trend is continuing after rejection/support from the EMA; we show this below;
You could also enter here if you missed the initial sell signal, we have MA rejection and a red printed candle indicating all confluences are in play and we have high probability for the move to continue.
How do I know its profitable?
We have built numerous customisable settings into the strategy for you to see that this is profitable - you can visually see this too. The settings are also customisable to find the right criteria for the right pair on the right time-frame. Ultimately, with the strategy confluences in place, you are putting probability in your favour and can quickly determine the trend in place if there is one. Within the customisable settings there is a compound function too, so if you were to compound your profit the results can be exceptional.
We have also added an H4 confluence, so you can ensure if trading on a lower time-frame you are in the overall direction of the H4 trend too, a useful setting for more confluence again.
Where do I set my Stop loss or Take Profit?
There is no right or wrong to this and we have attempted to build numerous ways of doing this into the strategy for reference.
For setting a SL you could;
1. Use a fixed SL.
2. Place the SL below the last high or low in the trend.
3. Use an ATR function.
4. Place the SL 5 pips below the last 3 candles.
5. Or, trail the price if you are on screen until the next signal is given and a new trend starts - although unless a big trend, you may miss out on some profit by the time price has pulled back.
For placing a Take Profit, you could;
1. Use a fixed TP.
2. Look for the next supply/demand area on the chart (if it breaks and candle colour supports direction - you could enter again).
3. Use an ATR function.
5. Or, trail the price if you are on screen until the next signal is given and a new trend starts - although unless a big trend, you may miss out on some profit by the time price has pulled back.
6. Secure multiple TPs - 20/50/100 pips with Stop loss to entry after the first target is hit.
Here are some examples of the Buy and Sell signals in action;
Will also work on Commodities and Indices as shown below too;
Our recommended visual settings are below;
1. Set to'Trail' Strategy
2. Under 'Style' tab, select Trades on Chart, but un-select both Signal Labels and Quantity to clean up the chart - these settings are useful when testing to see where the trades are opened and closed.
3. We like the candles changing colour to the trend and criteria set however, these can be turned off to display normal bullish and bearish candles.
When reviewing profitability you can do this by selecting 'Overview' 'Performance Summary' and 'List of Trades'.
Please consider that the settings based into the strategy could differ to your own money management rules and your management of your SL and TP as outlined above - we have tried to cover as many bases as possible here.
We look forward to you using this strategy to profit from the market, please share your feedback and results with us.
Kind regards
Blue FX Team
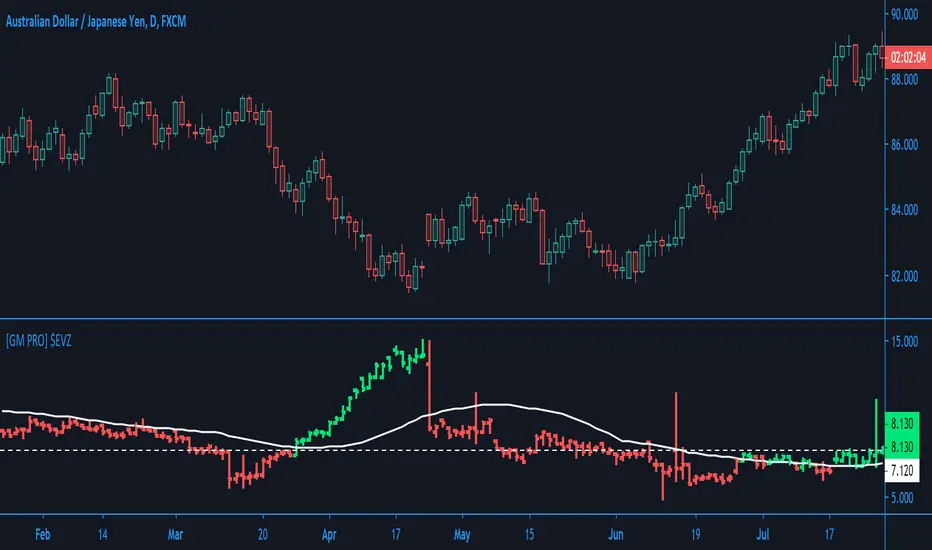
[GM PRO] $EVZCBOE: Euro FX VIX ($EVZ)
A reasonable indicator of overall Forex Market Volume and/or Volatility.
Filters added:
- Filter by Horizontal Level
- Filter by Moving Average
Options to consider the highs or the closing values
This indicator is only for Forex
shibasukya~柴犬スキャル~
重要な価格を自動で引く機能があります。
There is a function to automatically pull important prices.
この価格では反発する確率が高いので、その反発をスキャルピングでトレードします。
At this price, there is a high probability of a rebound, so trade that rebound by scalping.
リスクリワードを重視してトレードする様にして下さい。
Trade with an emphasis on risk rewards.

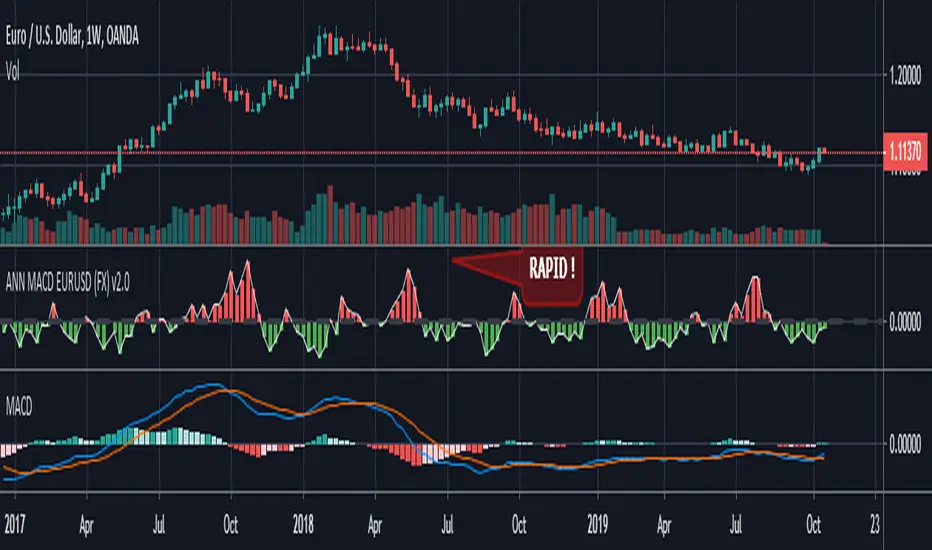
ANN MACD EURUSD (FX) Hello , this script is trained with eurusd 4-hour data. (550 columns) Details :
Learning cycles: 8327
AutoSave cycles: 100
Training error: 0.005500 ( That's a very good error coefficient.)
Input columns: 19
Output columns: 1
Excluded columns: 0
Training example rows: 550
Validating example rows: 0
Querying example rows: 0
Excluded example rows: 0
Duplicated example rows: 0
Input nodes connected: 19
Hidden layer 1 nodes: 2
Hidden layer 2 nodes: 5
Hidden layer 3 nodes: 0
Output nodes: 1
Learning rate: 0.6000
Momentum: 0.8000
Target error: 0.0055
NOTE : Use with EURUSD only.
Alarms added.
Thanks dear wroclai for his great effort.
Deep learning series will continue ! Stay tuned.
Regards , Noldo .
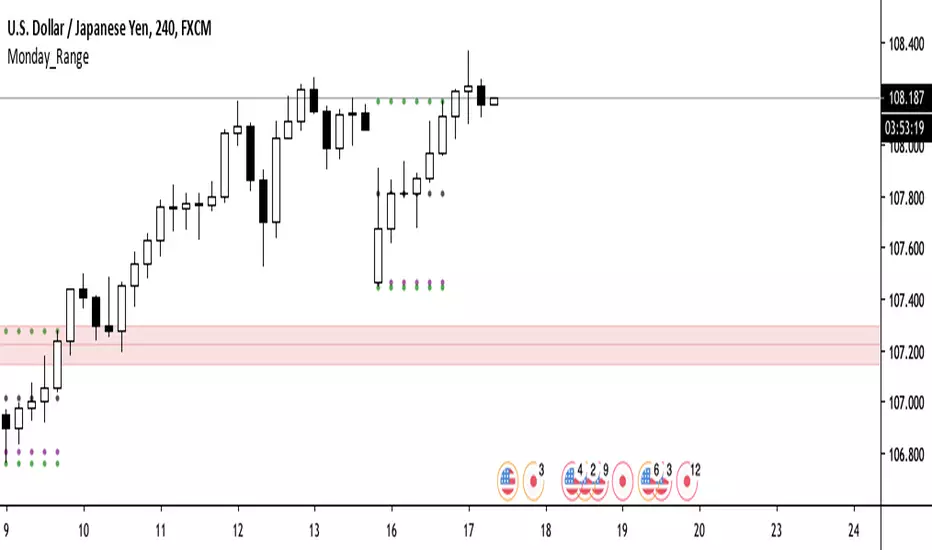
Monday Range - JasonT revisedA revision on the famous Monday Range Script, with the first day of the week goes to Monday for FX trading.
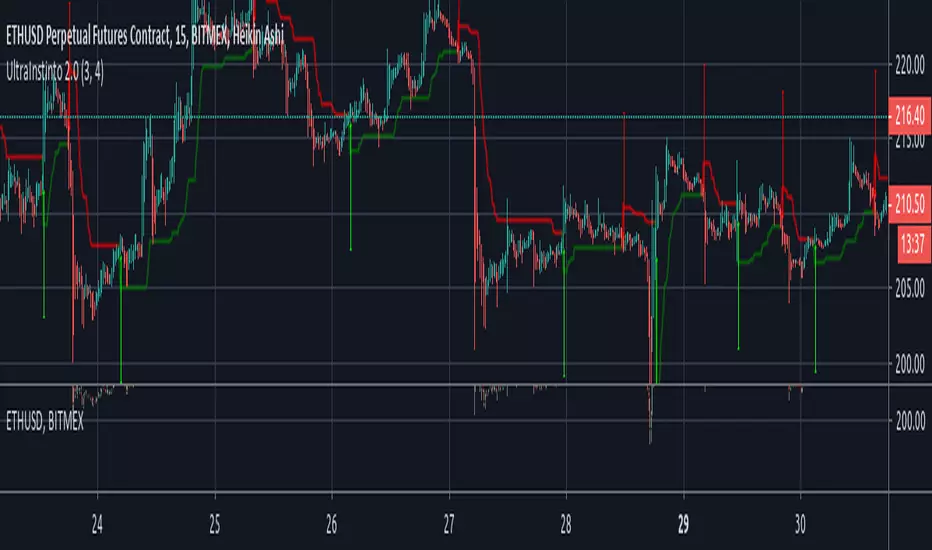
UltraInstinto 2.0BITMEX:ETHUSD
UltraInstinto 2.0 is a trend hunter tool, based on the latest artificial inteligence algorithms it can take decisions on real time, on any frametime, buy when the green arrow appears, and sell when the red arrow appears, easier than play fortnite, and returns you a lot of money

bitFlyer DeviationbitFlyer price deviation percent between FXBTCJPY and BTCJPY.
bitFlyerのBTCFXとBTC現物の価格乖離(%)を表示します。

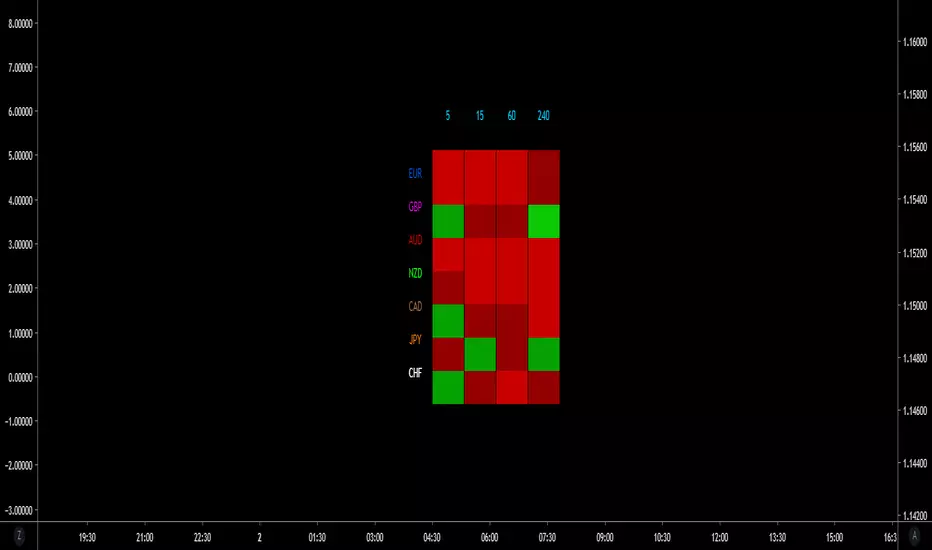
Heat Map Forex - Intraday
4 intraday time frames for a custom strength indication by color.
3 positive and 3 negative colors.
7 symbols, limited by the number of plots on the screen (64). All symbols against USD.
Works well with FX Percentage Change script.
Trading View also has a FOREX heat map widget, found here .
See Also:
1hTriLine, so much power, so easy to use....So many nuances to this one. So many powerful strategies to devise. Responsive. Accurate. Easy to use. Everything you can expect from one of my scripts. Trading made easy.
TempyRT Golden hoursPeak volume times for Asia (Sydney lead into Tokyo open), London open/session into and through NY open/session

FX Scalping Indicators (Revised)This is an edit from: 1 minute 'Forex Scalping Strategy'
Added realistic Stop/Loss + Take Profit
Now works fluently with 1-15 Minute charts.
Adjusted EMA lengths
Tested on other majors and provides the same if not better results. (:
I'll be using this upon open and will update with live results.


