Cauchy Distribution Trend AnalysisThis custom Pine Script indicator is designed to analyze assets, including cryptocurrencies, through a lens inspired by the Cauchy distribution's characteristics. It focuses on identifying potential long and short opportunities by evaluating the asset's price position relative to a dynamically calculated median price and a scale parameter. Here's a breakdown of its components and how to use it:
Components
Median Length: The period over which the median price is calculated. The median price acts as a proxy for the Cauchy distribution's location parameter, representing a central value around which the market price fluctuates.
MA Length: The length for calculating the moving average, which is used to determine the scale parameter. The scale parameter estimates the average volatility around the median price, adjusted for the selected averaging method.
Moving Average Type: Offers a choice between HMA (Hull Moving Average), SMA (Simple Moving Average), and EMA (Exponential Moving Average) to calculate the scale parameter. This flexibility allows users to tailor the sensitivity of the scale parameter to the asset's price volatility.
Median Price Calculation: Uses the close price (by default) to calculate the median price over the specified period.
Scale Parameter Calculation: A function that calculates the scale parameter based on the chosen average source. This parameter is used to identify the threshold for long and short conditions.
Strategy Logic
Long Condition: Triggered when the asset's close price is greater than the sum of the median price and the scale parameter. This indicates that the asset's price has moved significantly above the median price, suggesting bullish momentum.
Short Condition: Triggered when the asset's close price is less than the difference between the median price and the scale parameter. This indicates that the asset's price has moved significantly below the median price, suggesting bearish momentum.
Rata-Rata Pergerakan Eksponensial / Exponential Moving Average (EMA)

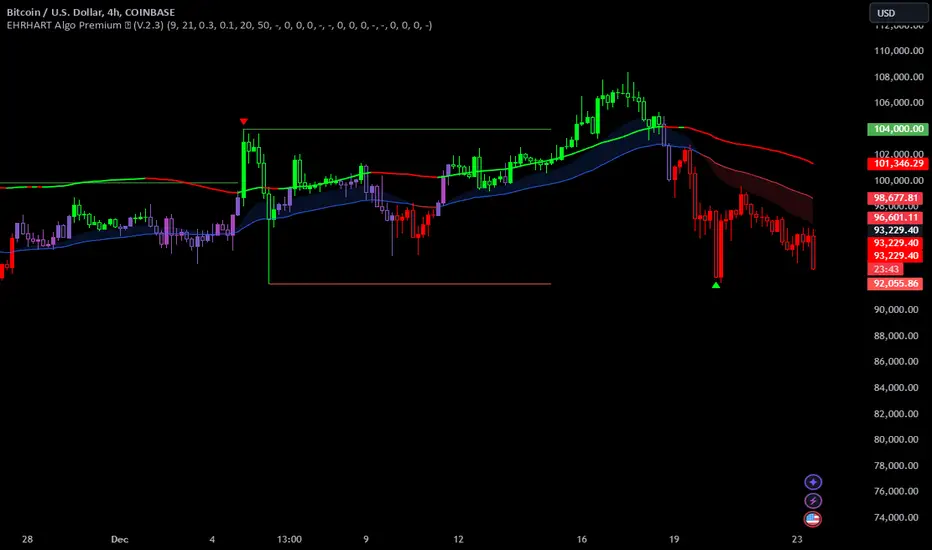
EHRHART Algo Premium (V.2)EHRHART Algo Premium is a indicator designed to help traders analyze market flow. It work with multiple EMA for identifying the sentiment of market. It's very simple calculation but it's a good help for people who use price action. I think the visual of the chart is very important and and I wanted to create an indicator very visual. I'm price action lover like lots of people and I personally think it's very important to identify the flow of market because buying when the flow of market is up give you better chance to win your trade. It's not BUY and SELL signal, this indicator don't tell u when u need buy or when u need sell, it's principally here for helping the visual of trading chart (have a good clear chart). I decided to post this indicator because people were asking me how it worked and were curious about these colors, so here we go !
This indicator show:
The main flow ( green candle=buy pressure /red candle=seller pressure ), it's based on two EMA cross over, this two EMA are editable so u can take the combination you want depending on your trading strategy. When the first EMA is above the second EMA candle becoming green and when the second EMA is above the first EMA candle becoming red.
The trend of two EMA crossover (blue=bullish and violet=bearish), it's based on two EMA (two different than main flow) cross over, this two EMA are editable so u can take the combination you want depending on your trading strategy. When the first EMA is above the second EMA the trend becoming blue and when the second EMA is above the first EMA the trend becoming violet.
Potential trend reversals (violet candle), it's calculate with the two EMA of the main flow, when these two EMA becoming closer, the candle becoming violet. It meaning that the trend may reversals. I added sensitivity parameter, so u can adjust it depending on your trading strategy, the more sensitive it is, the more candle will be colored violet.
A system of RSI print on the chart, when the RSI becoming overbought (more than 75) a red triangle will pop up on the chart, and when the RSI becoming oversold (less than 25) a green triangle will pop up on the chart. U can show or hidden these setting.
Bullish candles are represented by hollow candles.
Bearish candles are represented by full candles.
You can use this indicator with multiple strategy, I personally use it with price action (support/resistance) and I made it for that (but it's your choice).
This is an example of how I'll use it:
Here we can see that the price is coming testing our weakly support, however the main flow is bullish (red candle), so I'm waiting my first signal (violet candle). When the first candle passed violet I decided to enter the trade because violet candle after red candle means that the two EMA start closed to themselves meaning that's the flow may turn green. My second signal will be candle passed green, because it meaning the two EMA start deviate from themselves, buyer are taking advantage. In this situation a green triangle on the support will be my third signal.
Price and Volume Stochastic Divergence [MW]Introduction
This indicator creates signals of interest for entering and exiting long and short positions on equities. It primarily uses up and down trends defined by the change in cumulative volume with some filtering provided by a short period exponential moving average (9 EMA by default).
Settings
Moving Average Period : The moving average over which the cumulative volume delta is calculated. Default: 14
Short Period EMA : The EMA used to represent price action, and is used to generate the EMA Delta line. Default: 27 (3*3*3)
Long Period EMA : The second EMA used to calculate the EMA Delta line. Default: 108 (2*2*3*3*3)
Stochastic K Value : The value used for stochastic curve smoothing. Default: 3
Dot Size : The diameter of the larger indicator. Default: 10
Dot Transparency : The transparency level of the outer ring of the primary BUY/SELL signal. Default: 50 (0 is opaque, 100 is transparent)
Band Distance from 0 to 100 : The upper and lower band distance. Default: 20
Calculations
The cumulative volume delta (CVD) is calculated using candle bodies and wicks. For a red candle, buying volume is calculated by multiplying the volume by the spread percentage of the average of the top and bottom wicks, while Selling Volume is calculated multiplying the volume by the spread percentage of the average of the top and bottom wicks - in addition to the spread percentage of the candle body.
For a green candle, buying volume is calculated by multiplying the volume by the spread percentage of the average of the top and bottom wicks - plus the spread percentage of the candle body - while Selling Volume is calculated using only the spread percentage average of the top and bottom wicks.
Once we have the CVD, we can then perform a stochastic calculation of the CVD value.
stochastic calculation = (current value - lowest value in period) / (highest value in period - lowest value in period)
We’ll do the same stochastic calculation for the short term EMA (27 EMA default) as well as for the difference between the short term and long term EMA.
When the stochastic CVD value is rising from zero and the short term EMA stochastic value equals 100, then it’s a major bullish signal. When the stochastic CVD value is falling from 100 and the short term EMA stochastic value equals 0, then it’s a major bearish signal.
Sometimes, after a bullish or bearish signal, the stochastic CVD will reverse direction triggering a new opposing signal.
How to Interpret
The CVD indicates when there is either more buying than selling or vice versa. A value over 50 for the stochastic CVD curve represents more buying taking place. A value below 50 represents more selling. One might intuitively believe that when there is more buying volume than selling volume that the price would follow suit. This is not always the case.
Most of the time buying volume will precede consistent price movement upwards, and selling volume will precede consistent price movement downwards. When this divergence occurs, the indicator generates a signal. When this divergence begins to fail, and buying or selling volume reverses, then another signal is generated indicating that the buying/selling impulse is headed back into the direction of price action.
These interactions are visually represented on the chart with the coral line that represents CVD, and the yellow line that represents the EMA, or the average price. When the coral line goes up and the yellow line stays down, that’s the BUY signal. When the coral line goes down and the yellow line stays up, that’s the sell signal. When the coral line switches direction, the chart generates another signal showing that volume is moving in a direction that supports the price.
The orange line represents the stochastic representation of the difference between the short EMA (27 by default) and the long EMA (108 by default). EMA differences is a method that can be used to define a trend. When a short term EMA is above a longer term EMA, that may represent a bullish trend. When it is below, that may represent a bearish trend. When all 3 lines are rising or falling in the same direction at the same time, it tends to indicate a movement that has the potential to continue.
Other Usage Notes and Limitations
It's important for traders to be aware of the limitations of any indicator and to use them as part of a broader, well-rounded trading strategy that includes risk management, fundamental analysis, and other tools that can help with reducing false signals, determining trend direction, and providing additional confirmation for a trade decision. Diversifying strategies and not relying solely on one type of indicator or analysis can help mitigate some of these risks.
This indicator can be paired with the MW Volume Impulse indicator if it is desired to see the actual buying and selling cumulative volume deltas. Also, in many cases, the BUY and SELL signals tend to correspond with Keltner Bands (ATR Bands) becoming extended. Lastly, volume weighted average price (VWAP) along with other macro events can impact price and negate signals. To view VWAP lines, you may choose to use the Multi VWAP or Multi VWAP for Gaps indicator to help ensure that the signals you see in this indicator are not being affected by VWAP lines.

VWAP 8EMA Crossover Scalping IndicatorWhy?
Everybody, especially in Indian context, from 9:15 AM to 3:30 PM, wants to trade in BankNifty.
And even 15m is Too Big timeframe for The Great Indian Options buyers. Everyone knows how potentially BankNifty (& FinNifty on Tuesday and Sensex on Friday) can show dance within 15m.
So there always been an overarching longing among traders to have something in shorter timeframes. And this 5m timeframe, looks like a universally (sic) accepted Standard Timeframe for Indian Options traders.
So here is this.
What?
The time we are publishing this public indicator Indian market (Nifty) is in ATH at ~22200.
In any such super trending market it's always good to wait for a dip and then in suitable time, enter the trade in the direction of the larger trend. The reversal trading systems, in such a situation, proves to be ineffective.
Of course there are time when market is sideways and keeps on oscillating between +/2 standard deviation of the 20 SMA. In such a situation the reversal play works perfectly. But not so in such a trending market.
So the question comes up - after a dip what's the right point to enter.
Hence comes the importance of such a crossover based trading system.
In this indicator, it's a well-known technique (nothing originally from ours, it's taken from social media, exact one we forgot) to find out the 8EMA and VWAP crossover.
So we learned from social media, practice in our daily trading a bit, actuate it and now publishing it.
A few salient points
It does not make sense to jump into the trade just on the crossover (or crossunder).
So we added some more sugar to it, e.g. we check the color the candle. Also the next candle if crosses and closes above (or below) the breakout candle's high/low.
The polarity (color) of both the alert (breakout/breakdown) and confirmation candle to be same (green for crossover, red from crossunder).
Of course, it does provider BUY and SELL alerts separately.
These all we have found out doing backtesting and forward testing with 1/2 lots and saw this sort of approaches works.
Hence all of these are added to this script.
Nomenclature
Here green line is the 8EMA and the red line is the VWAP.
Also there is a black dotted line. That's 50 EMA. It's to show you the trend.
The recent trade is shown in the top right of the chart as green (for buy) or red (for sell) with SL and 1:1 target.
How to trade using this system?
This is roughly we have found the best possible use of this indicator.
Lets explain with a bullish BUY positive crossover (means 8EMA is crossing over the daily VWAP)
Keep timeframe as 5m
Check the direction/slope of the black dotted line (50 EMA). If it's upwards, only take bullish positions.
Open the chart which has the VWAP. (e.g. FinNifty spot or MidcapNifty spot does not have vwap). So in those cases Future is the way to go.
Wait for a breakout crossover and let the indicator gives a green, triangular UP arrow.
Draw a horizontal line to the close of that candle for next few (say 6 candles i.e. 30m) candles.
Wait for the price first to retest the 8EMA or even better the VWAP (or near to the 8EMA, VWAP)
Let the price moves and closes above the horizontal line drawn in the 4th step.
Take a bullish trade, keeping VWAP as the SL and 1:1 as the target.
Additionally, Options buyer can consult ADX also to see if the ADX is more than 25 and moving up for the bullish trade. (This has to be added seperately in the chart, it's not a part of the indicator).
Mention
The concept we have taken from some social media. Forget exactly where we heard this first time. We just coded it with some additional steps.
Statutory Disclaimer
There is no silver bullet / holy grail in trading. Nothing works 100% time. One has to be careful about the loss (s)he can bear in case of the trade goes against.
We, as the author of this script, is not responsible for any trading or position decision one is taken based on the outcome of this.
It is our sole discretion to change, add, delete the portion or withdraw the whole script without any prior notice or intimation.
In Indian Context: We are not SEBI registered.

Multi MAs mit LabelA MA (Moving Average) is useful to identify a trend of an assets. The TradingView builtin indicator "Exponential Moving Average" is useful, but limited in some aspects:
Bound to the active timeframe (e.g. h1)
One MA per indicator instance. Makes it confusing when using multiple
In reality to want to have multiple MAs with different types (EMA, SMA), length and timeframes on your chart to identify trading opportunities. As an example you can use the daily EMA12 and EMA21 to identify the trend and EMA200 on the h4 to enter a trade. That's what this script is used for.
The provided script is an extension to the indicator powered by chipmonk (link to profile below). The original script let you add up to 8 EMAs that can be bound to any timeframe and length. The timeframe and length is displayed on the chart next to EMA.
Unfortunately you can only add EMAs (Exponential Moving Averages) and no SMAs (Simple Moving Averages). That's why the script was extended. You can now choose the type (EMA or SMA) for up to 8 MAs.
Links
Profile of chipmonk
Indicator by chipmonk

Trend Change IndicatorThe Trend Change Indicator is an all-in-one, user-friendly trend-following tool designed to identify bullish and bearish trends in asset prices. It features adjustable input values and a built-in alert system that promptly notifies investors of potential shifts in both short-term and long-term price trends. This alert system is crucial for helping less active investors correctly position themselves ahead of major trend shifts and assists in risk management after a trend is established. It's important to note that this indicator is most effective with assets that historically exhibit strong trends.
At the heart of this tool is the interaction between the 30-day and 60-day Exponential Moving Averages (EMA). A bullish trend is indicated in green when the 30-day EMA is above the 60-day EMA, while a bearish trend is signaled in red when the 30-day EMA is below the 60-day EMA. The appearance of gray alerts users to potential shifts in the current trend as the EMAs converge, falling below the Average True Range (ATR) safety margin. This analysis is conducted across both hourly and daily timeframes, with the 4-hour timeframe providing early signals for daily trend changes. The band visually represents the interaction between the daily EMAs and is also displayed in the second row of the table, with the first row showing the same EMA interaction on the 4-hour timeframe.
This indicator also includes a 140-day (20-week) Simple Moving Average (SMA), visually represented by a line with predictive dots. This feature significantly enhances the investor's ability to understand long-term trends in asset prices, offering forward-looking insights by projecting the SMA value 10 days into the future. The value of this forecast lies in interpreting the slope of the dots; upward trending dots suggest a bullish underlying trend, while downward trending dots indicate a bearish trend. Generally, prices above the SMA signal bullishness, and prices below indicate bearishness.
In summary, the Trend Change Indicator is a comprehensive solution for identifying price trends and managing risk. Its intuitive, color-coded design makes it an indispensable tool for traders and investors who aim to be well-positioned ahead of trend shifts and manage risk once a trend has been established. While it has proven historically valuable in trending markets such as cryptocurrencies, tech stocks, and commodities, it is advisable to use this indicator in conjunction with other technical analysis tools for a more comprehensive and well-rounded decision-making process.

EMA + Lower Timeframe EMA (correct display in Replay Mode)This indicator shows
one EMA for the current timeframe
one EMA for a lower timeframe
Unlike the built-in Tradingview EMA indicator, this indicator shows the correct values for the lower timeframe EMA during Replay Mode.
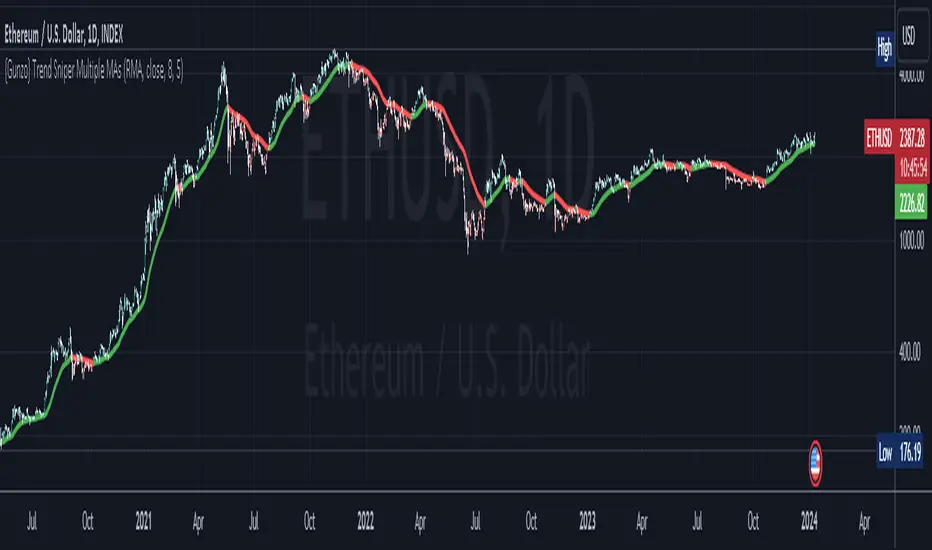
{Gunzo} Trend Sniper (Multiple MAs with coefficient)Updated GUNZO's Trend Sniper script by adding in different MA types to choose from. This can help reduce false signals and sharpen the trend reversal points.
Here's a summary of the key changes:
1. Multiple Moving Average Types: The original script was focused solely on the Weighted Moving Average (WMA) with a coefficient. The updated script introduces flexibility by allowing users to choose from a variety of Moving Average types, including WMA, VWMA (Volume Weighted Moving Average), EMA (Exponential Moving Average), SMA (Simple Moving Average), HullMA (Hull Moving Average), TEMA (Triple Exponential Moving Average), DEMA (Double Exponential Moving Average), T3, and RMA (Running Moving Average).
2. Coefficient Integration: In the original script, the coefficient was specifically designed for the WMA calculation. The updated script extends this concept to all the selected Moving Average types. This coefficient is applied differently depending on the type of MA, often affecting the length of the MA calculation.
3. Dynamic Length Calculation: For MAs that traditionally use an integer length (like SMA, EMA, etc.), the updated script calculates this length dynamically by multiplying the user-defined length by the coefficient and then rounding it to the nearest integer. This ensures compatibility with Pine Script's requirements for these functions.
All credits to GUNZO
original script:
PlayBit EMAPlayBit EMA Indicator
Introducing the PlayBit EMA, a highly esteemed technical analysis tool within the PlayBit Community and a personal favorite of Bitcoin Playboy. This indicator has cemented its place as a staple among traders for its simplicity and effectiveness.
Key Features:
PB EMA: Utilizes two Exponential Moving Averages (EMAs) to identify support and resistance zones and help identify potential reversal points.
Dynamic Fill Color:
The fill color will change based on if the closing price is above, below, or in between.
This indicator is not only a reflection of market dynamics but also an essential tool for traders looking to make informed decisions based on the relationship between price action and moving averages. Whether you're a seasoned trader or just starting out, the PlayBit EMA is an invaluable addition to your trading arsenal.

CARNAC Elasticity IndicatorThe CARNAC Elasticity Indicator (EI) is a technical analysis tool designed for traders and investors using TradingView. It calculates the percentage deviation of the current price from an Exponential Moving Average (EMA) and helps traders identify potential overbought and oversold conditions in a financial instrument.
Key Features:
EMA Length: Users can customize the length of the Exponential Moving Average (EMA) used in the calculations by adjusting the "EMA Length" parameter in the indicator settings.
Percentage Deviation: The indicator calculates the percentage deviation of the current price from the EMA. Positive values indicate prices above the EMA, while negative values indicate prices below the EMA.
Maximum Deviations: The indicator tracks the maximum positive (above EMA) and negative (below EMA) percentage deviations over time, allowing traders to monitor extreme price movements.
Bands: Upper and lower bands are displayed on the indicator chart at 100 and -100, respectively. Additionally, dashed middle bands at 50 and -50 provide reference points for moderate deviations.
Dynamic Color Coding: The indicator uses dynamic color coding to highlight the current percentage deviation. It turns red for values above 50 (indicating potential overbought conditions), green for values below -50 (indicating potential oversold conditions), and purple for values in between.
How to Use:
Overbought Conditions: Watch for the percentage deviation to cross above 50, indicating potential overbought conditions. This might be a signal to consider selling or taking profits.
Oversold Conditions: Look for the percentage deviation to cross below -50, signaling potential oversold conditions. This could be an opportunity to consider buying or entering a long position.
Historical Extremes: Keep an eye on the upper and lower bands (100 and -100) to identify historical extremes in percentage deviation.
The CARNAC Elasticity Indicator can be a valuable tool for traders seeking to identify potential trend reversals and assess the strength of price movements. However, it should be used in conjunction with other technical analysis tools and risk management strategies for comprehensive trading decisions.

Trend Finding by EMAsINTRO
This indicator is a price action based tool used to visualize trends using Exponential Moving Averages (EMAs).
CONCEPTS
It's created with two EMAs with different lengths (9 and 15) based on user-defined parameters. The script calculates the EMAs for the given lengths using the closing prices of the asset.
The EMAs are plotted on the chart, and their colors are dynamically determined by a conditional statement. If slower EMA is crossing above the faster EMA than the color will be change, And vise-versa for the opposite.
USES:-
The visualization of EMAs in different colors assists in identifying potential trends:
a bullish trend when EMAs color is Blue
and a bearish trend when EMAs color are Red.
Purpose
This script provides a quick visual representation of potential trend changes based on the relationship between these two EMAs.

ASFX SignalsDescription:
The ASFX Signals Indicator, created by OmegaTools, is an open-source Pine Script™ code designed to provide traders with valuable signals for potential entry and exit points in the market. This script incorporates a combination of Exponential Moving Average (EMA) signals and Volume Weighted Average Price (VWAP) confluence, enhancing the precision of trading decisions.
Key Features:
Threshold Configuration: Users can customize the threshold parameter (thres) to fine-tune signal sensitivity, adapting the indicator to different market conditions.
EMA Length Customization: The script allows traders to adjust the length of the Exponential Moving Average (EMA) with the "EMA Length" input, providing flexibility in capturing various trends.
Show/Hide Options: Users have the flexibility to choose whether to display the EMA line, VWAP confluence, and VWAP upper and lower bands, tailoring the visual representation based on individual preferences.
VWAP Confluence: The indicator integrates VWAP confluence, offering additional confirmation for trading signals. Traders can choose the VWAP resolution and set the deviation parameter for enhanced accuracy.
Signal Filtering: The script intelligently filters signals based on the percentage of the candle that crosses the EMA. Long signals are filtered out if the closing price is above the VWAP or the specified threshold, and short signals are filtered out if the closing price is below the VWAP or the threshold.
Visual Signals: The indicator provides clear visual signals for long and short entries, making it easy for traders to identify potential opportunities. The signals are accompanied by arrows and labels for quick interpretation.
How to Use:
Adjust the threshold, EMA length, and VWAP parameters based on your trading preferences.
Choose whether to display the EMA line, VWAP confluence, and upper/lower bands.
Interpret long and short signals for potential entry and exit points, considering the percentage of the candle that crosses the EMA.
Consider additional confirmation provided by VWAP confluence.
Concepts and Methodology:
The ASFX Signals Indicator combines EMA signals and VWAP confluence to generate actionable trading signals. The script intelligently considers the percentage of the candle that crosses the EMA, providing a nuanced approach to signal confirmation. The EMA offers trend insights, while VWAP confluence enhances signal reliability.

FlexiMA Variance Tracker [presentTrading]🔶 Introduction and How it is Different
The FlexiMA Variance Tracker (FlexiMA-VT) represents a novel approach in technical analysis, distinctively standing out in the realm of financial market indicators. It leverages the concept of a variable Length Moving Average (MA) to create a versatile and dynamic oscillator. Unlike traditional oscillators that rely on a fixed-length MA, the FlexiMA-VT adapts to market conditions by varying the length of the MA, offering a more responsive and nuanced view of market trends. (*The achieved method took reference from SuperTrend Polyfactor Oscillator)
This innovative design allows the FlexiMA-VT to capture a broader spectrum of market movements, making it highly effective in diverse trading environments. Whether in stable or volatile markets, its adaptability ensures consistent relevance, providing traders with deeper insights into potential market swings.
The proposed oscillator accentuates several key aspects through a distinctive mesh of bars, which are derived from the differences between the price and a set of 20 Moving Averages, each altered by varying factors. The intensity of the mesh's colors serves as an indicator, with brighter hues signifying a greater convergence of Moving Average signals.
Starting Length = 5
Starting Length = 40
🔶 Strategy, How it Works: Detailed Explanation
1. Core Concept:
The FlexiMA-VT operates by comparing the price or an average value (indicator source) against a set of moving averages with varying lengths.
These lengths are dynamically adjusted through a starting factor and multiple increment factors, ensuring a comprehensive analysis over different time scales.
2. Normalization and Standard Deviation Calculation:
Once deviations are calculated, they undergo a normalization process, which can be set to 'None', 'Max-Min', or 'Absolute Sum'.
This step is crucial as it standardizes the deviations, allowing for a consistent scale of comparison.
The standard deviation of these normalized deviations is then calculated, offering insights into the market’s volatility and potential trend strength.
🔹Normalization
3. Median Value and Oscillator Creation:
The median of the normalized deviations forms the core of the FlexiMA-VT oscillator.
This median value provides a balanced central point, reflecting the consensus of various MA lengths.
The standard deviation bands plotted around the median enhance the interpretative power of the oscillator, indicating potential overbought or oversold conditions.
4. Multi-Factor Analysis:
The FlexiMA-VT uses multiple increment factors to generate a range of MAs, each factor representing a different scale of trend analysis.
By averaging the results from these different scales, the FlexiMA-VT forms a more comprehensive and reliable oscillator.
🔹Consensus
5. Practical Application:
Traders can use the FlexiMA-VT for various purposes, including identifying trend reversals, gauging market momentum, and determining overbought or oversold conditions.
Its dynamic nature makes it adaptable to different trading strategies, from short-term scalping to long-term position trading.
🔶 Settings
1. Indicator Source (indicatorSource): Determines the base data for calculations, typically a price average (HLC3).
2. Indicator Length (indicatorLength): Sets the base length for Moving Averages, influencing initial calculations.
3. Starting Factor (startingFactor): Initial multiplier for MA length, impacting the starting point of analysis.
4. Increment Factors (incrementFactor_1, incrementFactor_2, incrementFactor_3): Modulate the rate of change in MA lengths, adding variability.
5. Normalization Method (normalizeMethod): Standardizes deviations, with methods like 'Max-Min' and 'Absolute Sum' for comparability.

Stochastic Trend Evaluator (STE)Stochastic Trend Evaluator (STE): Detailed Description
Overview :
The Stochastic Trend Evaluator (STE) is a sophisticated trading tool designed for TradingView that combines stochastic oscillation analysis with Exponential Moving Average (EMA) trends. It is tailored to assist traders in identifying potential buy and sell opportunities in various market conditions, particularly focusing on trend reversals and momentum shifts.
Functionality & Concept :
The STE is built on two core components – the Stochastic Oscillator and the 200-period EMA.
Stochastic Oscillator :
This oscillator is a momentum indicator comparing a particular closing price of a security to a range of its prices over a certain period.
Settings:
- %K Length: 14
- %K Smoothing: 3
- %D Smoothing: 3
The %K line is the main line indicating momentum, while the %D line is a moving average of %K, providing signal triggers.
200 EMA :
The 200-period EMA serves as a dynamic trend indicator.
It helps in distinguishing between bullish and bearish market phases.
A closing price above the 200 EMA suggests a bullish trend, while below it indicates a bearish trend.
Signal Generation :
STE generates signals based on the interaction between the Stochastic Oscillator and the 200 EMA.
Buy Signal :
Occurs when the stochastic %K crosses above 20 (indicative of oversold conditions), and the closing price is above the 200 EMA.
Represented visually by green label-up arrows.
Sell Signal :
Triggered when the stochastic %K crosses below 80 (suggestive of overbought conditions), and the closing price is below the 200 EMA.
Indicated by red label-down arrows.
Background Color Indicator :
The background color of the chart changes to enhance visual interpretation of the market condition.
Green background for a bullish market scenario (when a buy signal is active).
Red background for a bearish market scenario (when a sell signal is active).
Usage Guidelines :
The STE is best used in markets that exhibit clear trends.
Ideal for traders focusing on medium to long-term trade setups.
Can be used in conjunction with other indicators for confirmation and risk management.
Note : The STE, being a proprietary tool, is based on a unique blend of standard technical analysis concepts and custom logic to provide these trading signals. It is designed to give traders a comprehensive view of the market momentum and trend strength without revealing the intricate details of its algorithm.

Triple Moving Averages (Gradient, Alarm & Multi TF)Triple Moving Averages
Features:
- 7 Different MA's (RMA, SMA, EMA, 'WMA', HMA, DEMA, EMA)
- Gradient coloring
- Multi timeframe
- Crossover alarm's and alarm delay function
- Forecasting (By removing the last bar in the MA period)
Moving Average to easely identify the trend and trend strength.
Gradient coloring and personal color preferences can be made.
Alert Delay System
When timing is essentially, this helps you get the alarm just in time.
Use it with the triggers ONLY ONCE PER BAR or ONLY ONCE. Then the alarm comes before the close, but you don't have to worry about it triggering just seconds after bar open :)
Default = 15m Recomended for 1h chart
Alarm's
Get the alarms before it's actually crossing or when it crosses
*This is not a selfmade indicator but simply merging from several indicators and added alert delay function and multi timeframe support
// Credits
- BigBitsIO Script : Scripting Tutorial 6 Triple Many Moving Averages Forecasting
- PineCoders Script : Color Gradient Framework PineCoders

Multi-Timeframe EMA Tracker by Ox_kaliThis script is an advanced trend analysis indicator crafted for traders who seek a detailed and customizable view of market trends across multiple timeframes. This tool utilizes exponential moving averages (EMAs) to offer insights into market direction and momentum.
Key Features:
Multi-Timeframe Analysis: MTEMA-Tracker covers a wide range of timeframes, including 1, 2, 3, 5, 10, 15, 30 minutes; 1, 2, 4, 6, 12 hours; 1 day; and 1 week. This allows traders to analyze market trends from various perspectives, from short-term fluctuations to longer-term movements.
EMA-Based Trend Determination: The indicator employs two EMAs (50 and 200 periods) for each timeframe to ascertain the market trend. A higher EMA50 compared to EMA200 indicates an uptrend, while the opposite scenario suggests a downtrend.
User-Defined Trend Colors: Traders can personalize the appearance of the trend lines with custom colors for upward and downward trends, enhancing visual clarity and quick interpretation.
Selectable Timeframe Display: MTEMA-Tracker by Ox_kali offers the flexibility to choose which timeframes to display, enabling traders to focus on the most relevant data for their trading strategy.
Average Trend Calculation: A unique feature of MTEMA-Tracker is its ability to compute the average trend across all selected timeframes, providing a holistic view of the market's general direction.
List of Parameters:
Color of the trend: Customizable color settings for both upward and downward trends.
Settings for the Lengths of the EMAs: Options to set the lengths of the short and long-term EMAs.
Display Options for Each Timeframe's EMA Trend: Ability to activate or deactivate the display of EMAs for each selected timeframe.
Indicators and Financial Name Label settings: To ensure maximum clarity and understanding of the displayed trends, users should not hesitate to use the function to display "indicators and financial name labels" in their settings. This feature will help in identifying the legends for each trend, making it easier to interpret the market direction for the selected timeframes.
Please note that the MTEMA-Tracker is not a guarantee of future market performance and should be used in conjunction with proper risk management. Always ensure that you have a thorough understanding of the indicator’s methodology and its limitations before making any investment decisions. Additionally, past performance is not indicative of future results.
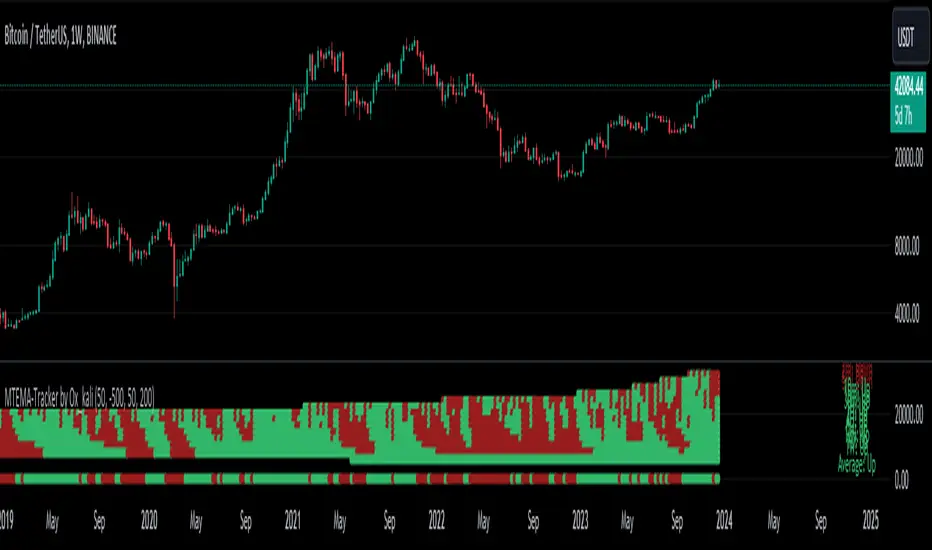
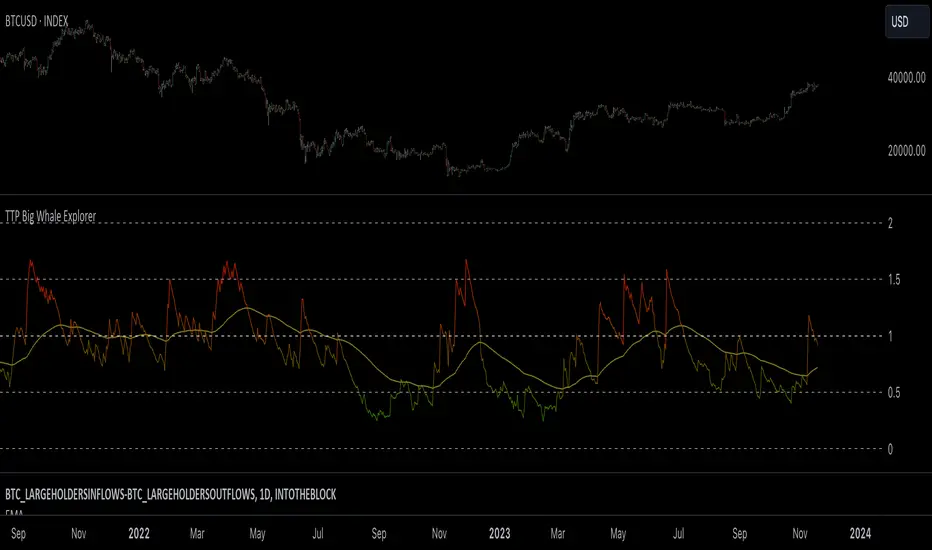
TTP Big Whale ExplorerThe Big Whale Explorer is an indicator that looks into the ratio of large wallets deposits vs withdrawals.
Whales tend to sale their holding when they transfer their holdings into exchanges and they tend to hold when they withdraw.
In this overlay indicator you'll be able to see in an oscillator format the moves of large wallets.
The moves above 1.5 turn into red symbolising that they are starting to distribute. This can eventually have an impact in the price by causing anything from a mild pullback to a considerable crash depending on how much is being actually sold into the market.
Moves below 0.5 mean that the large whales are heavily accumulating and withdrawing. During these periods price could still pullback or even crash but eventually the accumulation can take prices to new highs.
Instructions:
1) Load INDEX:BTCUSD or BNC:BLX to get the most historic data as possible
2) use the daily timeframe
3) load the indicator into the chart
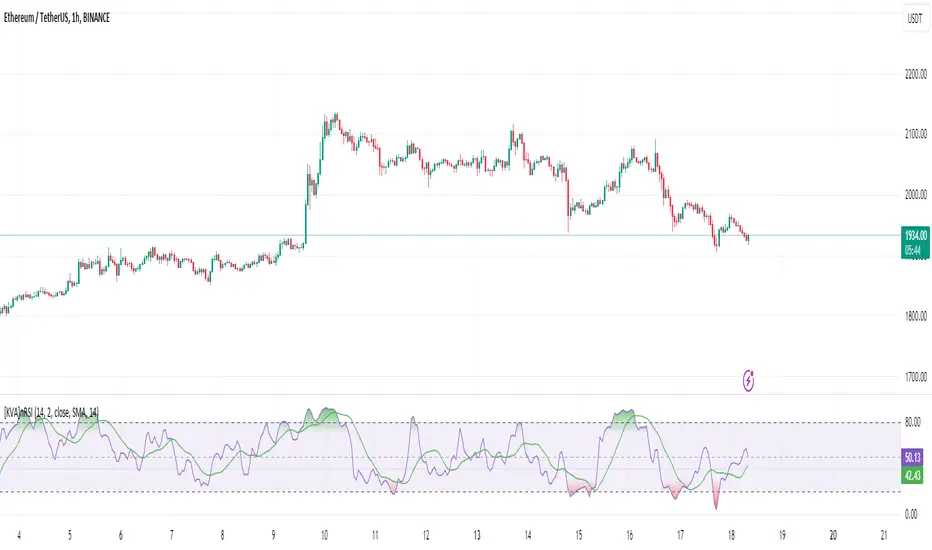
[KVA]nRSIThe nRSI stands as a groundbreaking enhancement of the traditional Relative Strength Index (RSI), specifically engineered for traders seeking a more refined and accurate tool in fast-moving markets.
Customizable Price Change Period (n): Unlike the traditional RSI which solely relies on a fixed period for average gains and losses, the nRSI introduces an additional parameter, n, to calculate price changes.
This adaptation focuses on minimizing market noise, sharpening the indicator's sensitivity to genuine trends and patterns.
Enhanced Signal Precision : By reducing the influence of short-term price spikes and fluctuations, the nRSI delivers a more precise signal. This precision is particularly crucial in volatile market conditions, where traditional indicators may be swayed by transient movements.
Ideal Usage
Strategic Trading Decisions : Ideal for traders who need to filter out insignificant price movements to make more strategic, informed trading decisions.
Reliable Divergence Spotting : Enhanced noise reduction aids in identifying more reliable divergences, key for predicting potential market reversals.
Trend Confirmation : The smoothed RSI, assisted by the moving average, becomes an invaluable tool for confirming the validity of market trends, minimizing false signals.
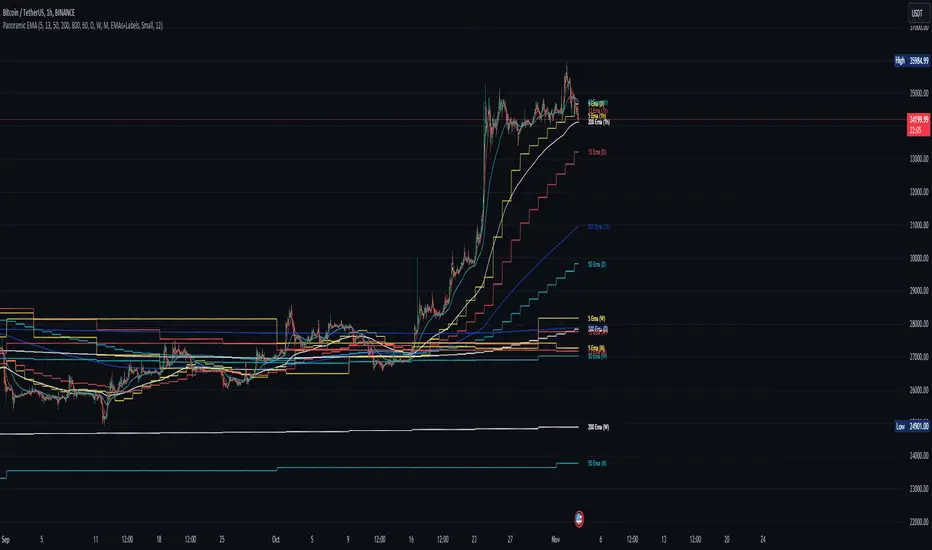
Panoramic EMA - Multi TimeframePanoramic EMA - Multi Timeframe
This indicator provides a straightforward visualization of Exponential Moving Averages (EMAs) from multiple timeframes simultaneously. This indicator allows traders to customize the display of EMAs, making it easier to identify and analyze trends and potential support or resistance levels across different periods.
Settings:
EMA Lengths: Customize up to five EMA lengths. Activating a length will display its EMA line on the chart for the selected timeframes.
Timeframes Selection: Choose up to four different timeframes to display the EMAs. This lets you observe how EMAs behave on various scales from a single chart.
Interpretation:
Utilize the EMAs as potential zones of dynamic support or resistance.
Observe the relationship between price action and EMAs across different timeframes to gauge market sentiment and identify trend consistency or potential shifts.
This tool is designed to offer visual clues about the market state through the behavior of EMAs. It does not generate direct buy or sell signals. It is recommended to understand how the assets you are trading interact with EMAs. For instance, in our example below, Bitcoin demonstrates a tendency to interact with the 800 and 200-length EMAs on the 4-hour timeframe, providing areas where price rejections may occur:
Note: This is a utility-focused indicator meant to supplement your market analysis and should be used in conjunction with other analysis methods or indicators for the best results.
Multi EMA/SMADescription:
This indicator combines both an Exponential Moving Average (EMA) and a Simple Moving Average (MA). The user can customize the lengths of both the EMA and the MA, as well as their respective colors and line widths.
Features:
Custom Lengths for EMA and MA: The user can specify the desired length for both the EMA and the MA.
Visibility Control: There are options to only display the MA and EMA during the times the price crosses them. This helps in highlighting significant crossover points. Additionally, the user can define how many bars before and after the crossover they wish to visualize the MA and EMA.
Customizable Appearance: The color and line width for both the MA and the EMA can be adjusted as per user preferences.
Dynamic Labels: The indicator provides labels that display the current values of the MA and the EMA. Additionally, these labels dynamically update to reflect any changes to the EMA or MA length input by the user.

Trend Pinbar PT49 by CuancuanIdea Behind:
Buying the short-term trend that shows a pin-bar candlestick pattern. Meant to be traded on a daily chart / higher timeframe.
To determine the short-term trend we use short EMA such as 8-16-30 and check the slope of each one, and definitely, the shorter one must be above the longer one for an uptrend. Vice versa for a downtrend.
To determine a pin-bar candlestick, I calculate that the body size (open to close) is at maximum a-third of the candle size (high to low). Besides that, I ensure that the close of the candle is above the shortest MA for bullish and below it for bearish.
As extra filters to reduce trade numbers:
1. Longer MA Filter = You can turn it off if you think the higher timeframe filter is unnecessary.
2. Slope Filter = To ensure the slope of the shorter MA is steeper rather than the mid-MA.
3. Size Filter = To check whether the overall candle size (high to low) is bigger than the ATR number. When the size filter is turned on, it removes small insignificant candles.
PS: Don't trade anything live unless you find it comfortable after backtesting it by yourself .

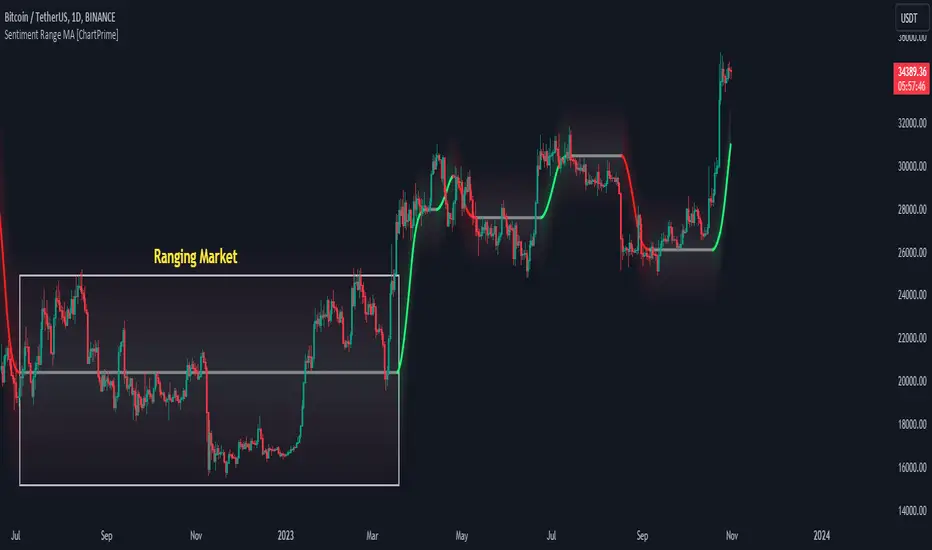
Sentiment Range MA [ChartPrime]The "Sentiment Range MA" provides traders with a dynamic perspective on market activity, emphasizing both stability in chop zones and quick adaptability outside of them.
Key Features:
Chop Zone Stability: In choppy markets, this indicator remains consistent, filtering out the noise to provide a clear view.
Quick Adaptability: Should the price break out of these zones, the indicator recalibrates promptly.
Dynamic Support and Resistance: Adapts based on the latest price action, serving as an evolving reference point.
Emphasis on Recent Levels: The tool factors in the latest notable market levels to stay relevant and timely.
Configurations:
Data Source: Choose your desired metric, though many default to the closing price.
Output Smoothing: Adjust the SR MA's response to market movements.
Trigger Smoothing: Refine boundary definitions based on your market insights.
ATR Period: Set the period for the ATR, influencing the surrounding boundary's width.
Range Multiplier: Control the ATR's effect on the range.
Range Switch: Flip between high-low and open-close values for range determination.
Visuals
Sentiment Range MA Line:
- This is the flowing line that transitions between green and red.
- When it's green, it indicates bullish momentum in the market. This suggests a prevailing upward trend and can be an entry cue for traders who trade with the trend.
- When it turns red, bearish sentiments dominate. It indicates the potential beginning of a downtrend or a continued downtrend. Traders might interpret this as a signal to be cautious, to short the market, or to exit long positions.
The Chop Zone:
- This is the space between the price candles and the Sentiment Range MA line. It represents a region where the price is considered to be moving sideways or without a clear direction. Price movements within the chop zone might not be substantial enough to warrant a trading decision. Only when the price breaks out of this zone do we see the Sentiment Range MA line change color, signaling a potential trading opportunity.
By interpreting these visuals, traders can make more informed decisions based on the prevailing market sentiment and trend. The chart becomes a tool, providing both an overview of the market condition and potential entry or exit points based on the Sentiment Range MA indicator's readings.
Detailed Settings Overview
Understanding the settings of the Sentiment Range MA Indicator can greatly enhance its utility in your trading strategy. Let's dive deeper into each:
Output Smoothing:
Purpose: It refines the SR MA to provide a clearer trend perspective.
Functionality:
- At `0`, it ensures the indicator responds immediately to price deviations from the chop zone.
- At higher values, it transforms the indicator into a volatility-adjusted moving average.
Filtering Modes:
- Single Filtering: Prioritizes speed.
- Double Filtering: Emphasizes stability.
Trigger Smoothing:
Purpose: Used for the range break detection.
Functionality: It dampens the indicator's sensitivity to sudden market volatility, preventing unnecessary triggers.
ATR Length:
Purpose: Governs the retrospective period for the chop zone.
Functionality:
- Higher values offer a more consistent and broad range size, capturing more historical data.
- Lower values allow for a more adaptive and responsive range.
Range Multiplier:
Purpose: Modifies the breadth of the range around the SR MA.
Functionality: Increasing the multiplier will extend the range, giving more leeway before triggering, while decreasing it will narrow the range, making the indicator more responsive to price changes.
Range Style:
Purpose: Decides which candlestick data is factored into the true range calculations.
Options:
- Body: Uses the open and close values.
- Wick: Accounts for the high and low values.
Functionality: Switching between styles lets you prioritize either the overall volatility (Wick) or just the concluded price action for a period (Body).
By fine-tuning these settings, traders can tailor the Sentiment Range MA Indicator to various market conditions and personal trading styles, ensuring optimal decision-making.
Quick Start
Based on the provided chart, here's a brief explanation of the default settings for the Sentiment Range MA Indicator:
Length: Set at ` 20 `.
- This determines the base moving average period. A standard setting, it calculates the average price over the last 20 periods, providing traders with a clear perspective of short-term trends.
ATR Length: Set at ` 200 `.
- This adjusts the lookback period for the Average True Range (ATR), which in turn influences the chop zone calculation. At a setting of 200, it offers a comprehensive view, considering a longer stretch of historical data.
Range Multiplier: Set at ` 6 `.
- This multiplies the ATR value, widening or narrowing the band around the SR MA. A setting of 6 means the range around the SR MA is determined by multiplying the ATR by 6, offering a broader fluctuation zone.
On the chart, the green line represents the bullish sentiment and the red represents the bearish sentiment. Price movements above and below these lines can be used as potential buy or sell signals respectively. Fine-tuning these settings can cater the Sentiment Range MA Indicator to your specific trading strategy and market condition preferences.
Alternative Settings
For traders looking to adapt to faster market conditions or prefer a more agile analysis, here's a brief description of the alternative settings for the Sentiment Range MA Indicator:
Length: Set at ` 3 `.
- This highly responsive setting calculates the average price over the last 3 periods. Ideal for quick market movements, it offers traders insights into very short-term price trends and potentially swift trade opportunities.
ATR Length: Set at ` 50 `.
- This shorter lookback period for the Average True Range (ATR) focuses on more recent market volatility, providing a tighter and more current chop zone calculation. It's suitable for those wanting to respond to recent market shifts.
Range Multiplier: Set at ` 4 `.
- Multiplying the ATR by 4 narrows down the buffer around the SR MA. This creates a tighter sentiment range, possibly resulting in more frequent crossovers and trading signals.
In the provided chart, the green line still denotes bullish momentum while the red symbolizes bearish sentiment. These alternative settings might generate more frequent signals, so traders should ensure their strategy is aligned with this heightened sensitivity.
Wrapping Up
The Sentiment Range MA melds stability and agility, making it a valuable tool in your trading toolkit. As always, before integrating new indicators, take the time to understand its nuances and potential impacts on your strategy.
Triple EMA By Ozy
**Triple EMA By Ozy**
The "Triple EMA By Ozy" is a visual indicator that offers traders a clear and concise view of three exponential moving averages (EMAs) at a glance. This tool combines three common EMAs (20, 50, and 200) and additionally calculates and displays the slope angle of each EMA, allowing for a more precise identification of the current trend's direction and strength.
**Key Features:**
1. **Three EMAs in One Indicator:** The 20, 50, and 200-period EMAs are popular among traders and are crucial for identifying short, medium, and long-term trends.
2. **Slope Angle:** The indicator calculates the slope angle for each EMA, which can be indicative of the trend's strength. A positive angle suggests bullish momentum, while a negative angle indicates bearish momentum.
3. **Clear Visual Indication:** The indicator uses colors to easily distinguish between EMAs and also to identify the direction of the slope angle (green for positive, red for negative).
**How to Use:**
- An increasing angle in the EMA20 may indicate the beginning of a new short-term upward trend.
- A decreasing angle in the EMA200 might signal a long-term downtrend gaining strength.
- Crosses between the EMAs can also be points of interest, like the golden cross (EMA50 crossing above the EMA200) or the death cross (EMA50 crossing below the EMA200).
**Triple EMA By Ozy**
El "Triple EMA By Ozy" es un indicador visual que proporciona a los traders una visión clara y concisa de tres medias móviles exponenciales (EMAs) en un solo vistazo. Esta herramienta combina tres EMAs comunes (20, 50 y 200) y, además, calcula y muestra el ángulo de inclinación de cada EMA para identificar con mayor precisión la dirección y la fuerza de la tendencia actual.
**Características principales:**
1. **Tres EMAs en un solo indicador:** Las EMAs de 20, 50 y 200 períodos son populares entre los traders y son esenciales para identificar tendencias a corto, mediano y largo plazo.
2. **Ángulo de inclinación:** El indicador calcula el ángulo de inclinación de cada EMA, que puede ser un indicativo de la fuerza de la tendencia. Un ángulo positivo sugiere un impulso alcista, mientras que un ángulo negativo indica un impulso bajista.
3. **Indicación visual clara:** El indicador utiliza colores para distinguir fácilmente entre EMAs y también para identificar la dirección del ángulo de inclinación (verde para positivo, rojo para negativo).
**Cómo usar:**
- Un ángulo creciente en la EMA20 puede indicar el comienzo de una nueva tendencia al alza a corto plazo.
- Un ángulo decreciente en la EMA200 puede ser una señal de una tendencia bajista a largo plazo que está ganando fuerza.
- Los cruces entre las EMAs también pueden ser puntos de interés, como el cruce dorado (EMA50 cruza por encima de la EMA200) o el cruce de la muerte (EMA50 cruza por debajo de la EMA200).
