Dekkapok Premium Prices and EMA360Overview:
The EMA360 Premium Levels indicator is designed to help traders identify key price levels above the EMA360 (Exponential Moving Average) on a daily timeframe. These levels, referred to as "premium levels" are calculated as multiples of the EMA360 and can act as potential resistance or support zones for price action analysis.
Features:
EMA360 Calculation:
The script calculates the EMA360 using the daily timeframe (or any user-specified timeframe).
EMA360 is plotted as a bold blue line for clear visibility.
Premium Levels:
Multiple levels above the EMA360 are plotted as horizontal green lines.
These levels are calculated by multiplying the EMA360 value by user-defined multipliers (e.g., 1.2x, 1.3x, etc.).
Premium levels can help identify overbought or extended price zones relative to EMA360.
Customizable Inputs:
EMA Length: Default is set to 360, but users can adjust the EMA length as needed.
Timeframe: EMA360 is calculated using the daily timeframe by default, but any timeframe can be selected.
Multipliers: Traders can input their desired multipliers (e.g., 1.2, 1.3, 1.5) as a comma-separated list.
Clean Visualization:
EMA360 and premium levels are plotted directly on the price chart for intuitive analysis.
Premium level lines are semi-transparent green to minimize clutter while maintaining focus on critical levels.
Use Cases:
Trend Analysis: Use the EMA360 to identify the broader market trend. Prices above the EMA360 generally indicate an uptrend, while prices below may indicate a downtrend.
Overextension Zones: Premium levels help traders identify zones where the price may be overbought or overextended relative to EMA360.
Dynamic Support/Resistance: The premium levels can act as dynamic resistance zones during uptrends and support zones during pullbacks.
How to Use:
Apply the indicator to your chart in TradingView.
Observe the EMA360 line to understand the market trend.
Use the green premium level lines to identify potential resistance zones as the price moves above the EMA360.
Customization Options:
Adjust the EMA Length and Timeframe to match your trading style.
Modify the Premium Multipliers to suit your market analysis needs (e.g., add or reduce levels like 1.1x, 1.8x, etc.).
This indicator is especially useful for trend-following traders who want to leverage EMA-based levels for strategic decision-making.
- Dekkapok
Rata-Rata Pergerakan Eksponensial / Exponential Moving Average (EMA)

Dekkapok Premium Prices and EMA360 [Clean Ver.]Overview:
The EMA360 Premium Levels indicator is designed to help traders identify key price levels above the EMA360 (Exponential Moving Average) on a daily timeframe. These levels, referred to as "premium levels" are calculated as multiples of the EMA360 and can act as potential resistance or support zones for price action analysis.
Features:
EMA360 Calculation:
The script calculates the EMA360 using the daily timeframe (or any user-specified timeframe).
EMA360 is plotted as a bold blue line for clear visibility.
Premium Levels:
Multiple levels above the EMA360 are plotted as horizontal green lines.
These levels are calculated by multiplying the EMA360 value by user-defined multipliers (e.g., 1.2x, 1.3x, etc.).
Premium levels can help identify overbought or extended price zones relative to EMA360.
Customizable Inputs:
EMA Length: Default is set to 360, but users can adjust the EMA length as needed.
Timeframe: EMA360 is calculated using the daily timeframe by default, but any timeframe can be selected.
Multipliers: Traders can input their desired multipliers (e.g., 1.2, 1.3, 1.5) as a comma-separated list.
Clean Visualization:
EMA360 and premium levels are plotted directly on the price chart for intuitive analysis.
Premium level lines are semi-transparent green to minimize clutter while maintaining focus on critical levels.
Use Cases:
Trend Analysis: Use the EMA360 to identify the broader market trend. Prices above the EMA360 generally indicate an uptrend, while prices below may indicate a downtrend.
Overextension Zones: Premium levels help traders identify zones where the price may be overbought or overextended relative to EMA360.
Dynamic Support/Resistance: The premium levels can act as dynamic resistance zones during uptrends and support zones during pullbacks.
How to Use:
Apply the indicator to your chart in TradingView.
Observe the EMA360 line to understand the market trend.
Use the green premium level lines to identify potential resistance zones as the price moves above the EMA360.
Customization Options:
Adjust the EMA Length and Timeframe to match your trading style.
Modify the Premium Multipliers to suit your market analysis needs (e.g., add or reduce levels like 1.1x, 1.8x, etc.).
This indicator is especially useful for trend-following traders who want to leverage EMA-based levels for strategic decision-making.
- Dekkapok

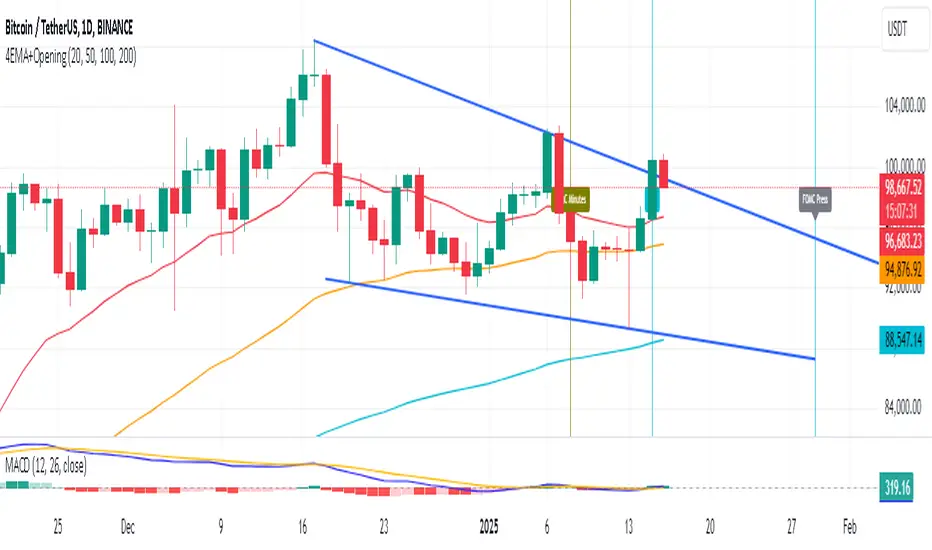
4EMAs+OpenHrs+FOMC+CPIThis script displays 4 custom EMAs of your choice based on the Pine script standard ema function.
Additionally the following events are shown
1. Opening hours for New York Stock exchange
2. Opening Time for London Stock exchange
3. US CPI Release Dates
4. FOMC press conference dates
5. FOMC meeting minutes release dates
I have currently added FOMC and CPI Dates for 2025 but will keep updating in January of every year (at least as long as I stay in the game :D)
BS | Buy&Sell Signals With EMAKey Features:
EMA Intersections: Generates clear buy and sell signals based on predefined EMA crossings.
5 EMA Lines: Visualize market trends with five distinct EMA lines plotted on the chart.
Support and Resistance Levels: Easily identify crucial support and resistance levels with our integrated marker.
Comprehensive Indicator Panel: At the bottom of the chart, track Stochastic, RSI, Supertrend, and SMA across multiple timeframes (1m, 5m, 15m, 1H, 4H, Daily, Weekly).
Fully Customizable: Almost every indicator within the tool is adjustable to suit your preferences and trading style.
Alarm Feature: Set up alarms to stay informed of important market movements.
Unlock the full potential of your trading strategy with BS | Buy&Sell Signals With EMA. Customize, analyze, and trade with confidence.
created by @bahadirsezer

Trading TimesThis script is based on the 9 and 20 EMA Strategy and combines Fibonacci Levels for added confluence.
When the price retests after breaking the EMAs, we take the trade in the same direction. That is on breakup, we take a long and on a breakdown we take a short.
VWAP can be enabled from settings for more data. institutions use it to average out their trades for both buy and sell orders.

HKM - Renko Emulator with EMA TrendThis is a Renko based Emulator to plot on any chart type which prints the box as printed on a Renko charts and is a Non-Repaint version. You can use either Traditional or ATR Method on current chart Timeframe. Option to plot an EMA Line is provided with Trend indication.

GocchiMulti-Indicator: RSI & Moving Averages
This versatile TradingView indicator combines two essential tools for technical analysis—Relative Strength Index (RSI) and Moving Averages (MAs)—into one comprehensive solution. It is designed for traders seeking flexibility, customization, and efficiency in their charting experience.
Features:
Relative Strength Index (RSI):
Customizable RSI length.
Adjustable overbought and oversold levels.
Selectable source input (e.g., close, open, high, low).
Visual levels for overbought and oversold zones, aiding in quick trend and momentum identification.
Three Moving Averages:
Three independently customizable moving averages.
Options for Simple Moving Average (SMA) or Exponential Moving Average (EMA) for each line.
Adjustable lengths for short-, medium-, and long-term trend tracking.
Visual Enhancements:
Clear, color-coded plots for RSI and each moving average.
Overbought and oversold zones are highlighted with horizontal dotted lines.
Alerts:
Get notified when RSI crosses above the overbought level or below the oversold level.
Alerts help traders stay on top of potential market reversals or breakout opportunities.
Use Cases:
RSI Analysis: Spot overbought or oversold conditions to identify potential reversals.
Trend Following: Use moving averages to confirm trends or identify crossovers for potential entry and exit points.
Custom Strategies: Tailor the settings to fit specific trading styles, such as scalping, swing trading, or long-term investing.
This all-in-one indicator streamlines your analysis by reducing the need for multiple overlays, making your charts cleaner and more actionable. Whether you're a novice or an experienced trader, this tool provides the flexibility and insights you need to succeed in any market condition.

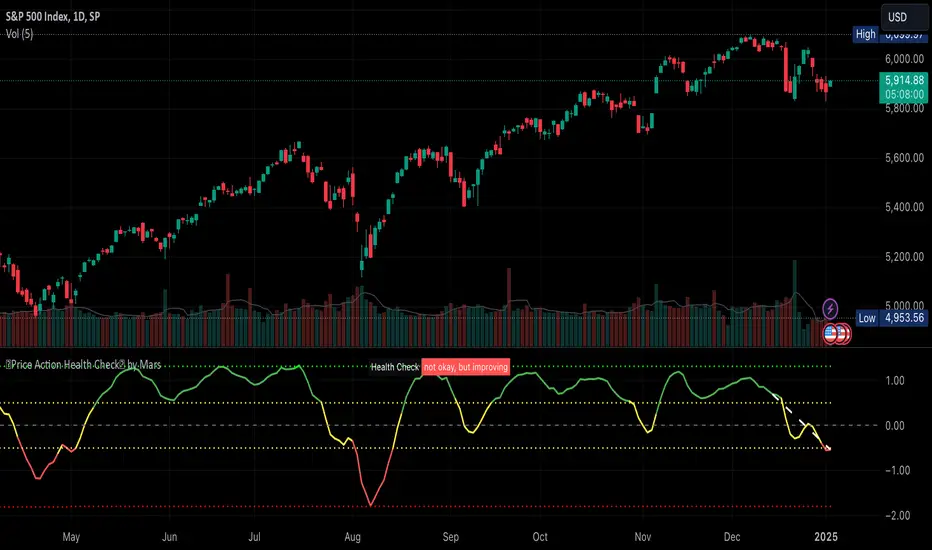
Price Action Health CheckThis is a price action indicator that measures market health by comparing EMAs, adapting automatically to different timeframes (Weekly/Daily more reliable) and providing context-aware health status.
Key features:
Automatically adjusts EMA periods based on timeframe
Measures price action health through EMA separation and historical context
Provides visual health status with clear improvement/deterioration signals
Projects a 13-period trend line for directional context
Trading applications:
Identify shifts in market health before major trend changes
Validate trend strength by comparing current readings to historical averages
Time entries/exits based on health status transitions
Filter trades using timeframe-specific health readings
I like to use it to keep SPX in check before deciding the market is going down.
Note: For optimal analysis, use primarily on Weekly and Daily timeframes where price action patterns are more significant.
UM VIX status table and Roll Yield with EMA
Description :
This oscillator indicator gives you a quick snapshot of VIX, VIX futures prices, and the related VIX roll yield at a glance. When the roll yield is greater than 0, The front-month VX1 future contract is less than the next-month VX2 contract. This is called Contango and is typical for the majority of the time. If the roll yield falls below zero. This is considered backwardation where the front-month VX1 contract is higher than the value of the next-month VX2 contract. Contango is most common. When Backwardation occurs, there is usually high volatility present.
Features :
The red and green fill indicate the current roll yield with the gray line being zero.
An Exponential moving average is overlaid on the roll yield. It is red when trending down and green when trending up. If you right-click the indicator, you can set alerts for roll yield EMA color transitions green to red or red to green.
Suggested uses:
The author suggests a one hour chart using the 55 period EMA with a 60 minute setting in the indicator. This gives you a visual idea of whether the roll yield is rising or falling. The roll yield will often change directions at market turning points. For example if the roll yield EMA changes from red to green, this indicates a rising roll yield and volatility is subsiding. This could be considered bullish. If the roll yield begins falling, this indicates volatility is rising. This may be negative for stocks and indexes.
I look for short volatility positions (SVIX) when the roll yield is rising. I look for long volatility positions (VXX, UVXY, UVIX) when the roll yield begins falling. The indicator can be added to any chart. I suggest using the VX1, SPY, VIX, or other major stock index.
Set the time frame to your trading style. The default is 60 minutes. Note, the timeframe of the indicator does NOT utilize the current chart timeframe, it must be set to the desired timeframe. I manually input text on the chart indicator for understanding periods of Long and Short Volatility.
Settings and Defaults
The EMA is set to 55 by default and the table location is set to the lower right. The default time frame is 60 minutes. These features are all user configurable.
Other considerations
Sometimes the Tradingview data when a VX contract expires and another contract begins, may not transition cleanly and appear as a break on the chart. Tradingview is working on this as stated from my last request. This VX contract from one expiring contract to the next can be fixed on the price chart manually: ( Chart settings, Symbol, check the "Adjust for contract changes" box)
Observations
Pull up a one-hour chart of VX1 or SPY. Add this indicator. roll it back in time to see how the market and volatility reacts when the EMA changes from red to green and green to red. Adjust the EMA to your trading style and time frame. Use this for added confirmation of your long and short volatility trades with the Volatility ETFs SVIX, SVXY, VXX, UVXY, UVIX. or use it for long/short indexes such as SPY.

Bitcoin Reversal PredictorOverview
This indicator displays two lines that, when they cross, signal a potential reversal in Bitcoin's price trend. Historically, the high or low of a bull market cycle often occurs near the moment these lines intersect. The lines consist of an Exponential Moving Average (EMA) and a logarithmic regression line fitted to all of Bitcoin's historical data.
Inspiration
The inspiration for this indicator came from the PI Cycle Top indicator, which has accurately predicted past bull market peaks. However, I believe the PI Cycle Top indicator may not be as effective in the future. In that indicator, two lines cross to mark the top, but the extent of the cross has been diminishing over time. This was especially noticeable in the 2021 cycle, where the lines barely crossed. Because of this, I created a new indicator that I think will continue to provide reliable reversal signals in the future.
How It Works
The logarithmic regression line is fitted to the Bitcoin (BTCUSD) chart using two key factors: the 'a' factor (slope) and the 'b' factor (intercept). This results in a steadily decreasing line. The EMA oscillates above and below this regression line. Each time the two lines cross, a vertical colored bar appears, indicating that Bitcoin's price momentum is likely to reverse.
Use Cases
- Price Bottoming:
Bitcoin often bottoms out when the EMA crosses below the logarithmic regression line.
- Price Topping:
In contrast, Bitcoin often peaks when the EMA crosses above the logarithmic regression line.
- Profitable Strategy:
Trading at the crossovers of these lines can be a profitable strategy, as these moments often signal significant price reversals.

Golden & Death Cross with Re-Activation [By Oberlunar]🎄 Merry Christmas to All Traders! 🎄
Let me introduce you to a practical and customizable classic tool: the Golden & Death Cross with Re-Activation. This script is designed to help you navigate the markets with precision and adaptability.
Why Is This Script Important?
1. Customizable Moving Averages
You can choose from SMA, EMA, WMA, HMA, or RMA for both moving averages. This flexibility allows you to tailor the strategy to fit different markets and trading styles.
2. Smart Signal Handling
The script generates Golden Cross (LONG) and Death Cross (SHORT) signals while deactivating them automatically when the moving averages start to converge, avoiding unnecessary noise.
3. Reactivation Based on Distance Threshold
With the treshold parameter, signals are reactivated only when the moving averages move apart sufficiently, ensuring that the signals remain meaningful and not just random market noise.
What Are These Moving Averages?
SMA (Simple Moving Average),
EMA (Exponential Moving Average),
WMA (Weighted Moving Average),
HMA (Hull Moving Average),
RMA (Relative Moving Average)
Community Input
We invite you to test this script on various markets (forex, stocks, crypto) and share your insights:
Which moving average combination works best for EUR/USD?
How about BTC/USD?
Does the treshold make a noticeable difference?
Let us know in the comments!
Example Settings
MA 1 Type: HMA, Length: 21
MA 2 Type: HMA, Length: 200
Reactivation Threshold: 0.5
Experiment with it, and let us know your findings.
Wishing you a calm holiday season and a profitable new year ahead! 🎁
🎄 Merry Christmas and Happy Trading! 🎄

RSI+EMA+MZONES with DivergencesFeatures:
1. RSI Calculation:
Uses user-defined periods to calculate the RSI and visualize momentum shifts.
Plots key RSI zones, including upper (overbought), lower (oversold), and middle levels.
2. EMA of RSI:
Includes an Exponential Moving Average (EMA) of the RSI for trend smoothing and confirmation.
3. Bullish and Bearish Divergences:
Detects Regular divergences (labeled as “Bull” and “Bear”) for classic signals.
Identifies Hidden divergences (labeled as “H Bull” and “H Bear”) for potential trend continuation opportunities.
4. Customizable Labels:
Displays divergence labels directly on the chart.
Labels can be toggled on or off for better chart visibility.
5. Alerts:
Predefined alerts for both regular and hidden divergences to notify users in real time.
6. Fully Customizable:
Adjust RSI period, lookback settings, divergence ranges, and visibility preferences.
Colors and styles are easily configurable to match your trading style.
How to Use:
RSI Zones: Use RSI and its zones to identify overbought/oversold conditions.
EMA: Look for crossovers or confluence with divergences for confirmation.
Divergences: Monitor for “Bull,” “Bear,” “H Bull,” or “H Bear” labels to spot key reversal or continuation signals.
Alerts: Set alerts to be notified of divergence opportunities without constant chart monitoring.

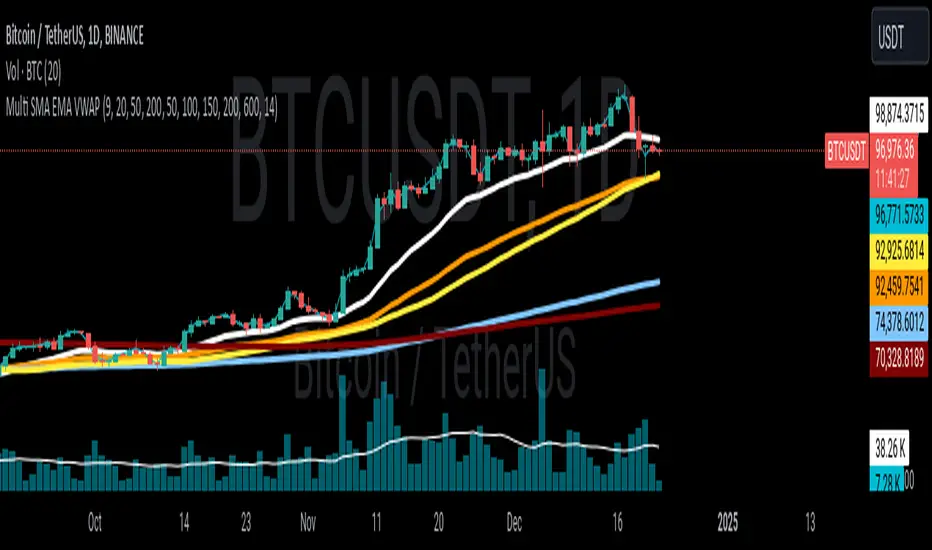
Multi SMA EMA VWAP1. Moving Average Crossover
This is one of the most common strategies with moving averages, and it involves observing crossovers between EMAs and SMAs to determine buy or sell signals.
Buy signal: When a faster EMA (like a short-term EMA) crosses above a slower SMA, it can indicate a potential upward movement.
Sell signal: When a faster EMA crosses below a slower SMA, it can indicate a potential downward movement.
With 4 EMAs and 5 SMAs, you can set up crossovers between different combinations, such as:
EMA(9) crosses above SMA(50) → buy.
EMA(9) crosses below SMA(50) → sell.
2. Divergence Confirmation Between EMAs and SMAs
Divergence between the EMAs and SMAs can offer additional confirmation. If the EMAs are pointing in one direction and the SMAs are still in the opposite direction, it is a sign that the movement could be stronger and continue in the same direction.
Positive divergence: If the EMAs are making new highs while the SMAs are still below, it could be a sign that the market is in a strong trend.
Negative divergence: If the EMAs are making new lows and the SMAs are still above, you might consider that the market is in a downtrend or correction.
3. Using EMAs as Dynamic Support and Resistance
EMAs can act as dynamic support and resistance in strong trends. If the price approaches a faster EMA from above and doesn’t break it, it could be a good entry point for a long position (buy). If the price approaches a slower EMA from below and doesn't break it, it could be a good point to sell (short).
Buy: If the price is above all EMAs and approaches the fastest EMA (e.g., EMA(9)), it could be a good buy point if the price bounces upward.
Sell: If the price is below all EMAs and approaches the fastest EMA, it could be a good sell point if the price bounces downward.
4. Combining SMAs and EMAs to Filter Signals
SMAs can serve as a trend filter to avoid trading in sideways markets. For example:
Bullish trend condition: If the longer-term SMAs (such as SMA(100) or SMA(200)) are below the price, and the shorter EMAs are aligned upward, you can look for buy signals.
Bearish trend condition: If the longer-term SMAs are above the price and the shorter EMAs are aligned downward, you can look for sell signals.
5. Consolidation Zone Between EMAs and SMAs
When the price moves between EMAs and SMAs without a clear trend (consolidation zone), you can expect a breakout. In this case, you can use the EMAs and SMAs to identify the direction of the breakout:
If the price is in a narrow range between the EMAs and SMAs and then breaks above the fastest EMA, it’s a sign that an upward trend may begin.
If the price breaks below the fastest EMA, it could indicate a potential downward trend.
6. "Golden Cross" and "Death Cross" Strategy
These are classic strategies based on crossovers between moving averages of different periods.
Golden Cross: Occurs when a faster EMA (e.g., EMA(50)) crosses above a slower SMA (e.g., SMA(200)), which suggests a potential bullish trend.
Death Cross: Occurs when a faster EMA crosses below a slower SMA, which suggests a potential bearish trend.
Additional Recommendations:
Combining with other indicators: You can combine EMA and SMA signals with other indicators like the RSI (Relative Strength Index) or MACD (Moving Average Convergence/Divergence) for confirmation and to avoid false signals.
Risk management: Always use stop-loss and take-profit orders to protect your capital. Moving averages are trend-following indicators but don’t guarantee that the price will move in the same direction.
Timeframe analysis: It’s recommended to use different timeframes to confirm the trend (e.g., use EMAs on hourly charts along with SMAs on daily charts).
VWAP
1. VWAP + EMAs for Trend Confirmation
VWAP can act as a trend filter, confirming the direction provided by the EMAs.
Buy Signal: If the price is above the VWAP and the EMAs are aligned in an uptrend (e.g., short-term EMAs are above longer-term EMAs), this indicates that the trend is bullish and you can look for buy opportunities.
Sell Signal: If the price is below the VWAP and the EMAs are aligned in a downtrend (e.g., short-term EMAs are below longer-term EMAs), this suggests a bearish trend and you can look for sell opportunities.
In this case, VWAP is used to confirm the overall trend. For example:
Bullish: Price above VWAP, EMAs aligned to the upside (e.g., EMA(9) > EMA(50) > EMA(200)), buy.
Bearish: Price below VWAP, EMAs aligned to the downside (e.g., EMA(9) < EMA(50) < EMA(200)), sell.
2. VWAP as Dynamic Support and Resistance
VWAP can act as a dynamic support or resistance level during the day. Combining this with EMAs and SMAs helps you refine your entry and exit points.
Support: If the price is above VWAP and starts pulling back to VWAP, it could act as support. If the price bounces off the VWAP and aligns with bullish EMAs (e.g., EMA(9) crossing above EMA(50)), you can consider entering a buy position.
Resistance: If the price is below VWAP and approaches VWAP from below, it can act as resistance. If the price fails to break through VWAP and aligns with bearish EMAs (e.g., EMA(9) crossing below EMA(50)), it could be a good signal for a sell.
Trend Battery [Phantom]Trend Battery
Visualize Trend Strength with a Dynamic EMA Power Gauge
OVERVIEW
The Trend Battery indicator offers a clear, visual representation of trend strength based on the alignment of multiple Exponential Moving Averages (EMAs). It assigns a color-coded score to each bar, helping traders quickly assess the prevailing trend's power and direction.
CONCEPT
• Trend Strength Using EMAs: The indicator analyzes the alignment of 20 EMAs (8 to 200 periods) to gauge trend strength. The more EMAs align, the stronger the trend.
• Gradient-Based Visualization: Scores are mapped to a color gradient, transitioning from green (bullish) to purple (bearish), providing an intuitive visual representation of trend momentum.
HOW IT WORKS
Trend Battery calculates 20 EMAs and evaluates their alignment. When EMAs align in a strong trend, the bar colors change (as displayed in battery color key on chart) displaying a spectrum of colors from bright green (strong uptrend) to deep purple (strong downtrend).
• Dynamic Bar Colors:
o Green hues: Strong bullish trends.
o Purple hues: Strong bearish trends.
o Red hues: Weaker trends or potential transitions.
FEATURES
• Dynamic Color Coding: Easy-to-read and instantly assess trend.
• Customizable Transparency: Adjust bar color opacity to your preference.
• Optional EMA Display: Toggle individual EMA lines on/off for additional context.
• Compact Battery View: Quick reference table displaying the gradient color mapping.
SETTINGS
• Transparency: Controls the opacity of bar colors.
• Show EMAs on Chart: Enables/disables plotting of EMA lines.
USAGE
• Identify trend strength and direction.
• Confirm trend reversals or continuations.
• Complement other indicators and strategies.
• Monitor multi-timeframe trends.
TRADE IDEAS:
• For larger timeframes purple hues can be used for accumulating and green hues for distribution.
• For smaller timeframes, color transitions could be a signal for trend reversal, or corrections.
• It is a good idea to use larger timeframes for overall trend directions, and smaller timeframes for entries.
LIMITATIONS
• Lagging Indicator: As the Trend Battery relies on Exponential Moving Averages (EMAs), it is inherently a lagging indicator. This means it reflects past price action and may not always provide timely signals for rapid market changes or sudden reversals.
• False Signals in Sideways Markets: In ranging or consolidating markets, the indicator may produce mixed signals (frequent color changes) as EMAs intertwine without a clear trend. This can lead to false interpretations if not considered alongside other market context indicators.
• Not a Standalone System: The Trend Battery is designed to be a visual aid and should not be used as the sole basis for trading decisions. It's most effective when combined with other technical analysis tools, such as oscillators, support/resistance levels, and fundamental analysis.
DISCLAIMER
Use the Trend Battery indicator in conjunction with other forms of analysis and risk management. Past performance is not indicative of future results.

Austin MTF EMA Entry PointsAustin MTF EMA Entry Points
Overview
The Austin MTF EMA Entry Points is a custom TradingView indicator designed to assist traders in identifying high-probability entry points by combining multiple time frame (MTF) analysis. It leverages exponential moving averages (EMAs) from the daily, 1-hour, and 15-minute charts to generate buy and sell signals that align with the overall trend.
This indicator is ideal for traders who:
Want to trade in the direction of the broader daily trend.
Seek precise entry points on lower time frames (1H and 15M).
Prefer using EMAs as their main trend-following tool.
How It Works
Daily Trend Filter:
The indicator calculates the 50 EMA on the daily chart.
The daily EMA acts as the primary trend filter:
If the current price is above the daily 50 EMA, the trend is bullish.
If the current price is below the daily 50 EMA, the trend is bearish.
Lower Time Frame Entry Points:
The indicator calculates the 20 EMA on both the 1-hour (1H) and 15-minute (15M) time frames.
Buy and sell signals are generated when the price aligns with the trend on all three time frames:
Buy Signal: Price is above the daily 50 EMA and also above the 20 EMA on both the 1H and 15M charts.
Sell Signal: Price is below the daily 50 EMA and also below the 20 EMA on both the 1H and 15M charts.
Visual and Alert Features:
Plot Lines:
The daily 50 EMA is plotted in yellow for easy identification of the main trend.
The 20 EMA from the 1H chart is plotted in blue, and the 15M chart's EMA is in purple for comparison.
Buy/Sell Markers:
Green "Up" arrows appear for buy signals.
Red "Down" arrows appear for sell signals.
Alerts:
Alerts notify users when a buy or sell signal is triggered, making it easier to act on trading opportunities in real-time.
How to Use the Indicator
Identify the Main Trend:
Check the relationship between the price and the daily 50 EMA (yellow line):
Only look for buy signals if the price is above the daily 50 EMA.
Only look for sell signals if the price is below the daily 50 EMA.
Wait for Lower Time Frame Alignment:
For a valid signal, ensure that the price is also above or below the 20 EMA (blue and purple lines) on both the 1H and 15M time frames:
This alignment confirms short-term momentum in the same direction as the daily trend.
Act on Signals:
Use the arrows as visual cues for entry points:
Enter long trades on green "Up" arrows.
Enter short trades on red "Down" arrows.
The alerts will notify you of these signals, so you don’t have to monitor the chart constantly.
Exit Strategy:
Use your preferred stop-loss, take-profit, or trailing stop strategy.
You can also exit trades if the price crosses back below/above the daily 50 EMA, signaling a potential reversal.
Use Cases
Swing Traders: Use the daily trend filter to trade in the direction of the dominant trend, while using 1H and 15M signals to fine-tune entries.
Day Traders: Leverage the 1H and 15M time frames to capitalize on short-term momentum while respecting the broader daily trend.
Position Traders: Monitor the indicator to determine potential reversals or significant alignment across time frames.
Customizable Inputs
The indicator includes the following inputs:
Daily EMA Length: Default is 50. Adjust this to change the length of the trend filter EMA.
Lower Time Frame EMA Length: Default is 20. Adjust this to change the short-term EMA for the 1H and 15M charts.
Time Frames: Hardcoded to "D", "60", and "15", but you can modify the script for different time frames if needed.
Example Scenarios
Buy Signal:
Price is above the daily 50 EMA.
Price crosses above the 20 EMA on both the 1H and 15M time frames.
A green "Up" arrow is displayed, and an alert is triggered.
Sell Signal:
Price is below the daily 50 EMA.
Price crosses below the 20 EMA on both the 1H and 15M time frames.
A red "Down" arrow is displayed, and an alert is triggered.
Strengths and Limitations
Strengths:
Aligns trades with the higher time frame trend for increased probability.
Uses multiple time frame analysis to identify precise entry points.
Visual signals and alerts make it easy to use in real-time.
Limitations:
May produce fewer signals in choppy or ranging markets.
Requires discipline to avoid overtrading when conditions are unclear.
Lag in EMAs could result in late entries in fast-moving markets.
Final Notes
The Austin MTF EMA Entry Points indicator is a powerful tool for traders who value multiple time frame alignment and trend-following strategies. While it simplifies decision-making, it is always recommended to backtest and practice proper risk management before using it in live markets.
Try it out and make smarter, trend-aligned trades today! 🚀

Smart DCA Strategy (Public)INSPIRATION
While Dollar Cost Averaging (DCA) is a popular and stress-free investment approach, I noticed an opportunity for enhancement. Standard DCA involves buying consistently, regardless of market conditions, which can sometimes mean missing out on optimal investment opportunities. This led me to develop the Smart DCA Strategy – a 'set and forget' method like traditional DCA, but with an intelligent twist to boost its effectiveness.
The goal was to build something more profitable than a standard DCA strategy so it was equally important that this indicator could backtest its own results in an A/B test manner against the regular DCA strategy.
WHY IS IT SMART?
The key to this strategy is its dynamic approach: buying aggressively when the market shows signs of being oversold, and sitting on the sidelines when it's not. This approach aims to optimize entry points, enhancing the potential for better returns while maintaining the simplicity and low stress of DCA.
WHAT THIS STRATEGY IS, AND IS NOT
This is an investment style strategy. It is designed to improve upon the common standard DCA investment strategy. It is therefore NOT a day trading strategy. Feel free to experiment with various timeframes, but it was designed to be used on a daily timeframe and that's how I recommend it to be used.
You may also go months without any buy signals during bull markets, but remember that is exactly the point of the strategy - to keep your buying power on the sidelines until the markets have significantly pulled back. You need to be patient and trust in the historical backtesting you have performed.
HOW IT WORKS
The Smart DCA Strategy leverages a creative approach to using Moving Averages to identify the most opportune moments to buy. A trigger occurs when a daily candle, in its entirety including the high wick, closes below the threshold line or box plotted on the chart. The indicator is designed to facilitate both backtesting and live trading.
HOW TO USE
Settings:
The input parameters for tuning have been intentionally simplified in an effort to prevent users falling into the overfitting trap.
The main control is the Buying strictness scale setting. Setting this to a lower value will provide more buying days (less strict) while higher values mean less buying days (more strict). In my testing I've found level 9 to provide good all round results.
Validation days is a setting to prevent triggering entries until the asset has spent a given number of days (candles) in the overbought state. Increasing this makes entries stricter. I've found 0 to give the best results across most assets.
In the backtest settings you can also configure how much to buy for each day an entry triggers. Blind buy size is the amount you would buy every day in a standard DCA strategy. Smart buy size is the amount you would buy each day a Smart DCA entry is triggered.
You can also experiment with backtesting your strategy over different historical datasets by using the Start date and End date settings. The results table will not calculate for any trades outside what you've set in the date range settings.
Backtesting:
When backtesting you should use the results table on the top right to tune and optimise the results of your strategy. As with all backtests, be careful to avoid overfitting the parameters. It's better to have a setup which works well across many currencies and historical periods than a setup which is excellent on one dataset but bad on most others. This gives a much higher probability that it will be effective when you move to live trading.
The results table provides a clear visual representation as to which strategy, standard or smart, is more profitable for the given dataset. You will notice the columns are dynamically coloured red and green. Their colour changes based on which strategy is more profitable in the A/B style backtest - green wins, red loses. The key metrics to focus on are GOA (Gain on Account) and Avg Cost.
Live Trading:
After you've finished backtesting you can proceed with configuring your alerts for live trading.
But first, you need to estimate the amount you should buy on each Smart DCA entry. We can use the Total invested row in the results table to calculate this. Assuming we're looking to trade on
BTCUSD
Decide how much USD you would spend each day to buy BTC if you were using a standard DCA strategy. Lets say that is $5 per day
Enter that USD amount in the Blind buy size settings box
Check the Blind Buy column in the results table. If we set the backtest date range to the last 10 years, we would expect the amount spent on blind buys over 10 years to be $18,250 given $5 each day
Next we need to tweak the value of the Smart buy size parameter in setting to get it as close as we can to the Total Invested amount for Blind Buy
By following this approach it means we will invest roughly the same amount into our Smart DCA strategy as we would have into a standard DCA strategy over any given time period.
After you have calculated the Smart buy size, you can go ahead and set up alerts on Smart DCA buy triggers.
BOT AUTOMATION
In an effort to maintain the 'set and forget' stress-free benefits of a standard DCA strategy, I have set my personal Smart DCA Strategy up to be automated. The bot runs on AWS and I have a fully functional project for the bot on my GitHub account. Just reach out if you would like me to point you towards it. You can also hook this into any other 3rd party trade automation system of your choice using the pre-configured alerts within the indicator.
PLANNED FUTURE DEVELOPMENTS
Currently this is purely an accumulation strategy. It does not have any sell signals right now but I have ideas on how I will build upon it to incorporate an algorithm for selling. The strategy should gradually offload profits in bull markets which generates more USD which gives more buying power to rinse and repeat the same process in the next cycle only with a bigger starting capital. Watch this space!
MARKETS
Crypto:
This strategy has been specifically built to work on the crypto markets. It has been developed, backtested and tuned against crypto markets and I personally only run it on crypto markets to accumulate more of the coins I believe in for the long term. In the section below I will provide some backtest results from some of the top crypto assets.
Stocks:
I've found it is generally more profitable than a standard DCA strategy on the majority of stocks, however the results proved to be a lot more impressive on crypto. This is mainly due to the volatility and cycles found in crypto markets. The strategy makes its profits from capitalising on pullbacks in price. Good stocks on the other hand tend to move up and to the right with less significant pullbacks, therefore giving this strategy less opportunity to flourish.
Forex:
As this is an accumulation style investment strategy, I do not recommend that you use it to trade Forex.
For more info about this strategy including backtest results, please see the full description on the invite only version of this strategy named "Smart DCA Strategy"

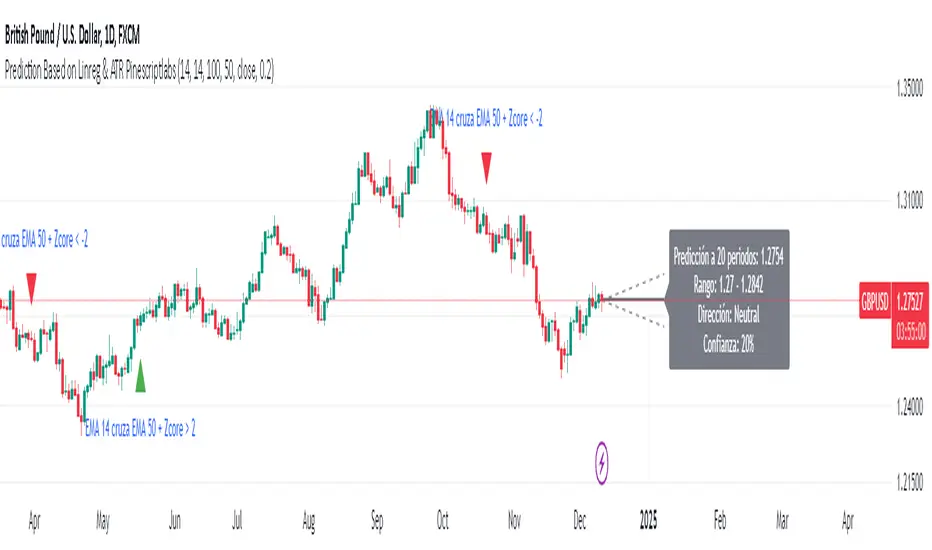
Prediction Based on Linreg & Atr
We created this algorithm with the goal of predicting future prices 📊, specifically where the value of any asset will go in the next 20 periods ⏳. It uses linear regression based on past prices, calculating a slope and an intercept to forecast future behavior 🔮. This prediction is then adjusted according to market volatility, measured by the ATR 📉, and the direction of trend signals, which are based on the MACD and moving averages 📈.
How Does the Linreg & ATR Prediction Work?
1. Trend Calculation and Signals:
o Technical Indicators: We use short- and long-term exponential moving averages (EMA), RSI, MACD, and Bollinger Bands 📊 to assess market direction and sentiment (not visually presented in the script).
o Calculation Functions: These include functions to calculate slope, average, intercept, standard deviation, and Pearson's R, which are crucial for regression analysis 📉.
2. Predicting Future Prices:
o Linear Regression: The algorithm calculates the slope, average, and intercept of past prices to create a regression channel 📈, helping to predict the range of future prices 🔮.
o Standard Deviation and Pearson's R: These metrics determine the strength of the regression 🔍.
3. Adjusting the Prediction:
o The predicted value is adjusted by considering market volatility (ATR 📉) and the direction of trend signals 🔮, ensuring that the prediction is aligned with the current market environment 🌍.
4. Visualization:
o Prediction Lines and Bands: The algorithm plots lines that display the predicted future price along with a prediction range (upper and lower bounds) 📉📈.
5. EMA Cross Signals:
o EMA Conditions and Total Score: A bullish crossover signal is generated when the total score is positive and the short EMA crosses above the long EMA 📈. A bearish crossover signal is generated when the total score is negative and the short EMA crosses below the long EMA 📉.
6. Additional Considerations:
o Multi-Timeframe Regression Channel: The script calculates regression channels for different timeframes (5m, 15m, 30m, 4h) ⏳, helping determine the overall market direction 📊 (not visually presented).
Confidence Interpretation:
• High Confidence (close to 100%): Indicates strong alignment between timeframes with a clear trend (bullish or bearish) 🔥.
• Low Confidence (close to 0%): Shows disagreement or weak signals between timeframes ⚠️.
Confidence complements the interpretation of the prediction range and expected direction 🔮, aiding in decision-making for market entry or exit 🚀.
Español
Creamos este algoritmo con el objetivo de predecir los precios futuros 📊, específicamente hacia dónde irá el valor de cualquier activo en los próximos 20 períodos ⏳. Utiliza regresión lineal basada en los precios pasados, calculando una pendiente y una intersección para prever el comportamiento futuro 🔮. Esta predicción se ajusta según la volatilidad del mercado, medida por el ATR 📉, y la dirección de las señales de tendencia, que se basan en el MACD y las medias móviles 📈.
¿Cómo Funciona la Predicción con Linreg & ATR?
Cálculo de Tendencias y Señales:
Indicadores Técnicos: Usamos medias móviles exponenciales (EMA) a corto y largo plazo, RSI, MACD y Bandas de Bollinger 📊 para evaluar la dirección y el sentimiento del mercado (no presentados visualmente en el script).
Funciones de Cálculo: Incluye funciones para calcular pendiente, media, intersección, desviación estándar y el coeficiente de correlación de Pearson, esenciales para el análisis de regresión 📉.
Predicción de Precios Futuros:
Regresión Lineal: El algoritmo calcula la pendiente, la media y la intersección de los precios pasados para crear un canal de regresión 📈, ayudando a predecir el rango de precios futuros 🔮.
Desviación Estándar y Pearson's R: Estas métricas determinan la fuerza de la regresión 🔍.
Ajuste de la Predicción:
El valor predicho se ajusta considerando la volatilidad del mercado (ATR 📉) y la dirección de las señales de tendencia 🔮, asegurando que la predicción esté alineada con el entorno actual del mercado 🌍.
Visualización:
Líneas y Bandas de Predicción: El algoritmo traza líneas que muestran el precio futuro predicho, junto con un rango de predicción (límites superior e inferior) 📉📈.
Señales de Cruce de EMAs:
Condiciones de EMAs y Puntaje Total: Se genera una señal de cruce alcista cuando el puntaje total es positivo y la EMA corta cruza por encima de la EMA larga 📈. Se genera una señal de cruce bajista cuando el puntaje total es negativo y la EMA corta cruza por debajo de la EMA larga 📉.
Consideraciones Adicionales:
Canal de Regresión Multi-Timeframe: El script calcula canales de regresión para diferentes marcos de tiempo (5m, 15m, 30m, 4h) ⏳, ayudando a determinar la dirección general del mercado 📊 (no presentado visualmente).
Interpretación de la Confianza:
Alta Confianza (cerca del 100%): Indica una fuerte alineación entre los marcos temporales con una tendencia clara (alcista o bajista) 🔥.
Baja Confianza (cerca del 0%): Muestra desacuerdo o señales débiles entre los marcos temporales ⚠️.
La confianza complementa la interpretación del rango de predicción y la dirección esperada 🔮, ayudando en las decisiones de entrada o salida en el mercado 🚀.
Gauti Market Maker Killzone EMA1. Identifying the Trend
Use Daily (1D) and Hourly (1H) Exponential Moving Averages (EMAs) to define the overall trend:
Bullish Trend: Both 1D and 1H EMAs are upward sloping, and the price is above these EMAs.
Bearish Trend: Both 1D and 1H EMAs are downward sloping, and the price is below these EMAs.
2. Confirmation with Higher Timeframes
Bullish Conditions:
Check 1D and 4H charts for price action above the EMA bands.
Look for price forming higher highs and higher lows or respecting support at the EMA bands.
Bearish Conditions:
Check 1D and 4H charts for price action below the EMA bands.
Look for price forming lower highs and lower lows or respecting resistance at the EMA bands.
Note: Crossover of EMAs on higher timeframes is an optional extra confirmation, but not mandatory for entry.
3. Entry Strategy
Use the 15-Minute (15M) timeframe for entries.
Entries are taken only during Killzones:
Killzones: London Open, New York Open, or other intraday key trading sessions. (Define the time ranges for these zones based on your trading hours.)
Wait for the price to touch or pull back to the EMA band during the Killzones in the direction of the overall trend:
In a bullish trend, enter long when the price touches the EMA band and shows signs of rejection or reversal.
In a bearish trend, enter short when the price touches the EMA band and shows signs of rejection or reversal.
4. Checklist for Entry
Confirm the following before entering:
1D Trend aligns with the 1H Trend.
Price Action in 1D and 4H supports the trend.
Killzone session is active.
Price is reacting to the EMA band on the 15M chart in the trend direction.

Smoothed Source Weighted EMAThe Smoothed Source EMA is a tool designed to help traders identify potential buying and selling opportunities in the market. It combines two key elements: price smoothing (using standard deviation) and an Exponential Moving Average (EMA). The purpose is to filter out the day-to-day price fluctuations and create clearer buy and sell signals.
Key Concepts Behind the Indicator:
Price Smoothing (Standard Deviation):
To make the price action easier to follow, the indicator first "smooths" the price. This is done by looking at how much the price tends to move up and down (known as standard deviation).
It then creates two "bands" around the current price—one above and one below. These bands represent a smoothed version of the price and help filter out the noise caused by small, random price movements.
Exponential Moving Average (EMA):
The indicator also uses an Exponential Moving Average (EMA), which is a line that represents the average price over a certain period of time (but gives more weight to recent prices). The EMA helps capture the general trend of the price.
The indicator uses this EMA to compare the current price with the overall trend.
How Does the Indicator Work?
Once the indicator calculates the smoothed price bands and the EMA, it looks for specific conditions to trigger a buy or sell signal:
Long (Buy) Signal:
A buy signal happens when the smoothed price (the lower band) is above the EMA. In simple terms, the price is moving up, and the indicator is telling you it's a good time to buy.
The more "weight" or influence you give to the EMA, the slower this buy signal will appear, meaning it’ll only trigger when there’s a strong enough upward movement.
Short (Sell) Signal:
A sell signal occurs when the smoothed price (the upper band) is below the EMA. This suggests the price is moving down, and the indicator signals that it might be time to sell.
Again, the more "weight" you put on the EMA, the slower the sell signal will appear, as the indicator waits for a clearer downtrend.
Why is this Useful for Traders?
Smoothing the Price: Many traders struggle with the noise of price fluctuations, where the price moves up and down quickly without a clear trend. By smoothing the price, this indicator helps traders focus on the bigger picture and avoid reacting to every small movement.
Clear Buy and Sell Signals: The indicator generates easy-to-understand buy and sell signals based on the relationship between the smoothed price and the EMA. If the price is above the smoothed level and EMA, it’s a signal to buy. If it’s below, it’s a signal to sell.
Customizable Sensitivity: The indicator lets traders adjust how sensitive the buy and sell signals are. By changing certain settings, such as the smoothing length and the weight of the EMA, traders can make the indicator react faster or slower depending on how quickly they want to catch changes in the market.
How the Indicator Appears on the Chart:
EMA Line: A line that represents the trend of the price.
Upper and Lower Smoothed Bands: Two bands above and below the price that help identify when the price is moving up or down relative to the trend.
Buy and Sell Arrows: Small arrows on the chart show where the indicator suggests buying or selling.
Colored Bars: The bars on the chart may change color to visually indicate whether the indicator suggests a buy (green) or a sell (red).
In Summary:
The Smoothed Source EMA helps you identify trends by smoothing out price movements using standard deviation, then comparing these smoothed prices with the Exponential Moving Average (EMA).
When the smoothed price moves above or below the EMA, it gives you a signal: a buy when the smoothed price is above the EMA, and a sell when it’s below.
You can adjust how quickly or slowly these signals appear by modifying the settings, giving you control over how sensitive the indicator is to changes in the market.
This indicator is useful for traders who want to reduce noise and focus on the overall trend, using clear, visually simple signals to guide their trading decisions.

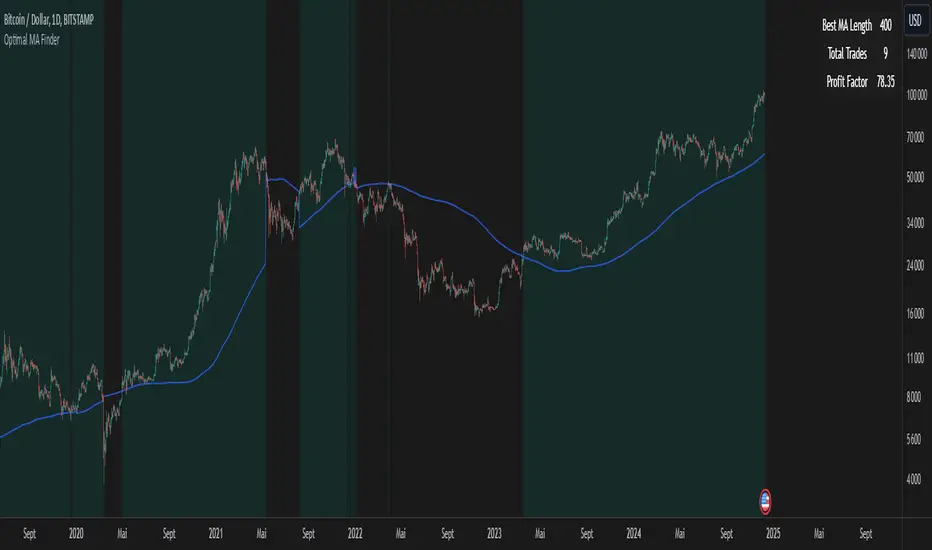
Optimal MA FinderIntroduction to the "Optimal MA Finder" Indicator
The "Optimal MA Finder" is a powerful and versatile tool designed to help traders optimize their moving average strategies. This script combines flexibility, precision, and automation to identify the most effective moving average (MA) length for your trading approach. Whether you're aiming to improve your long-only strategy or implement a buy-and-sell methodology, the "Optimal MA Finder" is your go-to solution for enhanced decision-making.
What Does It Do?
The script evaluates a wide range of moving average lengths, from 10 to 500, to determine which one produces the best results based on historical data. By calculating critical metrics such as the total number of trades and the profit factor for each MA length, it identifies the one that maximizes profitability. It supports both simple moving averages (SMA) and exponential moving averages (EMA), allowing you to tailor the analysis to your preferred method.
The logic works by backtesting each MA length against the price data and assessing the performance under two strategies:
Buy & Sell: Includes both long and short trades.
Long Only: Focuses solely on long positions for more conservative strategies.
Once the optimal MA length is identified, the script overlays it on the chart, highlighting periods when the price crosses over or under the optimal MA, helping traders identify potential entry and exit points.
Why Is It Useful?
This indicator stands out for its ability to automate a task that is often labor-intensive and subjective: finding the best MA length. By providing a clear, data-driven answer, it saves traders countless hours of manual testing while significantly enhancing the accuracy of their strategies. For example, instead of guessing whether a 50-period EMA is more effective than a 200-period SMA, the "Optimal MA Finder" will pinpoint the exact length and type of MA that has historically yielded the best results for your chosen strategy.
Key Benefits:
Precision: Identifies the MA length with the highest profit factor for maximum profitability.
Automation: Conducts thorough backtesting without manual effort.
Flexibility: Adapts to your preferred MA type (SMA or EMA) and trading strategy (Buy & Sell or Long Only).
Real-Time Feedback: Provides actionable insights by plotting the optimal MA directly on your chart and highlighting relevant trading periods.
Example of Use: Imagine you're trading a volatile stock and want to optimize your long-only strategy. By applying the "Optimal MA Finder," you discover that a 120-period EMA results in the highest profit factor. The indicator plots this EMA on your chart, showing you when to consider entering or exiting positions based on price movements relative to the EMA.
In short, the "Optimal MA Finder" empowers traders by delivering data-driven insights and improving the effectiveness of trading strategies. Its clear logic, combined with robust automation, makes it an invaluable tool for both novice and experienced traders seeking consistent results.
OBV + Custom MA StrategyFor a long time, the use of the OBV indicator has been relatively monotonous, with its expression and content lacking diversity. Therefore, I'm considering trying new ways of representation.
This "OBV + Custom MA Strategy" indicator combines the On-Balance Volume (OBV) with customizable moving averages (SMA, EMA, or WMA) to provide advanced insights into market trends. The indicator calculates OBV manually and overlays two moving averages: a short-term and a long-term MA. Key features include:
OBV plotted alongside short-term and long-term moving averages for better trend visualization.
Signals generated when OBV crosses the short-term MA or when the short-term MA crosses the long-term MA.
Alerts for bullish and bearish crossovers to help identify potential buy or sell opportunities.
This indicator is suitable for traders looking to incorporate volume dynamics into their strategy while customizing their moving average type and periods.
中文说明
此“OBV + 自定义均线策略”指标结合了成交量指标OBV与可定制的移动均线(SMA、EMA或WMA),为市场趋势分析提供了更多的视角。该指标手动计算OBV,并叠加短期与长期均线,主要特点包括:
绘制OBV以及短期和长期均线,以更清晰地观察趋势。
当OBV上穿/下穿短期均线或短期均线上穿/下穿长期均线时,生成买卖信号。
提供多种看涨和看跌信号的警报,帮助识别潜在的买入或卖出机会。
此指标适合希望将成交量动态纳入策略的交易者,并支持自定义均线类型和周期以满足个性化需求。
Boltzmann Weighted Moving average ( BWMA )Overview:
Introducing the Boltzmann Weighted Moving Average (BWMA) – a novel approach that draws inspiration from statistical mechanics to emphasize recent market data more than older data. By applying an exponential decay governed by a “temperature” parameter, BWMA provides a unique perspective on price trends and enhances noise filtering. An EMA-based smoothing is then applied for an even cleaner, more stable signal.
Key Features:
Boltzmann Weighting: The BWMA assigns weights to each data point based on a Boltzmann-like formula, giving more influence to recent bars and reducing the impact of older ones. This creates a dynamic, adaptive moving average that can quickly respond to market changes.
Adaptive Temperature Control: Users can adjust the “Temperature” (T) parameter. A lower T puts a stronger emphasis on the most recent data, while a higher T makes the weight distribution more uniform across the chosen period.
EMA Smoothing: After computing the weighted average, an EMA is applied to smooth out short-term noise, resulting in a cleaner trend indication.
Color-Coded Trend Indicator: The BWMA line changes color depending on its slope, allowing traders to quickly identify bullish (green) or bearish (red) conditions at a glance.
Parameters:
Period: Defines the lookback window over which the Boltzmann weights are calculated.
Temperature (T): Controls the steepness of the weight decay. Lower T emphasizes recency, while higher T spreads weights more evenly.
Alpha (Energy Scale): Adjusts how quickly “Energy” (and thus weight decay) increases with older data points.
Smoothing Period: Determines the EMA length for reducing noise after weighting, providing a more stable signal.
How It Works:
The BWMA calculates a weighted average of recent prices, where the weight for each data point i is given by:
weight = math.exp(-energy / (k_B * T))
Energy_i: Increases as the data point is further back in time.
k_B: A scaling constant, set to 1 for simplicity.
T: "Temperature" parameter that controls how quickly the weights decay. A lower T emphasizes more recent data strongly, while a higher T spreads out the emphasis more evenly.
Visuals:
BWMA Line: Plotted as a smooth line that changes color based on trend direction.
Green: BWMA is rising (bullish trend).
Red: BWMA is falling (bearish trend).
Usage:
The BWMA can be used similarly to traditional moving averages but offers greater flexibility and adaptability:
Adjust T and Alpha: Fine-tune the weighting profile to match your trading style, whether you prefer rapid response to recent changes or a more balanced view.
Trend Confirmation: Use color changes to confirm bullish or bearish momentum.
Filtering Noise: The combination of Boltzmann weighting and EMA smoothing can help reduce the impact of sudden price spikes and yield clearer trend signals.
By blending the concepts of statistical mechanics with classic technical analysis techniques, the Boltzmann Weighted Moving Average provides traders with an innovative tool for revealing underlying market trends.

Stage Market V4This script provides a comprehensive tool for identifying market stages based on exponential moving averages (EMAs), market performance metrics, and additional price statistics. Below is a summary of its functionality and instructions on how to use it:
1. Inputs and Configuration
Fast and Slow EMA:
Fast EMA Length: Determines the period for the fast EMA.
Slow EMA Length: Determines the period for the slow EMA.
Additional EMAs:
Enable or disable three additional EMAs (EMA 1, EMA 2, and EMA 3) with customizable lengths.
52-Week High Display:
Optionally display the percentage distance from the 52-week high.
2. Market Stages
The indicator identifies six market stages based on the relationship between the price, fast EMA, and slow EMA:
Recovery: Price is above the fast EMA, and the slow EMA is above both the price and the fast EMA.
Accumulation: Price is above both the fast EMA and slow EMA, but the slow EMA is still above the fast EMA.
Bull Market: Price, fast EMA, and slow EMA are all aligned in a rising trend.
Warning: Price is below the fast EMA, but still above the slow EMA, signaling potential weakness.
Distribution: Price is below both EMAs, but the slow EMA remains below the fast EMA.
Bear Market: Price, fast EMA, and slow EMA are all aligned in a falling trend.
The current stage is displayed in a table along with the number of bars spent in that stage.
3. Performance Metrics
The script calculates additional metrics to gauge the stock's performance:
30-Day Change: The percentage price change over the last 30 days.
90-Day Change: The percentage price change over the last 90 days.
Year-to-Date (YTD) Change: The percentage change from the year's first closing price.
Distance from 52-Week High (if enabled): The percentage difference between the current price and the highest price over the past 52 weeks.
These values are color-coded:
Green for positive changes.
Red for negative changes.
4. Table Display
The indicator uses a table in the bottom-right corner of the chart to show:
Current market stage and bars spent in the stage.
30-day, 90-day, and YTD changes.
Distance from the 52-week high (if enabled).
5. EMA Plotting
The script plots the following EMAs on the chart:
Fast EMA (default: 50-period) in yellow.
Slow EMA (default: 200-period) in orange.
Optional EMAs (EMA 1, EMA 2, and EMA 3) in blue, green, and purple, respectively.
6. Using the Indicator
Add the indicator to your chart via the Pine Editor in TradingView.
Customize the input parameters to fit your trading style or the asset's characteristics.
Use the table to quickly assess the current market stage and key performance metrics.
Observe the plotted EMAs to understand trend alignments and potential crossovers.
This script is particularly useful for identifying market trends, understanding price momentum, and aligning trading decisions with broader market conditions.
