Indikator Bill Williams
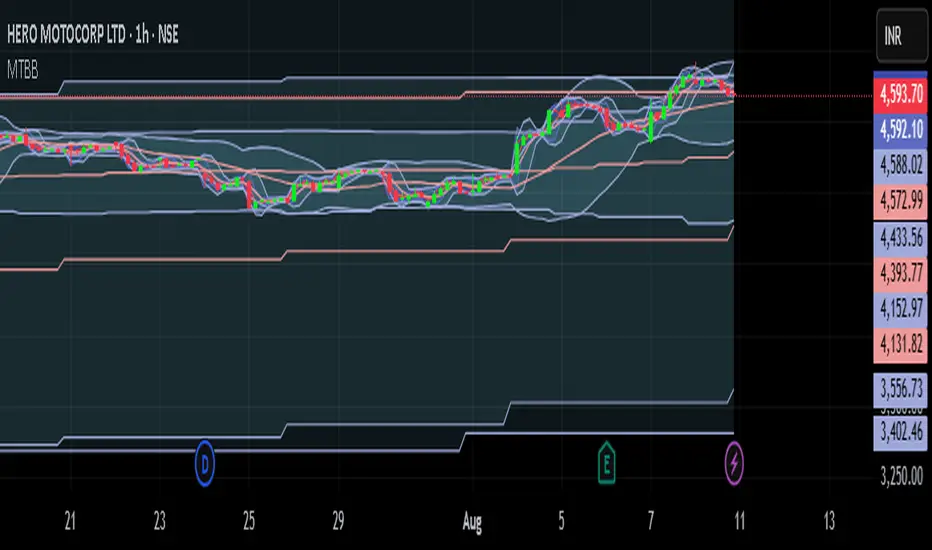
Multi Timeframe 7 Bollinger Bands by CSPMulti Timeframe 7 Bollinger Bands by CSP IT SHOW 1MT,5MT,10MT,1HR,D, W,M BOLLINGER BAND IN ASINGLE CHART.
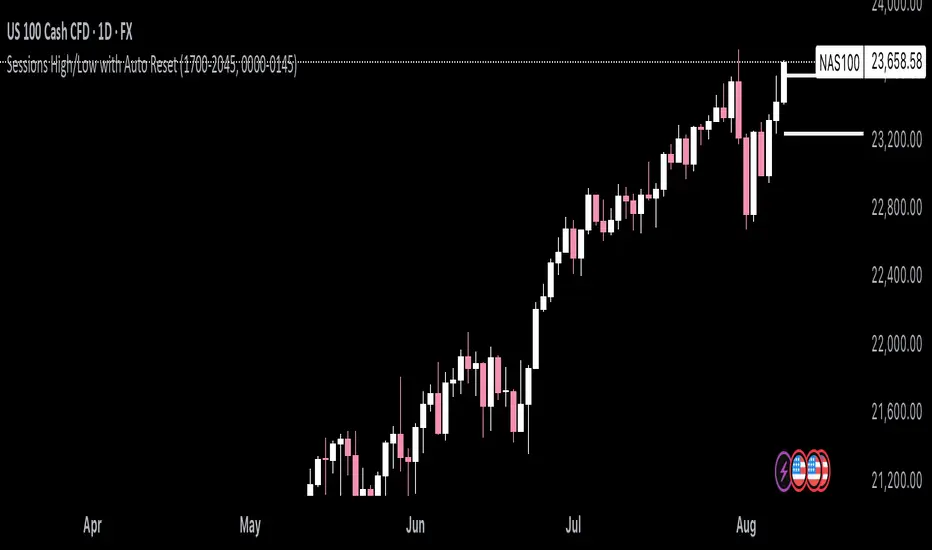
Chiefs sessions 4.1This indicator marks out the most recent asian session and London sessions highs and lows. It also marks off the previous days candles highs and lows in white. Asian session is blue and London is red. This indicator resets every day.
googogallaochoelochogoogogallaochoelocho make sure to try one when you there is one when you mihgt need to use it

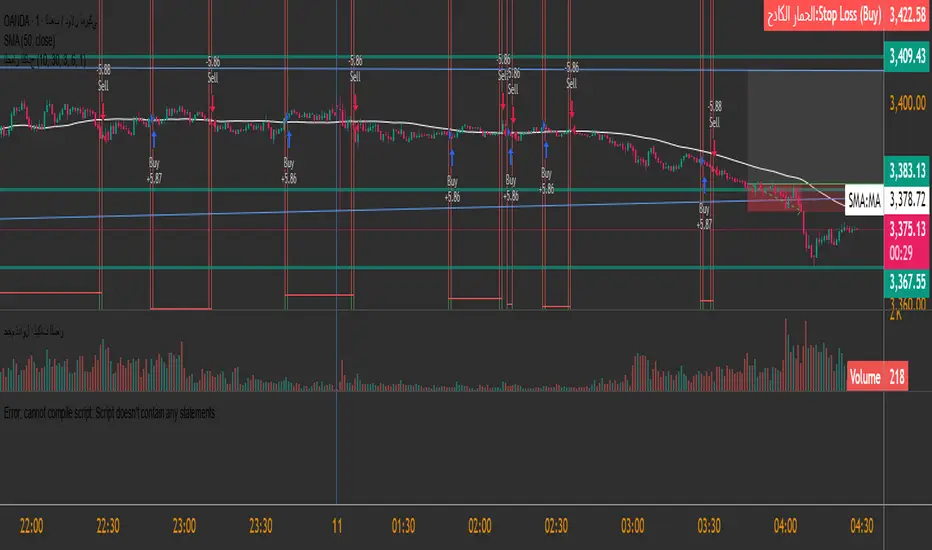
BuySell-byALHELWANI🔱 BuySell-byALHELWANI | مؤشر التغيرات الاتجاهية الذكية
BuySell-byALHELWANI هو مؤشر احترافي متقدّم يرصد نقاط الانعكاس الحقيقية في حركة السوق، باستخدام خوارزمية تعتمد على تحليل القمم والقيعان الهيكلية للسعر (Structure-Based Detection) وليس على مؤشرات تقليدية.
المؤشر مبني على مكتبة signalLib_yashgode9 القوية، مع تخصيص كامل لأسلوب العرض والتنبيهات.
⚙️ ما يقدمه المؤشر:
🔹 إشارات واضحة للشراء والبيع تعتمد على كسر هيكل السوق.
🔹 تخصيص مرن للعمق والانحراف وخطوات التراجع (Backstep) لتحديد الدقة المطلوبة.
🔹 علامات ذكية (Labels) تظهر مباشرة على الشارت عند كل نقطة قرار.
🔹 تنبيهات تلقائية فورية عند كل تغير في الاتجاه (Buy / Sell).
🧠 الآلية المستخدمة:
DEPTH_ENGINE: يتحكم في مدى عمق النظر لحركة السعر.
DEVIATION_ENGINE: يحدد المسافة المطلوبة لتأكيد نقطة الانعكاس.
BACKSTEP_ENGINE: يضمن أن كل إشارة تستند إلى تغير هيكلي حقيقي في الاتجاه.
📌 المميزات:
✅ لا يعيد الرسم (No Repaint)
✅ يعمل على كل الأطر الزمنية وكل الأسواق (فوركس، مؤشرات، كريبتو، أسهم)
✅ تصميم بصري مرن (ألوان، حجم، شفافية)
✅ يدعم الاستخدام في السكالبينغ والسوينغ
ملاحظة:
المؤشر لا يعطي إشارات عشوائية، بل يستند إلى منطق السعر الحقيقي عبر تتبع التغيرات الحركية للسوق.
يُفضّل استخدامه مع خطة تداول واضحة وإدارة رأس مال صارمة.
🔱 BuySell-byALHELWANI | Smart Reversal Detection Indicator
BuySell-byALHELWANI is a high-precision, structure-based reversal indicator designed to identify true directional shifts in the market. Unlike traditional indicators, it doesn't rely on lagging oscillators but uses real-time swing analysis to detect institutional-level pivot points.
Powered by the robust signalLib_yashgode9, this tool is optimized for traders who seek clarity, timing, and strategic control.
⚙️ Core Engine Features:
🔹 Accurate Buy/Sell signals generated from structural highs and lows.
🔹 Adjustable sensitivity using:
DEPTH_ENGINE: Defines how deep the algorithm looks into past swings.
DEVIATION_ENGINE: Sets the deviation required to confirm a structural change.
BACKSTEP_ENGINE: Controls how many bars are validated before confirming a pivot.
🧠 What It Does:
🚩 Detects market structure shifts and confirms them visually.
🏷️ Plots clear Buy-point / Sell-point labels directly on the chart.
🔔 Sends real-time alerts when a directional change is confirmed.
🎯 No repainting – what you see is reliable and final.
✅ Key Benefits:
Works on all timeframes and all asset classes (FX, crypto, indices, stocks).
Fully customizable: colors, label size, transparency.
Ideal for scalping, swing trading, and strategy automation.
High visual clarity with minimal noise.
🔐 Note:
This script is designed for serious traders.
It highlights real market intent, especially when used with trendlines, zones, and volume analysis.
Pair it with disciplined risk management for best results.

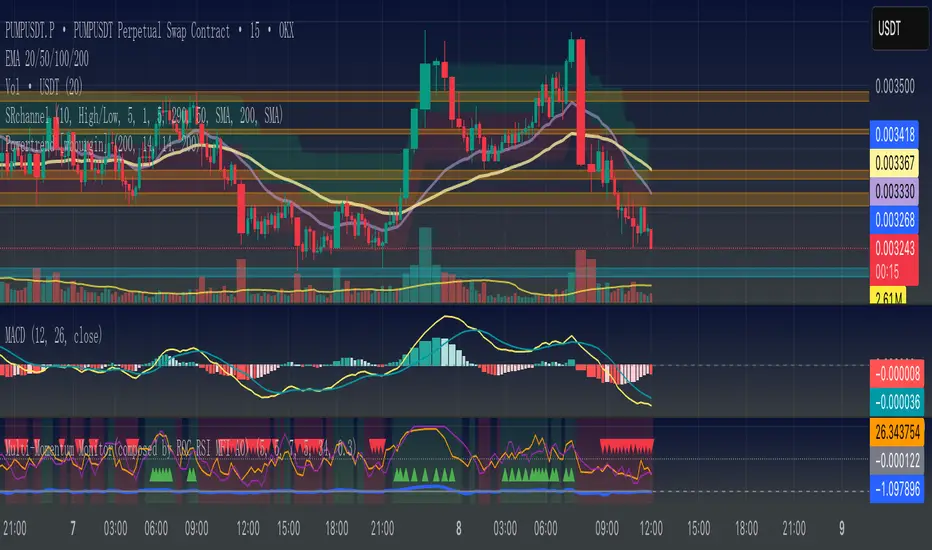
Multi-Momentum Monitor(composed by ROC RSI MFI AO)Multi-Momentum Monitor (Multi-Momentum Monitor) instructions for use
Version: v6 revised version
Applicable objects: currency circle, stock market, futures short-term/swing trader
effect:
Integrate ROC (momentum rate of change), RSI (relative strength), MFI (capital flow), and AO (oscillator) together
Judge the direction and intensity of the current market momentum through “multi-index resonance”
Low latency, easy to configure, suitable for market tracking to assist in judging “pullback vs reversal”
1、Overview of indicator functions
Legend description:
Background color: Green = Strong kinetic energy of multiple parties (≥3/4 of the indicators are in the same direction), red = strong kinetic energy of the empty party (≤1/4 of the indicators are in the same direction)
Triangle mark: The green triangle at the bottom = all long signals of the 4/4 indicator; the red triangle at the top = all short signals of the 4/4 indicator
Four curves:
Blue = ROC (%)
Orange = RSI
Purple = MFI
Gray = AO
2、Explanation of the four core indicators (simple and easy-to-understand version)
Key points of interpretation of the role of indicators
The ROC price momentum rate of change reflects the speed of price rise/fall. ROC is greater than the threshold = long acceleration, less than the-threshold = short acceleration
RSI relative strength index RSI > 50 is too much, RSI <50 is empty
The MFI capital flow indicator combines transaction volume and price. MFI>50 indicates the net inflow of funds, and <50 indicates the net outflow of funds.
AO Super Oscillator fast line average price-slow line average price, greater than 0 is too much, less than 0 is too short
3、Parameter configuration guide
Explanation of common parameters:
ROC cycle /threshold: ROC calculation cycle and kinetic energy sensitivity. Short cycle + low threshold = sensitive (but noisy)
RSI cycle: the shorter the more sensitive, the longer the more stable
MFI cycle: it is recommended to be close to the RSI cycle
AO fast/slow cycle: commonly used 5/34, 5/21 is also available
Background color resonance judgment: ≥3 indicators in the same direction, time scale background
4、How to read the signal
Background color signal (distinguish between trend strength and weakness)
Green background: at least 3 indicators, long positions → multi-party dominance
Red background: At least 3 indicators, bears → bears dominate
No background: the kinetic energy is chaotic, and the probability of shock is large
Triangle mark (extremely strong signal)
Green triangle at the bottom: 4/4 multi-head → super multi-party kinetic energy
Red triangle at the top: 4/4 bears → Super empty kinetic energy
5、Actual usage cases
Short-term breakthrough trading
Observe the picture for 15 minutes, when the background turns green + a green triangle mark appears
There is no obvious empty signal at the upper level (1H)
Follow up at the breaking point and put the stop loss at the lowest
Distinction between callback and reversal
Pullback: The price has fallen but the background is still green, and many indicators have not all turned over.
Reversal: The price drops and the background turns red, and a red triangle appears at the same time
6、Precautions
The signal is not 100% accurate, it must be combined with multiple factors such as price structure, support and resistance.
⏳ Stronger resonance at different cycle levels (such as 15min warning + 1H confirmation)
⚠ The misjudgment rate of the volatile market is high, it is recommended to filter it in combination with the trend direction
Indicators are only an aid, not a substitute, please cooperate with your personal strategy and risk control
📊 多动能监控器(Multi-Momentum Monitor)使用说明
版本:v6 修正版
适用对象:币圈、股市、期货短线/波段交易者
作用:
把 ROC(动量变化率)、RSI(相对强弱)、MFI(资金流量)、AO(震荡指标)整合在一起
通过“多指标共振”判断当前市场动能的方向和强度
低延迟、易配置,适合盯盘辅助判断“回调 vs 反转”
0️⃣ 指标核心组成
ROC 动能速度 衡量价格变化速度,反应趋势衰竭最直接 周期(默认 5)
RSI 短周期 衡量上涨动能比例 周期(默认 5)+ 阈值(50)
MFI 短周期 加入成交量权重的 RSI 周期(默认 7)+ 阈值(50)
AO 方向强弱 快速可视化趋势动能方向 快线周期(默认 5)、慢线周期(默认 34)
1️⃣ 指标功能概览
图例说明:
背景色:绿色 = 多方动能强(≥3/4指标同向),红色 = 空方动能强(≤1/4指标同向)
三角标记:底部绿色三角 = 4/4指标全部多头信号;顶部红色三角 = 4/4指标全部空头信号
四条曲线:
蓝色 = ROC (%)
橙色 = RSI
紫色 = MFI
灰色 = AO
2️⃣ 四大核心指标解释(简单易懂版)
指标 作用 解读关键点
ROC 价格动量变化率 反映价格上涨/下跌的速度,ROC大于阈值=多头加速,小于-阈值=空头加速
RSI 相对强弱指标 RSI > 50 偏多,RSI < 50 偏空
MFI 资金流量指标 结合成交量和价格,MFI > 50 表示资金净流入,< 50 表示资金净流出
AO 超级震荡指标 快线均价 - 慢线均价,大于0偏多,小于0偏空
3️⃣ 参数配置指南
常用参数解释:
ROC 周期 / 阈值:ROC计算周期和动能敏感度。短周期 + 低阈值 = 灵敏(但噪音多)
RSI 周期:越短越敏感,越长越稳
MFI 周期:建议与RSI周期接近
AO快/慢周期:常用5/34,也可5/21
背景色共振判断:≥3个指标同方向时标背景
4️⃣ 如何读信号
📌 背景色信号(趋势强弱区分)
绿色背景:至少3个指标多头 → 多方主导
红色背景:至少3个指标空头 → 空方主导
无背景:动能混乱,震荡概率大
📌 三角标记(极强信号)
底部绿色三角:4/4 多头 → 超强多方动能
顶部红色三角:4/4 空头 → 超强空方动能
5️⃣ 实战用法案例
短线突破交易
观察15分钟图,当背景转绿 + 出现绿色三角标记
上级别(1H)无明显空方信号
在突破点跟进,止损放在前低
回调与反转区分
回调:价格回落但背景仍为绿色,多指标未全部翻空
反转:价格回落并背景翻红,同时出现红色三角
6️⃣ 注意事项
📉 信号不是100%准确,要结合价格结构、支撑阻力等多因素
⏳ 不同周期级别共振更强(如15min预警 + 1H确认)
⚠ 震荡市误判率高,建议结合趋势方向过滤
💡 指标只是辅助,不是替代品,请配合个人策略与风险控制
ALRais Gold Indicator
ALRais Gold Indicator
A professional invite-only script designed to identify high-accuracy trading opportunities by analyzing price structure and volume dynamics.
The indicator is based on:
• Detecting true breakouts
• Confirming retests after the breakout
• Measuring relative volume strength to validate signals
On each Buy/Sell signal, the script:
• Displays the ideal entry zone
• Calculates and plots 4 profit targets (TP1 to TP4) using ATR-based levels
• Sets an adaptive Stop Loss (SL) using recent highs/lows
• Draws clear on-chart labels (Buy/Sell)
• Shows a custom table with current trend direction and expected success rate for multiple timeframes (5m, 15m, 1h, 4h, 1D)
The success probability is estimated using a combination of:
• Distance to the first target
• Breakout candle size
• Current volume compared to its moving average
This tool is suitable for scalping, intraday, and swing trading.
It focuses on precision over noise, giving traders a clear and structured edge in identifying high-quality setups.

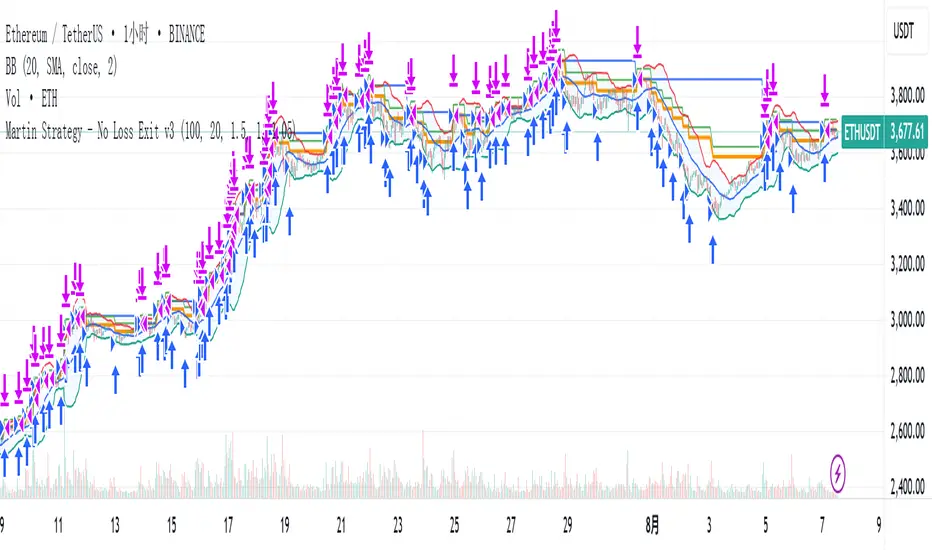
Martin Strategy - No Loss Exit v3Martin Strategy - No Loss Exit v3Martin Strategy - No Loss Exit v3Martin Strategy - No Loss Exit v3


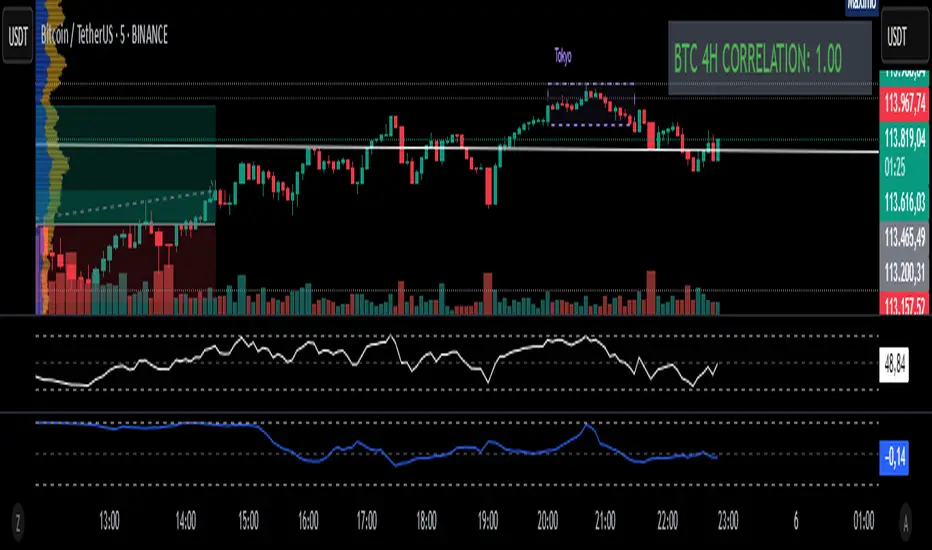
Fixed 4H BTC/Altcoins Correlation for Scalping
Fixed 4H Timeframe: The calculation is hardcoded to the 4-hour timeframe. This ensures the correlation value remains stable and relevant for structural analysis while you trade on lower timeframes.
Clean On-Screen Display: Instead of a separate plot line that can clutter the chart, the indicator displays the correlation value in a clean, simple table in the top-right corner.
Dynamic Coloring: The correlation value is color-coded for quick visual assessment:
Green: Strong correlation (> 0.70)
Yellow: Moderate correlation (0.30 to 0.70)
Red: Weak or negative correlation (< 0.30)
Customizable Inputs: Users can easily configure the BTC symbol (e.g., BINANCE:BTCUSDT, COINBASE:BTCUSD), the correlation lookback period (Length), and the price source (Source) to match their reference indicators or preferences.
Add the indicator to your chart (for example, a 5-minute chart of any altcoin).
The table in the top-right corner will immediately display the altcoin's current correlation to BTC, based on 4-hour data.
Use this value to gauge market sentiment. A high positive correlation suggests the altcoin is likely to follow BTC's moves. A low or negative correlation suggests the altcoin is moving independently.
For perfect synchronization with another standard correlation indicator, go to the script's settings (⚙️ icon) and ensure the Length and Source parameters are identical to your reference indicator.
This tool aims to bridge the gap between high-frequency trading and high-timeframe market structure, providing a crucial piece of information in a simple, stable, and accessible format.
Manadi Buy/Sell Strategy EMA + MACD + RSI + AlertsIt is a strategy / indicator of buy and sell special crypto for 15 min to 1 h time frame.
used with RSI, Macd, and Ema cros 9/21

SMC Structures and FVGสวัสดีครับ! ผมจะอธิบายอินดิเคเตอร์ "SMC Structures and FVG + MACD" ที่คุณให้มาอย่างละเอียดในแต่ละส่วน เพื่อให้คุณเข้าใจการทำงานของมันอย่างถ่องแท้ครับ
อินดิเคเตอร์นี้เป็นการผสมผสานแนวคิดของ Smart Money Concept (SMC) ซึ่งเน้นการวิเคราะห์โครงสร้างตลาด (Market Structure) และ Fair Value Gap (FVG) เข้ากับอินดิเคเตอร์ MACD เพื่อใช้เป็นตัวกรองหรือตัวยืนยันสัญญาณ Choch/BoS (Change of Character / Break of Structure)
1. ภาพรวมอินดิเคเตอร์ (Overall Purpose)
อินดิเคเตอร์นี้มีจุดประสงค์หลักคือ:
ระบุโครงสร้างตลาด: ตีเส้นและป้ายกำกับ Choch (Change of Character) และ BoS (Break of Structure) บนกราฟโดยอัตโนมัติ
ผสานการยืนยันด้วย MACD: สัญญาณ Choch/BoS จะถูกพิจารณาก็ต่อเมื่อ MACD Histogram เกิดการตัดขึ้นหรือลง (Zero Cross) ในทิศทางที่สอดคล้องกัน
แสดง Fair Value Gap (FVG): หากเปิดใช้งาน จะมีการตีกล่อง FVG บนกราฟ
แสดงระดับ Fibonacci: คำนวณและแสดงระดับ Fibonacci ที่สำคัญตามโครงสร้างตลาดปัจจุบัน
ปรับตาม Timeframe: การคำนวณและการแสดงผลทั้งหมดจะปรับตาม Timeframe ที่คุณกำลังใช้งานอยู่โดยอัตโนมัติ
2. ส่วนประกอบหลักของโค้ด (Code Breakdown)
โค้ดนี้สามารถแบ่งออกเป็นส่วนหลัก ๆ ได้ดังนี้:
2.1 Inputs (การตั้งค่า)
ส่วนนี้คือตัวแปรที่คุณสามารถปรับแต่งได้ในหน้าต่างการตั้งค่าของอินดิเคเตอร์ (คลิกที่รูปฟันเฟืองข้างชื่ออินดิเคเตอร์บนกราฟ)
MACD Settings (ตั้งค่า MACD):
fast_len: ความยาวของ Fast EMA สำหรับ MACD (ค่าเริ่มต้น 12)
slow_len: ความยาวของ Slow EMA สำหรับ MACD (ค่าเริ่มต้น 26)
signal_len: ความยาวของ Signal Line สำหรับ MACD (ค่าเริ่มต้น 9)
= ta.macd(close, fast_len, slow_len, signal_len): คำนวณค่า MACD Line, Signal Line และ Histogram โดยใช้ราคาปิด (close) และค่าความยาวที่กำหนด
is_bullish_macd_cross: ตรวจสอบว่า MACD Histogram ตัดขึ้นเหนือเส้น 0 (จากค่าลบเป็นบวก)
is_bearish_macd_cross: ตรวจสอบว่า MACD Histogram ตัดลงใต้เส้น 0 (จากค่าบวกเป็นลบ)
Fear Value Gap (FVG) Settings:
isFvgToShow: (Boolean) เปิด/ปิดการแสดง FVG บนกราฟ
bullishFvgColor: สีสำหรับ Bullish FVG
bearishFvgColor: สีสำหรับ Bearish FVG
mitigatedFvgColor: สีสำหรับ FVG ที่ถูก Mitigate (ลดทอน) แล้ว
fvgHistoryNbr: จำนวน FVG ย้อนหลังที่จะแสดง
isMitigatedFvgToReduce: (Boolean) เปิด/ปิดการลดขนาด FVG เมื่อถูก Mitigate
Structures (โครงสร้างตลาด) Settings:
isStructBodyCandleBreak: (Boolean) หากเป็น true การ Break จะต้องเกิดขึ้นด้วย เนื้อเทียน ที่ปิดเหนือ/ใต้ Swing High/Low หากเป็น false แค่ไส้เทียนทะลุก็ถือว่า Break
isCurrentStructToShow: (Boolean) เปิด/ปิดการแสดงเส้นโครงสร้างตลาดปัจจุบัน (เส้นสีน้ำเงินในภาพตัวอย่าง)
pivot_len: ความยาวของแท่งเทียนที่ใช้ในการมองหาจุด Pivot (Swing High/Low) ยิ่งค่าน้อยยิ่งจับ Swing เล็กๆ ได้, ยิ่งค่ามากยิ่งจับ Swing ใหญ่ๆ ได้
bullishBosColor, bearishBosColor: สีสำหรับเส้นและป้าย BOS ขาขึ้น/ขาลง
bosLineStyleOption, bosLineWidth: สไตล์ (Solid, Dotted, Dashed) และความหนาของเส้น BOS
bullishChochColor, bearishChochColor: สีสำหรับเส้นและป้าย CHoCH ขาขึ้น/ขาลง
chochLineStyleOption, chochLineWidth: สไตล์ (Solid, Dotted, Dashed) และความหนาของเส้น CHoCH
currentStructColor, currentStructLineStyleOption, currentStructLineWidth: สี, สไตล์ และความหนาของเส้นโครงสร้างตลาดปัจจุบัน
structHistoryNbr: จำนวนการ Break (Choch/BoS) ย้อนหลังที่จะแสดง
Structure Fibonacci (จากโค้ดต้นฉบับ):
เป็นชุด Input สำหรับเปิด/ปิด, กำหนดค่า, สี, สไตล์ และความหนาของเส้น Fibonacci Levels ต่างๆ (0.786, 0.705, 0.618, 0.5, 0.382) ที่จะถูกคำนวณจากโครงสร้างตลาดปัจจุบัน
2.2 Helper Functions (ฟังก์ชันช่วยทำงาน)
getLineStyle(lineOption): ฟังก์ชันนี้ใช้แปลงค่า String ที่เลือกจาก Input (เช่น "─", "┈", "╌") ให้เป็นรูปแบบ line.style_ ที่ Pine Script เข้าใจ
get_structure_highest_bar(lookback): ฟังก์ชันนี้พยายามหา Bar Index ของแท่งเทียนที่ทำ Swing High ภายในช่วง lookback ที่กำหนด
get_structure_lowest_bar(lookback): ฟังก์ชันนี้พยายามหา Bar Index ของแท่งเทียนที่ทำ Swing Low ภายในช่วง lookback ที่กำหนด
is_structure_high_broken(...): ฟังก์ชันนี้ตรวจสอบว่าราคาปัจจุบันได้ Break เหนือ _structureHigh (Swing High) หรือไม่ โดยพิจารณาจาก _highStructBreakPrice (ราคาปิดหรือราคา High ขึ้นอยู่กับการตั้งค่า isStructBodyCandleBreak)
FVGDraw(...): ฟังก์ชันนี้รับ Arrays ของ FVG Boxes, Types, Mitigation Status และ Labels มาประมวลผล เพื่ออัปเดตสถานะของ FVG (เช่น ถูก Mitigate หรือไม่) และปรับขนาด/ตำแหน่งของ FVG Box และ Label บนกราฟ
2.3 Global Variables (ตัวแปรทั่วทั้งอินดิเคเตอร์)
เป็นตัวแปรที่ประกาศด้วย var ซึ่งหมายความว่าค่าของมันจะถูกเก็บไว้และอัปเดตในแต่ละแท่งเทียน (persists across bars)
structureLines, structureLabels: Arrays สำหรับเก็บอ็อบเจกต์ line และ label ของเส้น Choch/BoS ที่วาดบนกราฟ
fvgBoxes, fvgTypes, fvgLabels, isFvgMitigated: Arrays สำหรับเก็บข้อมูลของ FVG Boxes และสถานะต่างๆ
structureHigh, structureLow: เก็บราคาของ Swing High/Low ที่สำคัญของโครงสร้างตลาดปัจจุบัน
structureHighStartIndex, structureLowStartIndex: เก็บ Bar Index ของจุดเริ่มต้นของ Swing High/Low ที่สำคัญ
structureDirection: เก็บสถานะของทิศทางโครงสร้างตลาด (1 = Bullish, 2 = Bearish, 0 = Undefined)
fiboXPrice, fiboXStartIndex, fiboXLine, fiboXLabel: ตัวแปรสำหรับเก็บข้อมูลและอ็อบเจกต์ของเส้น Fibonacci Levels
isBOSAlert, isCHOCHAlert: (Boolean) ใช้สำหรับส่งสัญญาณ Alert (หากมีการตั้งค่า Alert ไว้)
2.4 FVG Processing (การประมวลผล FVG)
ส่วนนี้จะตรวจสอบเงื่อนไขการเกิด FVG (Bullish FVG: high < low , Bearish FVG: low > high )
หากเกิด FVG และ isFvgToShow เป็น true จะมีการสร้าง box และ label ใหม่เพื่อแสดง FVG บนกราฟ
มีการจัดการ fvgBoxes และ fvgLabels เพื่อจำกัดจำนวน FVG ที่แสดงตาม fvgHistoryNbr และลบ FVG เก่าออก
ฟังก์ชัน FVGDraw จะถูกเรียกเพื่ออัปเดตสถานะของ FVG (เช่น การถูก Mitigate) และปรับการแสดงผล
2.5 Structures Processing (การประมวลผลโครงสร้างตลาด)
Initialization: ที่ bar_index == 0 (แท่งเทียนแรกของกราฟ) จะมีการกำหนดค่าเริ่มต้นให้กับ structureHigh, structureLow, structureHighStartIndex, structureLowStartIndex
Finding Current High/Low: highest, highestBar, lowest, lowestBar ถูกใช้เพื่อหา High/Low ที่สุดและ Bar Index ของมันใน 10 แท่งล่าสุด (หรือทั้งหมดหากกราฟสั้นกว่า 10 แท่ง)
Calculating Structure Max/Min Bar: structureMaxBar และ structureMinBar ใช้ฟังก์ชัน get_structure_highest_bar และ get_structure_lowest_bar เพื่อหา Bar Index ของ Swing High/Low ที่แท้จริง (ไม่ใช่แค่ High/Low ที่สุดใน lookback แต่เป็นจุด Pivot ที่สมบูรณ์)
Break Price: lowStructBreakPrice และ highStructBreakPrice จะเป็นราคาปิด (close) หรือราคา Low/High ขึ้นอยู่กับ isStructBodyCandleBreak
isStuctureLowBroken / isStructureHighBroken: เงื่อนไขเหล่านี้ตรวจสอบว่าราคาได้ทำลาย structureLow หรือ structureHigh หรือไม่ โดยพิจารณาจากราคา Break, ราคาแท่งก่อนหน้า และ Bar Index ของจุดเริ่มต้นโครงสร้าง
Choch/BoS Logic (ส่วนสำคัญที่ถูกผสานกับ MACD):
if(isStuctureLowBroken and is_bearish_macd_cross): นี่คือจุดที่ MACD เข้ามามีบทบาท หากราคาทำลาย structureLow (สัญญาณขาลง) และ MACD Histogram เกิด Bearish Zero Cross (is_bearish_macd_cross เป็น true) อินดิเคเตอร์จะพิจารณาว่าเป็น Choch หรือ BoS
หาก structureDirection == 1 (เดิมเป็นขาขึ้น) หรือ 0 (ยังไม่กำหนด) จะตีเป็น "CHoCH" (เปลี่ยนทิศทางโครงสร้างเป็นขาลง)
หาก structureDirection == 2 (เดิมเป็นขาลง) จะตีเป็น "BOS" (ยืนยันโครงสร้างขาลง)
มีการสร้าง line.new และ label.new เพื่อวาดเส้นและป้ายกำกับ
structureDirection จะถูกอัปเดตเป็น 1 (Bullish)
structureHighStartIndex, structureLowStartIndex, structureHigh, structureLow จะถูกอัปเดตเพื่อกำหนดโครงสร้างใหม่
else if(isStructureHighBroken and is_bullish_macd_cross): เช่นกันสำหรับขาขึ้น หากราคาทำลาย structureHigh (สัญญาณขาขึ้น) และ MACD Histogram เกิด Bullish Zero Cross (is_bullish_macd_cross เป็น true) อินดิเคเตอร์จะพิจารณาว่าเป็น Choch หรือ BoS
หาก structureDirection == 2 (เดิมเป็นขาลง) หรือ 0 (ยังไม่กำหนด) จะตีเป็น "CHoCH" (เปลี่ยนทิศทางโครงสร้างเป็นขาขึ้น)
หาก structureDirection == 1 (เดิมเป็นขาขึ้น) จะตีเป็น "BOS" (ยืนยันโครงสร้างขาขึ้น)
มีการสร้าง line.new และ label.new เพื่อวาดเส้นและป้ายกำกับ
structureDirection จะถูกอัปเดตเป็น 2 (Bearish)
structureHighStartIndex, structureLowStartIndex, structureHigh, structureLow จะถูกอัปเดตเพื่อกำหนดโครงสร้างใหม่
การลบเส้นเก่า: d.delete_line (หากไลบรารีทำงาน) จะถูกเรียกเพื่อลบเส้นและป้ายกำกับเก่าออกเมื่อจำนวนเกิน structHistoryNbr
Updating Structure High/Low (else block): หากไม่มีการ Break เกิดขึ้น แต่ราคาปัจจุบันสูงกว่า structureHigh หรือต่ำกว่า structureLow ในทิศทางที่สอดคล้องกัน (เช่น ยังคงเป็นขาขึ้นและทำ High ใหม่) structureHigh หรือ structureLow จะถูกอัปเดตเพื่อติดตาม High/Low ที่สุดของโครงสร้างปัจจุบัน
Current Structure Display:
หาก isCurrentStructToShow เป็น true อินดิเคเตอร์จะวาดเส้น structureHighLine และ structureLowLine เพื่อแสดงขอบเขตของโครงสร้างตลาดปัจจุบัน
Fibonacci Display:
หาก isFiboXToShow เป็น true อินดิเคเตอร์จะคำนวณและวาดเส้น Fibonacci Levels ต่างๆ (0.786, 0.705, 0.618, 0.5, 0.382) โดยอิงจาก structureHigh และ structureLow ของโครงสร้างตลาดปัจจุบัน
Alerts:
alertcondition: ใช้สำหรับตั้งค่า Alert ใน TradingView เมื่อเกิดสัญญาณ BOS หรือ CHOCH
plot(na):
plot(na) เป็นคำสั่งที่สำคัญในอินดิเคเตอร์ที่ไม่ได้ต้องการพล็อต Series ของข้อมูลบนกราฟ (เช่น ไม่ได้พล็อตเส้น EMA หรือ RSI) แต่ใช้วาดอ็อบเจกต์ (Line, Label, Box) โดยตรง
การมี plot(na) ช่วยให้ Pine Script รู้ว่าอินดิเคเตอร์นี้มีเอาต์พุตที่แสดงผลบนกราฟ แม้ว่าจะไม่ได้เป็น Series ที่พล็อตตามปกติก็ตาม
3. วิธีใช้งาน
คัดลอกโค้ดทั้งหมด ที่อยู่ในบล็อก immersive ด้านบน
ไปที่ TradingView และเปิดกราฟที่คุณต้องการ
คลิกที่เมนู "Pine Editor" ที่อยู่ด้านล่างของหน้าจอ
ลบโค้ดเดิมที่มีอยู่ และ วางโค้ดที่คัดลอกมา ลงไปแทน
คลิกที่ปุ่ม "Add to Chart"
อินดิเคเตอร์จะถูกเพิ่มลงในกราฟของคุณโดยอัตโนมัติ คุณสามารถคลิกที่รูปฟันเฟืองข้างชื่ออินดิเคเตอร์บนกราฟเพื่อเข้าถึงหน้าต่างการตั้งค่าและปรับแต่งตามความต้องการของคุณได้
Hello! I will explain the "SMC Structures and FVG + MACD" indicator you provided in detail, section by section, so you can fully understand how it works.This indicator combines the concepts of Smart Money Concept (SMC), which focuses on analyzing Market Structure and Fair Value Gaps (FVG), with the MACD indicator to serve as a filter or confirmation for Choch (Change of Character) and BoS (Break of Structure) signals.1. Overall PurposeThe main purposes of this indicator are:Identify Market Structure: Automatically draw lines and label Choch (Change of Character) and BoS (Break of Structure) on the chart.Integrate MACD Confirmation: Choch/BoS signals will only be considered when the MACD Histogram performs a cross (Zero Cross) in the corresponding direction.Display Fair Value Gap (FVG): If enabled, FVG boxes will be drawn on the chart.Display Fibonacci Levels: Calculate and display important Fibonacci levels based on the current market structure.Adapt to Timeframe: All calculations and displays will automatically adjust to the timeframe you are currently using.2. Code BreakdownThis code can be divided into the following main sections:2.1 Inputs (Settings)This section contains variables that you can adjust in the indicator's settings window (click the gear icon next to the indicator's name on the chart).MACD Settings:fast_len: Length of the Fast EMA for MACD (default 12)slow_len: Length of the Slow EMA for MACD (default 26)signal_len: Length of the Signal Line for MACD (default 9) = ta.macd(close, fast_len, slow_len, signal_len): Calculates the MACD Line, Signal Line, and Histogram using the closing price (close) and the specified lengths.is_bullish_macd_cross: Checks if the MACD Histogram crosses above the 0 line (from negative to positive).is_bearish_macd_cross: Checks if the MACD Histogram crosses below the 0 line (from positive to negative).Fear Value Gap (FVG) Settings:isFvgToShow: (Boolean) Enables/disables the display of FVG on the chart.bullishFvgColor: Color for Bullish FVG.bearishFvgColor: Color for Bearish FVG.mitigatedFvgColor: Color for FVG that has been mitigated.fvgHistoryNbr: Number of historical FVG to display.isMitigatedFvgToReduce: (Boolean) Enables/disables reducing the size of FVG when mitigated.Structures (โครงสร้างตลาด) Settings:isStructBodyCandleBreak: (Boolean) If true, the break must occur with the candle body closing above/below the Swing High/Low. If false, a wick break is sufficient.isCurrentStructToShow: (Boolean) Enables/disables the display of the current market structure lines (blue lines in the example image).pivot_len: Lookback length for identifying Pivot points (Swing High/Low). A smaller value captures smaller, more frequent swings; a larger value captures larger, more significant swings.bullishBosColor, bearishBosColor: Colors for bullish/bearish BOS lines and labels.bosLineStyleOption, bosLineWidth: Style (Solid, Dotted, Dashed) and width of BOS lines.bullishChochColor, bearishChochColor: Colors for bullish/bearish CHoCH lines and labels.chochLineStyleOption, chochLineWidth: Style (Solid, Dotted, Dashed) and width of CHoCH lines.currentStructColor, currentStructLineStyleOption, currentStructLineWidth: Color, style, and width of the current market structure lines.structHistoryNbr: Number of historical breaks (Choch/BoS) to display.Structure Fibonacci (from original code):A set of inputs to enable/disable, define values, colors, styles, and widths for various Fibonacci Levels (0.786, 0.705, 0.618, 0.5, 0.382) that will be calculated from the current market structure.2.2 Helper FunctionsgetLineStyle(lineOption): This function converts the selected string input (e.g., "─", "┈", "╌") into a line.style_ format understood by Pine Script.get_structure_highest_bar(lookback): This function attempts to find the Bar Index of the Swing High within the specified lookback period.get_structure_lowest_bar(lookback): This function attempts to find the Bar Index of the Swing Low within the specified lookback period.is_structure_high_broken(...): This function checks if the current price has broken above _structureHigh (Swing High), considering _highStructBreakPrice (closing price or high price depending on isStructBodyCandleBreak setting).FVGDraw(...): This function takes arrays of FVG Boxes, Types, Mitigation Status, and Labels to process and update the status of FVG (e.g., whether it's mitigated) and adjust the size/position of FVG Boxes and Labels on the chart.2.3 Global VariablesThese are variables declared with var, meaning their values are stored and updated on each bar (persists across bars).structureLines, structureLabels: Arrays to store line and label objects for Choch/BoS lines drawn on the chart.fvgBoxes, fvgTypes, fvgLabels, isFvgMitigated: Arrays to store FVG box data and their respective statuses.structureHigh, structureLow: Stores the price of the significant Swing High/Low of the current market structure.structureHighStartIndex, structureLowStartIndex: Stores the Bar Index of the start point of the significant Swing High/Low.structureDirection: Stores the status of the market structure direction (1 = Bullish, 2 = Bearish, 0 = Undefined).fiboXPrice, fiboXStartIndex, fiboXLine, fiboXLabel: Variables to store data and objects for Fibonacci Levels.isBOSAlert, isCHOCHAlert: (Boolean) Used to trigger alerts in TradingView (if alerts are configured).2.4 FVG ProcessingThis section checks the conditions for FVG formation (Bullish FVG: high < low , Bearish FVG: low > high ).If FVG occurs and isFvgToShow is true, a new box and label are created to display the FVG on the chart.fvgBoxes and fvgLabels are managed to limit the number of FVG displayed according to fvgHistoryNbr and remove older FVG.The FVGDraw function is called to update the FVG status (e.g., whether it's mitigated) and adjust its display.2.5 Structures ProcessingInitialization: At bar_index == 0 (the first bar of the chart), structureHigh, structureLow, structureHighStartIndex, and structureLowStartIndex are initialized.Finding Current High/Low: highest, highestBar, lowest, lowestBar are used to find the highest/lowest price and its Bar Index of it in the last 10 bars (or all bars if the chart is shorter than 10 bars).Calculating Structure Max/Min Bar: structureMaxBar and structureMinBar use get_structure_highest_bar and get_structure_lowest_bar functions to find the Bar Index of the true Swing High/Low (not just the highest/lowest in the lookback but a complete Pivot point).Break Price: lowStructBreakPrice and highStructBreakPrice will be the closing price (close) or the Low/High price, depending on the isStructBodyCandleBreak setting.isStuctureLowBroken / isStructureHighBroken: These conditions check if the price has broken structureLow or structureHigh, considering the break price, previous bar prices, and the Bar Index of the structure's starting point.Choch/BoS Logic (Key Integration with MACD):if(isStuctureLowBroken and is_bearish_macd_cross): This is where MACD plays a role. If the price breaks structureLow (bearish signal) AND the MACD Histogram performs a Bearish Zero Cross (is_bearish_macd_cross is true), the indicator will consider it a Choch or BoS.If structureDirection == 1 (previously bullish) or 0 (undefined), it will be labeled "CHoCH" (changing structure direction to bearish).If structureDirection == 2 (already bearish), it will be labeled "BOS" (confirming bearish structure).line.new and label.new are used to draw the line and label.structureDirection will be updated to 1 (Bullish).structureHighStartIndex, structureLowStartIndex, structureHigh, structureLow will be updated to define the new structure.else if(isStructureHighBroken and is_bullish_macd_cross): Similarly for bullish breaks. If the price breaks structureHigh (bullish signal) AND the MACD Histogram performs a Bullish Zero Cross (is_bullish_macd_cross is true), the indicator will consider it a Choch or BoS.If structureDirection == 2 (previously bearish) or 0 (undefined), it will be labeled "CHoCH" (changing structure direction to bullish).If structureDirection == 1 (already bullish), it will be labeled "BOS" (confirming bullish structure).line.new and label.new are used to draw the line and label.structureDirection will be updated to 2 (Bearish).structureHighStartIndex, structureLowStartIndex, structureHigh, structureLow will be updated to define the new structure.Deleting Old Lines: d.delete_line (if the library works) will be called to delete old lines and labels when their number exceeds structHistoryNbr.Updating Structure High/Low (else block): If no break occurs, but the current price is higher than structureHigh or lower than structureLow in the corresponding direction (e.g., still bullish and making a new high), structureHigh or structureLow will be updated to track the highest/lowest point of the current structure.Current Structure Display:If isCurrentStructToShow is true, the indicator draws structureHighLine and structureLowLine to show the boundaries of the current market structure.Fibonacci Display:If isFiboXToShow is true, the indicator calculates and draws various Fibonacci Levels (0.786, 0.705, 0.618, 0.5, 0.382) based on the structureHigh and structureLow of the current market structure.Alerts:alertcondition: Used to set up alerts in TradingView when BOS or CHOCH signals occur.plot(na):plot(na) is an important statement in indicators that do not plot data series directly on the chart (e.g., not plotting EMA or RSI lines) but instead draw objects (Line, Label, Box).Having plot(na) helps Pine Script recognize that this indicator has an output displayed on the chart, even if it's not a regularly plotted series.3. How to UseCopy all the code in the immersive block above.Go to TradingView and open your desired chart.Click on the "Pine Editor" menu at the bottom of the screen.Delete any existing code and paste the copied code in its place.Click the "Add to Chart" button.The indicator will be added to your chart automatically. You can click the gear icon next to the indicator's name on the chart to access the settings window and customize it to your needs.I hope this explanation helps you understand this indicator in detail. If anything is unclear, or you need further adjustments, please let me know.

Spartan trading swing high low with htf openspartan trading swing high low with htf open and htf market structure

TMM - 4EMAThe 4 EMA Indicator (Exponential Moving Average) uses four exponential moving averages with different periods to identify market trends across multiple timeframes. It helps traders recognize short-term to long-term momentum and make informed entry or exit decisions. When the EMAs are aligned from shortest to longest and sloping upward, it indicates a bullish trend. Conversely, when they are ordered from longest to shortest and sloping downward, it signals a bearish trend. The 4 EMA is especially useful in trend-following strategies for spotting strong directional movements.

COT INDEX
// Users & Producers: Commercial Positions
// Large Specs (Hedge Fonds): Non-commercial Positions
// Retail: Non-reportable Positions
//@version=5
int weeks = input.int(26, "Number of weeks", minval=1)
int upperExtreme = input.int(80, "Upper Threshold in %", minval=50)
int lowerExtreme = input.int(20, "Lower Threshold in %", minval=1)
bool hideCurrentWeek = input(true, "Hide the current week until market close")
bool markExtremes = input(false, "Mark long and short extremes")
bool showSmallSpecs = input(true, "Show small speculators index")
bool showProducers = input(true, "Show producers index")
bool showLargeSpecs = input(true, "Show large speculators index")
indicator("COT INDEX", shorttitle="COT INDEX", format=format.percent, precision=0)
import TradingView/LibraryCOT/2 as cot
// Function to fix some symbols.
var string Root_Symbol = syminfo.root
var string CFTC_Code_fixed = cot.convertRootToCOTCode("Auto")
if Root_Symbol == "HG"
CFTC_Code_fixed := "085692"
else if Root_Symbol == "LBR"
CFTC_Code_fixed := "058644"
// Function to request COT data for Futures only.
dataRequest(metricName, isLong) =>
tickerId = cot.COTTickerid('Legacy', CFTC_Code_fixed, false, metricName, isLong ? "Long" : "Short", "All")
value = request.security(tickerId, "1D", close, ignore_invalid_symbol = true)
if barstate.islastconfirmedhistory and na(value)
runtime.error("Could not find relevant COT data based on the current symbol.")
value
// Function to calculate net long positions.
netLongCommercialPositions() =>
commercialLong = dataRequest("Commercial Positions", true)
commercialShort = dataRequest("Commercial Positions", false)
commercialLong - commercialShort
netLongLargePositions() =>
largeSpecsLong = dataRequest("Noncommercial Positions", true)
largeSpecsShort = dataRequest("Noncommercial Positions", false)
largeSpecsLong - largeSpecsShort
netLongSmallPositions() =>
smallSpecsLong = dataRequest("Nonreportable Positions", true)
smallSpecsShort = dataRequest("Nonreportable Positions", false)
smallSpecsLong - smallSpecsShort
calcIndex(netPos) =>
minNetPos = ta.lowest(netPos, weeks)
maxNetPos = ta.highest(netPos, weeks)
if maxNetPos != minNetPos
100 * (netPos - minNetPos) / (maxNetPos - minNetPos)
else
na
// Calculate the Commercials Position Index.
commercialsIndex = calcIndex(netLongCommercialPositions())
largeSpecsIndex = calcIndex(netLongLargePositions())
smallSpecsIndex = calcIndex(netLongSmallPositions())
// Conditional logic based on user input
plotValueCommercials = hideCurrentWeek ? (timenow >= time_close ? commercialsIndex : na) : (showProducers ? commercialsIndex : na)
plotValueLarge = hideCurrentWeek ? (timenow >= time_close ? largeSpecsIndex : na) : (showLargeSpecs ? largeSpecsIndex : na)
plotValueSmall = hideCurrentWeek ? (timenow >= time_close ? smallSpecsIndex : na) : (showSmallSpecs ? smallSpecsIndex : na)
// Plot the index and horizontal lines
plot(plotValueCommercials, "Commercials", color=color.blue, style=plot.style_line, linewidth=2)
plot(plotValueLarge, "Large Speculators", color=color.red, style=plot.style_line, linewidth=1)
plot(plotValueSmall, "Small Speculators", color=color.green, style=plot.style_line, linewidth=1)
hline(upperExtreme, "Upper Threshold", color=color.green, linestyle=hline.style_solid, linewidth=1)
hline(lowerExtreme, "Lower Threshold", color=color.red, linestyle=hline.style_solid, linewidth=1)
/// Marking extremes with background color
bgcolor(markExtremes and (commercialsIndex >= upperExtreme or largeSpecsIndex >= upperExtreme or smallSpecsIndex >= upperExtreme) ? color.new(color.gray, 90) : na, title="Upper Threshold")
bgcolor(markExtremes and (commercialsIndex <= lowerExtreme or largeSpecsIndex <= lowerExtreme or smallSpecsIndex <= lowerExtreme) ? color.new(color.gray, 90) : na, title="Lower Threshold")

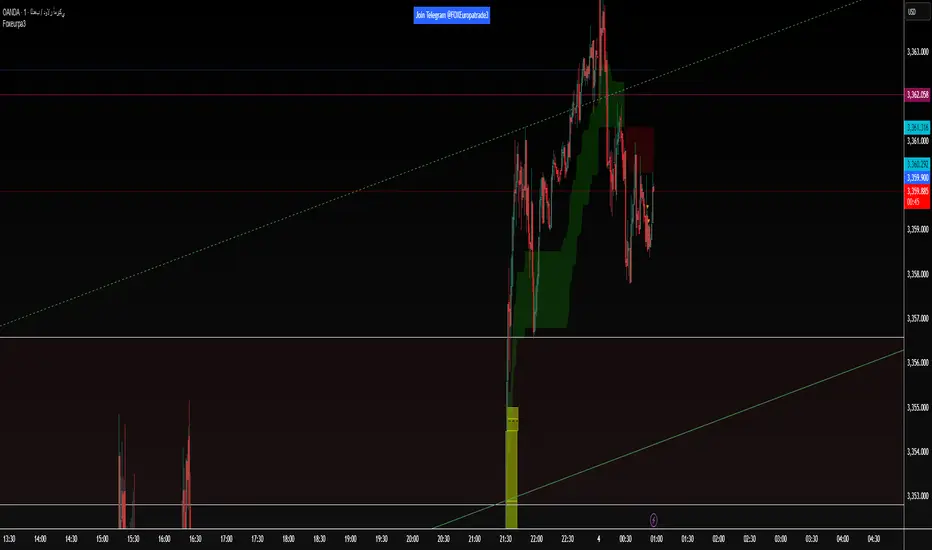
Foxeurpa4The FOXEuropa indicator provides accurate signals, clearly defining entry and exit zones, with well-calculated targets… But remember: risk management is the foundation.”
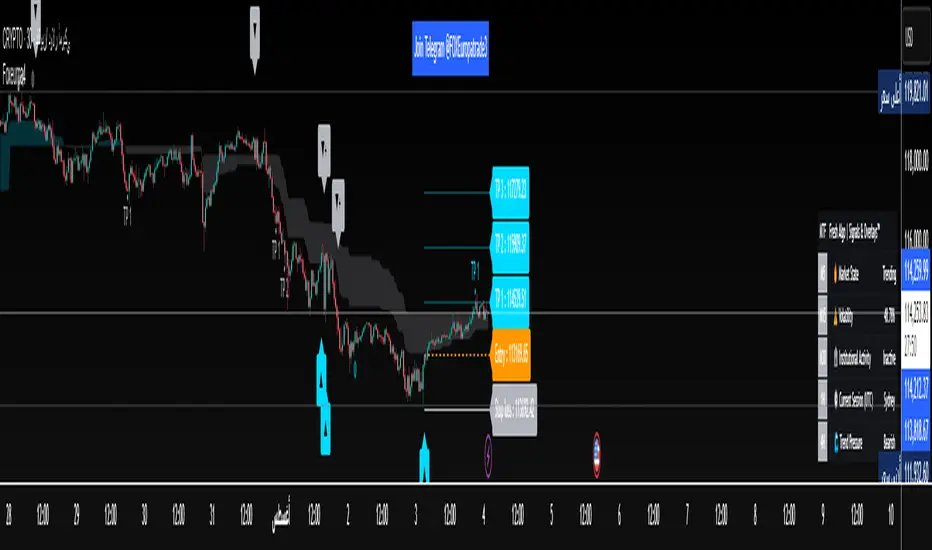
Foxeurpa3The foxEurope indicator shows you liquidity zones, fair value gaps, and order blocks.”
The foxEurope indicator shows you liquidity zones, fair value gaps, and order blocks.”
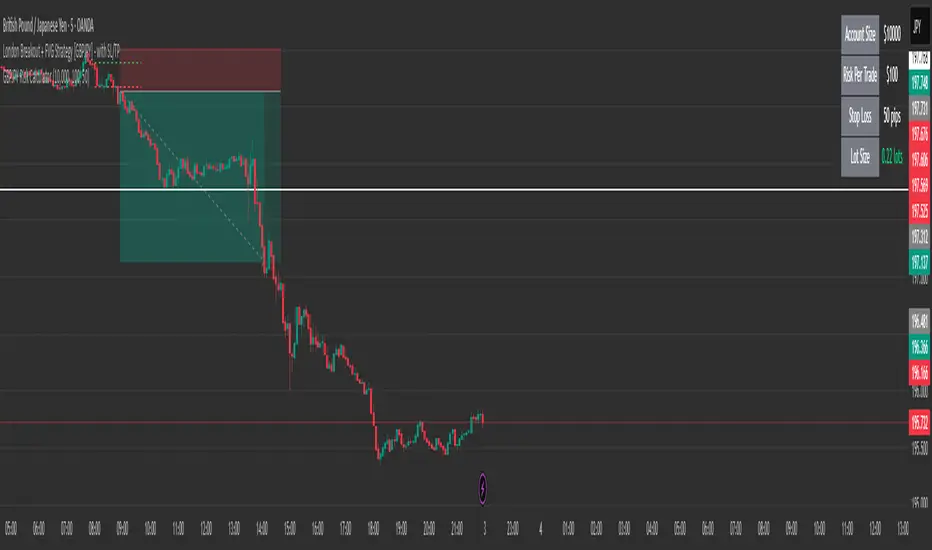
Double Fractal Entry📘 Double Fractal Entry – Original Structure-Based Entry System
Double Fractal Entry is a proprietary indicator that uses dynamic fractal structure to generate actionable buy/sell signals, with automatic Stop-Loss and Take-Profit placement. Unlike classic fractal tools or ZigZag-based visuals, this script constructs real-time structural channels from price extremes and offers precise entry points based on breakout or rejection behavior.
It is designed for traders who want a clear, structured approach to trading price action — without repainting, lagging indicators, or built-in oscillators.
🧠 Core Logic
This script combines three custom-built modules:
1. Fractal Detection and Channel Construction
- Fractals are detected using a configurable number of left/right bars (sensitivity).
- Confirmed upper/lower fractals are connected into two continuous channels.
- These channels represent real-time structure zones that evolve with price.
2. Entry Signal Logic
You can choose between two signal types:
- Breakout Mode – Triggers when price breaks above the upper fractal structure (for buys) or below the lower one (for sells).
- Rebound Mode – Triggers when price approaches a fractal channel and then rejects it (forms a reversal setup).
Each signal includes:
- Entry arrow on the chart
- Horizontal entry line
- Stop-Loss and Take-Profit lines
3. SL/TP Calculation
Unlike tools that use ATR or fixed values, SL and TP are dynamically set using the fractal range — the distance between the most recent upper and lower fractals. This makes the risk model adaptive to market volatility and structure.
📊 Visuals on the Chart
- 🔺 Green/Red triangle markers = confirmed fractals
- 📈 Lime/Red channel lines = evolving upper/lower structure
- 🔵 Blue arrow = signal direction (buy/sell)
- 📉 SL/TP lines = dynamically drawn based on fractal spacing
- 🔁 Signal history = optional, toggleable for backtesting
⚙️ Settings and Customization
- Fractal sensitivity (bars left/right)
- Entry mode: Breakout or Rebound
- SL and TP multiplier (based on fractal range)
- Visibility settings (signal history, lines, colors, etc.)
💡 What Makes It Unique
This is not just a variation of standard fractals or a ZigZag wrapper.
Double Fractal Entry was built entirely from scratch and includes:
- ✅ A dual-channel system that shows the live market structure
- ✅ Entry signals based on price behavior around key zones
- ✅ Volatility-adaptive SL/TP levels for realistic trade management
- ✅ Clean, non-repainting logic for both manual and automated use
The goal is to simplify structure trading and provide precise, repeatable entries in any market condition.
🧪 Use Cases
- Breakout mode – Ideal for trend continuation and momentum entries
- Rebound mode – Great for reversals, pullbacks, and range-bound markets
- Can be used standalone or combined with volume/trend filters
⚠️ Disclaimer
This tool is intended for technical analysis and educational use. It does not predict future market direction and should be used with proper risk management and strategy confirmation.

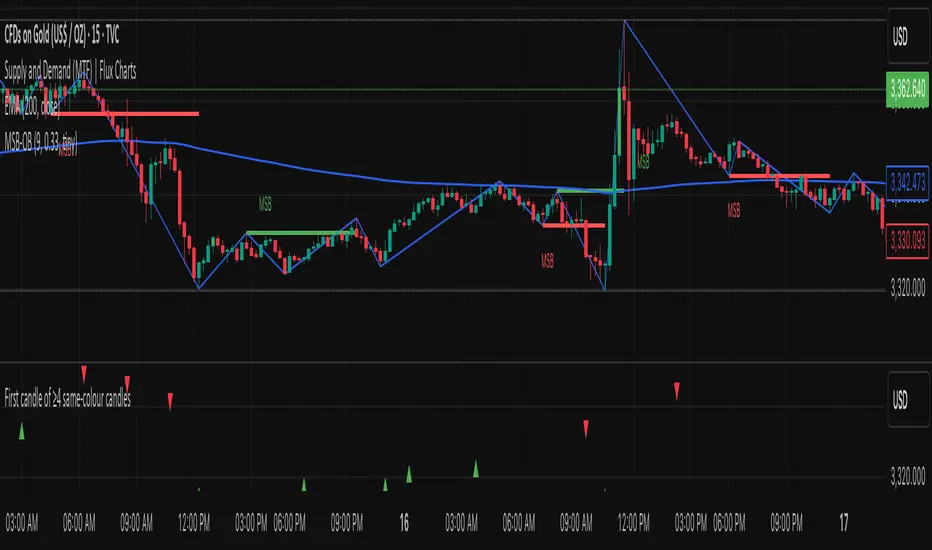
First candle of ≥4 same‑colour candlesClassifies each candle as bullish or bearish. A candle is considered bullish when the closing price is above the opening price, and bearish when the closing price is below the opening price
investopedia.com
; traditional charts depict bullish candles in green or white and bearish candles in red or black
investopedia.com
.
Counts consecutive candles of the same colour. Whenever a green candle appears, it increments a “bull run” counter; the counter resets to zero on a red candle. Likewise, it maintains a “bear run” counter that increments on red candles and resets on green candles.
Detects long runs of momentum. If a run of green candles reaches four or more bars, the indicator marks the very first candle of that sequence with a small green triangle below the bar. Similarly, if a run of red candles reaches four or more bars, it marks the first candle of that bearish run with a red triangle above the bar. Only the initial bar of each qualifying run is highlighted, even if the run later extends to five, six, or more candles.
3 EMA trong 1 NTT CAPITALThe 3 EMA in 1 NTT CAPITAL indicator provides an overview of the market trend with three EMAs of different periods, helping to identify entry and exit points more accurately, thus supporting traders in making quick and effective decisions.
