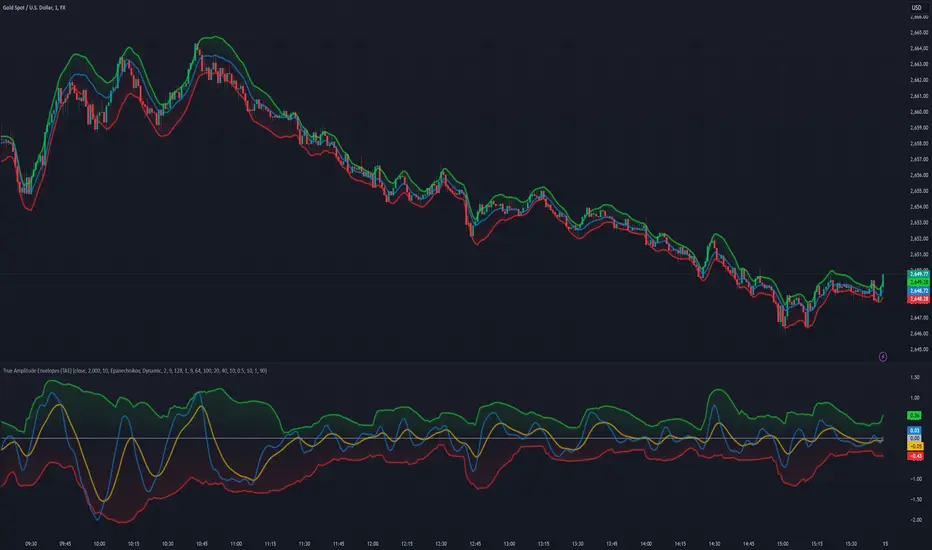
True Amplitude Envelopes (TAE)The True Envelopes indicator is an adaptation of the True Amplitude Envelope (TAE) method, based on the research paper " Improved Estimation of the Amplitude Envelope of Time Domain Signals Using True Envelope Cepstral Smoothing " by Caetano and Rodet. This indicator aims to create an asymmetric price envelope with strong predictive power, closely following the methodology outlined in the paper.
Due to the inherent limitations of Pine Script, the indicator utilizes a Kernel Density Estimator (KDE) in place of the original Cepstral Smoothing technique described in the paper. While this approach was chosen out of necessity rather than superiority, the resulting method is designed to be as effective as possible within the constraints of the Pine environment.
This indicator is ideal for traders seeking an advanced tool to analyze price dynamics, offering insights into potential price movements while working within the practical constraints of Pine Script. Whether used in dynamic mode or with a static setting, the True Envelopes indicator helps in identifying key support and resistance levels, making it a valuable asset in any trading strategy.
Key Features:
Dynamic Mode: The indicator dynamically estimates the fundamental frequency of the price, optimizing the envelope generation process in real-time to capture critical price movements.
High-Pass Filtering: Uses a high-pass filtered signal to identify and smoothly interpolate price peaks, ensuring that the envelope accurately reflects significant price changes.
Kernel Density Estimation: Although implemented as a workaround, the KDE technique allows for flexible and adaptive smoothing of the envelope, aimed at achieving results comparable to the more sophisticated methods described in the original research.
Symmetric and Asymmetric Envelopes: Provides options to select between symmetric and asymmetric envelopes, accommodating various trading strategies and market conditions.
Smoothness Control: Features adjustable smoothness settings, enabling users to balance between responsiveness and the overall smoothness of the envelopes.
The True Envelopes indicator comes with a variety of input settings that allow traders to customize the behavior of the envelopes to match their specific trading needs and market conditions. Understanding each of these settings is crucial for optimizing the indicator's performance.
Main Settings
Source: This is the data series on which the indicator is applied, typically the closing price (close). You can select other price data like open, high, low, or a custom series to base the envelope calculations.
History: This setting determines how much historical data the indicator should consider when calculating the envelopes. A value of 0 will make the indicator process all available data, while a higher value restricts it to the most recent n bars. This can be useful for reducing the computational load or focusing the analysis on recent market behavior.
Iterations: This parameter controls the number of iterations used in the envelope generation algorithm. More iterations will typically result in a smoother envelope, but can also increase computation time. The optimal number of iterations depends on the desired balance between smoothness and responsiveness.
Kernel Style: The smoothing kernel used in the Kernel Density Estimator (KDE). Available options include Sinc, Gaussian, Epanechnikov, Logistic, and Triangular. Each kernel has different properties, affecting how the smoothing is applied. For example, Gaussian provides a smooth, bell-shaped curve, while Epanechnikov is more efficient computationally with a parabolic shape.
Envelope Style: This setting determines whether the envelope should be Static or Dynamic. The Static mode applies a fixed period for the envelope, while the Dynamic mode automatically adjusts the period based on the fundamental frequency of the price data. Dynamic mode is typically more responsive to changing market conditions.
High Q: This option controls the quality factor (Q) of the high-pass filter. Enabling this will increase the Q factor, leading to a sharper cutoff and more precise isolation of high-frequency components, which can help in better identifying significant price peaks.
Symmetric: This setting allows you to choose between symmetric and asymmetric envelopes. Symmetric envelopes maintain an equal distance from the central price line on both sides, while asymmetric envelopes can adjust differently above and below the price line, which might better capture market conditions where upside and downside volatility are not equal.
Smooth Envelopes: When enabled, this setting applies additional smoothing to the envelopes. While this can reduce noise and make the envelopes more visually appealing, it may also decrease their responsiveness to sudden market changes.
Dynamic Settings
Extra Detrend: This setting toggles an additional high-pass filter that can be applied when using a long filter period. The purpose is to further detrend the data, ensuring that the envelope focuses solely on the most recent price oscillations.
Filter Period Multiplier: This multiplier adjusts the period of the high-pass filter dynamically based on the detected fundamental frequency. Increasing this multiplier will lengthen the period, making the filter less sensitive to short-term price fluctuations.
Filter Period (Min) and Filter Period (Max): These settings define the minimum and maximum bounds for the high-pass filter period. They ensure that the filter period stays within a reasonable range, preventing it from becoming too short (and overly sensitive) or too long (and too sluggish).
Envelope Period Multiplier: Similar to the filter period multiplier, this adjusts the period for the envelope generation. It scales the period dynamically to match the detected price cycles, allowing for more precise envelope adjustments.
Envelope Period (Min) and Envelope Period (Max): These settings establish the minimum and maximum bounds for the envelope period, ensuring the envelopes remain adaptive without becoming too reactive or too slow.
Static Settings
Filter Period: In static mode, this setting determines the fixed period for the high-pass filter. A shorter period will make the filter more responsive to price changes, while a longer period will smooth out more of the price data.
Envelope Period: This setting specifies the fixed period used for generating the envelopes in static mode. It directly influences how tightly or loosely the envelopes follow the price action.
TAE Smoothing: This controls the degree of smoothing applied during the TAE process in static mode. Higher smoothing values result in more gradual envelope curves, which can be useful in reducing noise but may also delay the envelope’s response to rapid price movements.
Visual Settings
Top Band Color: This setting allows you to choose the color for the upper band of the envelope. This band represents the resistance level in the price action.
Bottom Band Color: Similar to the top band color, this setting controls the color of the lower band, which represents the support level.
Center Line Color: This is the color of the central price line, often referred to as the carrier. It represents the detrended price around which the envelopes are constructed.
Line Width: This determines the thickness of the plotted lines for the top band, bottom band, and center line. Thicker lines can make the envelopes more visible, especially when overlaid on price data.
Fill Alpha: This controls the transparency level of the shaded area between the top and bottom bands. A lower alpha value will make the fill more transparent, while a higher value will make it more opaque, helping to highlight the envelope more clearly.
The envelopes generated by the True Envelopes indicator are designed to provide a more precise and responsive representation of price action compared to traditional methods like Bollinger Bands or Keltner Channels. The core idea behind this indicator is to create a price envelope that smoothly interpolates the significant peaks in price action, offering a more accurate depiction of support and resistance levels.
One of the critical aspects of this approach is the use of a high-pass filtered signal to identify these peaks. The high-pass filter serves as an effective method of detrending the price data, isolating the rapid fluctuations in price that are often lost in standard trend-following indicators. By filtering out the lower frequency components (i.e., the trend), the high-pass filter reveals the underlying oscillations in the price, which correspond to significant peaks and troughs. These oscillations are crucial for accurately constructing the envelope, as they represent the most responsive elements of the price movement.
The algorithm works by first applying the high-pass filter to the source price data, effectively detrending the series and isolating the high-frequency price changes. This filtered signal is then used to estimate the fundamental frequency of the price movement, which is essential for dynamically adjusting the envelope to current market conditions. By focusing on the peaks identified in the high-pass filtered signal, the algorithm generates an envelope that is both smooth and adaptive, closely following the most significant price changes without overfitting to transient noise.
Compared to traditional envelopes and bands, such as Bollinger Bands and Keltner Channels, the True Envelopes indicator offers several advantages. Bollinger Bands, which are based on standard deviations, and Keltner Channels, which use the average true range (ATR), both tend to react to price volatility but do not necessarily follow the peaks and troughs of the price with precision. As a result, these traditional methods can sometimes lag behind or fail to capture sudden shifts in price momentum, leading to either false signals or missed opportunities.
In contrast, the True Envelopes indicator, by using a high-pass filtered signal and a dynamic period estimation, adapts more quickly to changes in price behavior. The envelopes generated by this method are less prone to the lag that often affects standard deviation or ATR-based bands, and they provide a more accurate representation of the price's immediate oscillations. This can result in better predictive power and more reliable identification of support and resistance levels, making the True Envelopes indicator a valuable tool for traders looking for a more responsive and precise approach to market analysis.
In conclusion, the True Envelopes indicator is a powerful tool that blends advanced theoretical concepts with practical implementation, offering traders a precise and responsive way to analyze price dynamics. By adapting the True Amplitude Envelope (TAE) method through the use of a Kernel Density Estimator (KDE) and high-pass filtering, this indicator effectively captures the most significant price movements, providing a more accurate depiction of support and resistance levels compared to traditional methods like Bollinger Bands and Keltner Channels. The flexible settings allow for extensive customization, ensuring the indicator can be tailored to suit various trading strategies and market conditions.
Bands
Kalman PredictorThe **Kalman Predictor** indicator is a powerful tool designed for traders looking to enhance their market analysis by smoothing price data and projecting future price movements. This script implements a Kalman filter, a statistical method for noise reduction, to dynamically estimate price trends and velocity. Combined with ATR-based confidence bands, it provides actionable insights into potential price movement, while offering clear trend and momentum visualization.
---
#### **Key Features**:
1. **Kalman Filter Smoothing**:
- Dynamically estimates the current price state and velocity to filter out market noise.
- Projects three future price levels (`Next Bar`, `Next +2`, `Next +3`) based on velocity.
2. **Dynamic Confidence Bands**:
- Confidence bands are calculated using ATR (Average True Range) to reflect market volatility.
- Visualizes potential price deviation from projected levels.
3. **Trend Visualization**:
- Color-coded prediction dots:
- **Green**: Indicates an upward trend (positive velocity).
- **Red**: Indicates a downward trend (negative velocity).
- Dynamically updated label displaying the current trend and velocity value.
4. **User Customization**:
- Inputs to adjust the process and measurement noise for the Kalman filter (`q` and `r`).
- Configurable ATR multiplier for confidence bands.
- Toggleable trend label with adjustable positioning.
---
#### **How It Works**:
1. **Kalman Filter Core**:
- The Kalman filter continuously updates the estimated price state and velocity based on real-time price changes.
- Projections are based on the current price trend (velocity) and extend into the future (Next Bar, +2, +3).
2. **Confidence Bands**:
- Calculated using ATR to provide a dynamic range around the projected future prices.
- Indicates potential volatility and helps traders assess risk-reward scenarios.
3. **Trend Label**:
- Updates dynamically on the last bar to show:
- Current trend direction (Up/Down).
- Velocity value, providing insight into the expected magnitude of the price movement.
---
#### **How to Use**:
- **Trend Analysis**:
- Observe the direction and spacing of the prediction dots relative to current candles.
- Larger spacing indicates a potential strong move, while clustering suggests consolidation.
- **Risk Management**:
- Use the confidence bands to gauge potential price volatility and set stop-loss or take-profit levels accordingly.
- **Pullback Detection**:
- Look for flattening or clustering of dots during trends as a signal of potential pullbacks or reversals.
---
#### **Customizable Inputs**:
- **Kalman Filter Parameters**:
- `lookback`: Adjusts the smoothing window.
- `q`: Process noise (higher values make the filter more reactive to changes).
- `r`: Measurement noise (controls sensitivity to price deviations).
- **Confidence Bands**:
- `band_multiplier`: Multiplies ATR to define the range of confidence bands.
- **Visualization**:
- `show_label`: Option to toggle the trend label.
- `label_offset`: Adjusts the label’s distance from the price for better visibility.
---
#### **Examples of Use**:
- **Scalping**: Use on lower timeframes (e.g., 1-minute, 5-minute) to detect short-term price trends and reversals.
- **Swing Trading**: Identify pullbacks or continuations on higher timeframes (e.g., 4-hour, daily) by observing the prediction dots and confidence bands.
- **Risk Assessment**: Confidence bands help visualize potential price volatility, aiding in the placement of stops and targets.
---
#### **Notes for Traders**:
- The **Kalman Predictor** does not predict the future with certainty but provides a statistically informed estimate of price movement.
- Confidence bands are based on historical volatility and should be used as guidelines, not guarantees.
- Always combine this tool with other analysis techniques for optimal results.
---
This script is open-source, and the Kalman filter logic has been implemented uniquely to integrate noise reduction with dynamic confidence band visualization. If you find this indicator useful, feel free to share your feedback and experiences!
---
#### **Credits**:
This script was developed leveraging the statistical principles of Kalman filtering and is entirely original. It incorporates ATR for dynamic confidence band calculations to enhance trader usability and market adaptability.

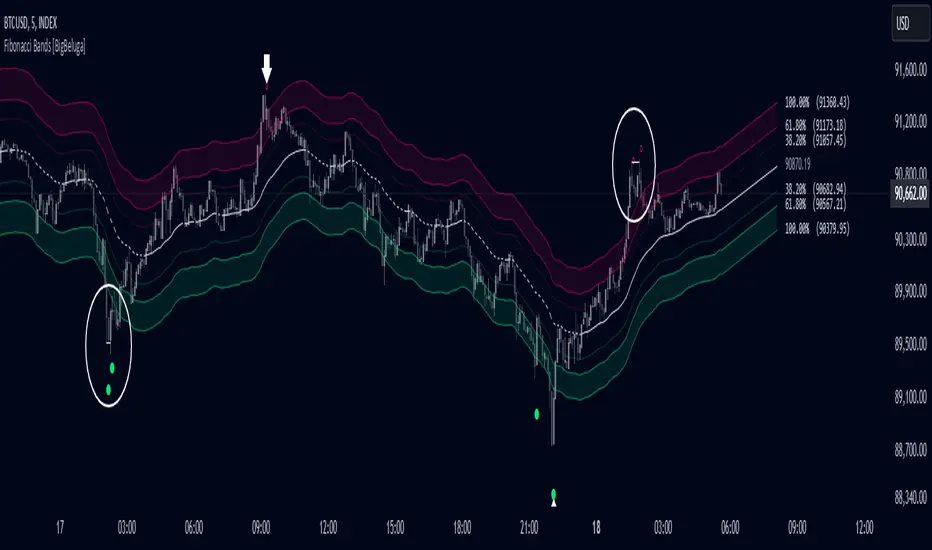
Fibonacci Bands [BigBeluga]The Fibonacci Band indicator is a powerful tool for identifying potential support, resistance, and mean reversion zones based on Fibonacci ratios. It overlays three sets of Fibonacci ratio bands (38.2%, 61.8%, and 100%) around a central trend line, dynamically adapting to price movements. This structure enables traders to track trends, visualize potential liquidity sweep areas, and spot reversal points for strategic entries and exits.
🔵 KEY FEATURES & USAGE
Fibonacci Bands for Support & Resistance:
The Fibonacci Band indicator applies three key Fibonacci ratios (38.2%, 61.8%, and 100%) to construct dynamic bands around a smoothed price. These levels often act as critical support and resistance areas, marked with labels displaying the percentage and corresponding price. The 100% band level is especially crucial, signaling potential liquidity sweep zones and reversal points.
Mean Reversion Signals at 100% Bands:
When price moves above or below the 100% band, the indicator generates mean reversion signals.
Trend Detection with Midline:
The central line acts as a trend-following tool: when solid, it indicates an uptrend, while a dashed line signals a downtrend. This adaptive midline helps traders assess the prevailing market direction while keeping the chart clean and intuitive.
Extended Price Projections:
All Fibonacci bands extend to future bars (default 30) to project potential price levels, providing a forward-looking perspective on where price may encounter support or resistance. This feature helps traders anticipate market structure in advance and set targets accordingly.
Liquidity Sweep:
--
-Liquidity Sweep at Previous Lows:
The price action moves below a previous low, capturing sell-side liquidity (stop-losses from long positions or entries for breakout traders).
The wick suggests that the price quickly reversed, leaving a failed breakout below support.
This is a classic liquidity grab, often indicating a bullish reversal .
-Liquidity Sweep at Previous Highs:
The price spikes above a prior high, sweeping buy-side liquidity (stop-losses from short positions or breakout entries).
The wick signifies rejection, suggesting a failed breakout above resistance.
This is a bearish liquidity sweep , often followed by a mean reversion or a downward move.
Display Customization:
To declutter the chart, traders can choose to hide Fibonacci levels and only display overbought/oversold zones along with the trend-following midline and mean reversion signals. This option enables a clearer focus on key reversal areas without additional distractions.
🔵 CUSTOMIZATION
Period Length: Adjust the length of the smoothed moving average for more reactive or smoother bands.
Channel Width: Customize the width of the Fibonacci channel.
Fibonacci Ratios: Customize the Fibonacci ratios to reflect personal preference or unique market behaviors.
Future Projection Extension: Set the number of bars to extend Fibonacci bands, allowing flexibility in projecting price levels.
Hide Fibonacci Levels: Toggle the visibility of Fibonacci levels for a cleaner chart focused on overbought/oversold regions and midline trend signals.
Liquidity Sweep: Toggle the visibility of Liquidity Sweep points
The Fibonacci Band indicator provides traders with an advanced framework for analyzing market structure, liquidity sweeps, and trend reversals. By integrating Fibonacci-based levels with trend detection and mean reversion signals, this tool offers a robust approach to navigating dynamic price action and finding high-probability trading opportunities.
Holt-Winters Forecast BandsDescription:
The Holt-Winters Adaptive Bands indicator combines seasonal trend forecasting with adaptive volatility bands. It uses the Holt-Winters triple exponential smoothing model to project future price trends, while Nadaraya-Watson smoothed bands highlight dynamic support and resistance zones.
This indicator is ideal for traders seeking to predict future price movements and visualize potential market turning points. By focusing on broader seasonal and trend data, it provides insight into both short- and long-term market directions. It’s particularly effective for swing trading and medium-to-long-term trend analysis on timeframes like daily and 4-hour charts, although it can be adjusted for other timeframes.
Key Features:
Holt-Winters Forecast Line: The core of this indicator is the Holt-Winters model, which uses three components — level, trend, and seasonality — to project future prices. This model is widely used for time-series forecasting, and in this script, it provides a dynamic forecast line that predicts where price might move based on historical patterns.
Adaptive Volatility Bands: The shaded areas around the forecast line are based on Nadaraya-Watson smoothing of historical price data. These bands provide a visual representation of potential support and resistance levels, adapting to recent volatility in the market. The bands' fill colors (red for upper and green for lower) allow traders to identify potential reversal zones without cluttering the chart.
Dynamic Confidence Levels: The indicator adapts its forecast based on market volatility, using inputs such as average true range (ATR) and price deviations. This means that in high-volatility conditions, the bands may widen to account for increased price movements, helping traders gauge the current market environment.
How to Use:
Forecasting: Use the forecast line to gain insight into potential future price direction. This line provides a directional bias, helping traders anticipate whether the price may continue along a trend or reverse.
Support and Resistance Zones: The shaded bands act as dynamic support and resistance zones. When price enters the upper (red) band, it may be in an overbought area, while the lower (green) band may indicate oversold conditions. These bands adjust with volatility, so they reflect the current market conditions rather than fixed levels.
Timeframe Recommendations:
This indicator performs best on daily and 4-hour charts due to its reliance on trend and seasonality. It can be used on lower timeframes, but accuracy may vary due to increased price noise.
For traders looking to capture swing trades, the daily and 4-hour timeframes provide a balance of trend stability and signal reliability.
Adjustable Settings:
Alpha, Beta, and Gamma: These settings control the level, trend, and seasonality components of the forecast. Alpha is generally the most sensitive setting for adjusting responsiveness to recent price movements, while Beta and Gamma help fine-tune the trend and seasonal adjustments.
Band Smoothing and Deviation: These settings control the lookback period and width of the volatility bands, allowing users to customize how closely the bands follow price action.
Parameters:
Prediction Length: Sets the length of the forecast, determining how far into the future the prediction line extends.
Season Length: Defines the seasonality cycle. A setting of 14 is typical for bi-weekly cycles, but this can be adjusted based on observed market cycles.
Alpha, Beta, Gamma: These parameters adjust the Holt-Winters model's sensitivity to recent prices, trends, and seasonal patterns.
Band Smoothing: Determines the smoothing applied to the bands, making them either more reactive or smoother.
Ideal Use Cases:
Swing Trading and Trend Following: The Holt-Winters model is particularly suited for capturing larger market trends. Use the forecast line to determine trend direction and the bands to gauge support/resistance levels for potential entries or exits.
Identifying Reversal Zones: The adaptive bands act as dynamic overbought and oversold zones, giving traders potential reversal areas when price reaches these levels.
Important Notes:
No Buy/Sell Signals: This indicator does not produce direct buy or sell signals. It’s intended for visual trend analysis and support/resistance identification, leaving trade decisions to the user.
Not for High-Frequency Trading: Due to the nature of the Holt-Winters model, this indicator is optimized for higher timeframes like the daily and 4-hour charts. It may not be suitable for high-frequency or scalping strategies on very short timeframes.
Adjust for Volatility: If using the indicator on lower timeframes or more volatile assets, consider adjusting the band smoothing and prediction length settings for better responsiveness.

Nami Bands with Future Projection [FXSMARTLAB]The Nami Bands ( Inspired by "Nami", meaning "wave" in Japanese) are two dynamic bands around price data: an upper band and a lower band. These bands are calculated based on an Asymmetric Linear Weighted Moving Average of price and a similarly asymmetric weighted standard deviation. This weighting method emphasizes recent data without overreacting to short-term price changes, thus smoothing the bands in line with prevailing market conditions.
Advantages and Benefits of Using the Indicator
* Volatility Analysis: The bands expand and contract with market volatility, helping traders assess periods of high and low volatility. Narrow bands indicate low volatility and potential consolidation, while wide bands suggest increased volatility and potential price movement.
* Dynamic Support and Resistance Levels: By adapting to recent trends, the bands serve as dynamic support (lower band) and resistance (upper band) levels, which traders can use for entry and exit signals.
* Overbought and Oversold Conditions: When prices reach or cross the bands’ outer limits, it may signal overbought (upper band) or oversold (lower band) conditions, suggesting possible reversals or trend slowdowns.
* Trend Confirmation and Continuation: The slope of the central moving average confirms trend direction. An upward slope generally indicates a bullish trend, while a downward slope suggests a bearish trend.
* Anticipating Breakouts and Reversals: The projected bands help identify where price movements may head, allowing traders to anticipate potential breakouts or reversals based on projected support and resistance.
Indicator Parameters
Source (src): The price data used for calculations, by default set to the average of high, low, and close (hlc3).
Length: The period over which calculations are made, defaulted to 50 periods.
Projection Length: The length for future band projection, defaulted to 20 periods.
StdDev Multiplier (mult): A multiplier for the standard deviation, defaulted to 2.0.
Internal Calculations
1. Asymmetric Linear Weighted Moving Average of Price
The indicator uses an Asymmetric Linear Weighted Moving Average (ALWMA) to calculate a central value for the price.
Asymmetric Weighting: This weighting technique assigns the highest weight to the most recent value, with weights decreasing linearly as the data points become older. This structure provides a nuanced focus on recent price trends, while still reflecting historical price levels.
2. Asymmetric Weighted Standard Deviation
The standard deviation in this indicator is also calculated using asymmetric weighting:
Purpose of Asymmetric Weighted Standard Deviation: Rather than aiming for high sensitivity to recent data, this standard deviation measure smooths out volatility by integrating weighted values across the length period, stabilizing the overall measurement of price variability.
This approach yields a balanced view of volatility, capturing broader market trends without being overly reactive to short-lived changes.
3. Upper and Lower Bands
The upper and lower bands are created by adding and subtracting the asymmetric weighted standard deviation from the asymmetric weighted average of price. This creates a dynamic envelope that adjusts to both recent price trends and the smoothed volatility measure:
These bands represent adaptable support and resistance levels that shift with recent market volatility.
Future Band Projection
The indicator provides a projection of the bands based on their current slope.
1. Calculating the Slope of the Bands
The slope for each band is derived from the difference between the current and previous values of each band.
2. Projecting the Bands into the Future
For each period into the future, up to the defined Projection Length, the bands are projected using the current slope.
This feature offers an anticipated view of where support and resistance levels may move, providing insight for future market behavior based on current trends.

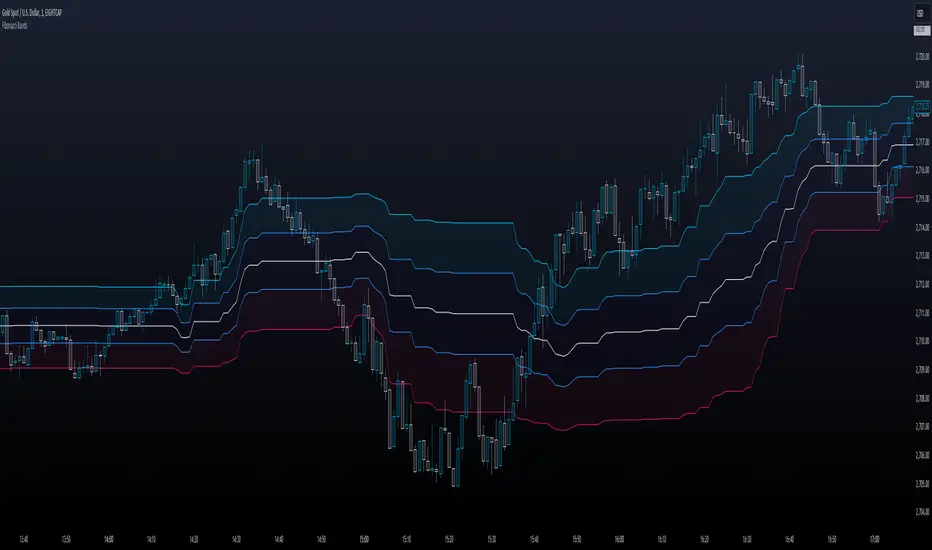
Fibonacci BandsDescription
This indicator dynamically calculates Fibonacci retracement levels based on the highest high and lowest low over a specified lookback period. The key Fibonacci levels (0.236, 0.382, 0.5, 0.618, and 0.786) are plotted on the chart, with shaded areas between these levels for visual guidance.
How it works
The script computes the highest high (hh) and the lowest low (ll) over the defined length.
It calculates the price range (delta) as the difference between the highest high and the lowest low.
Fibonacci levels are then determined using the formula: ℎℎ − (delta × Fibonacci ratio)
Each Fibonacci level is then plotted as a line with a specific color.
Key Features
Customizable Length: Users can adjust the lookback period to suit their trading strategy.
Multiple Fibonacci Levels: Includes common Fibonacci retracement levels, providing traders with a comprehensive view of potential support and resistance areas.
Visual Fillings: The script includes customizable shading between levels, which helps traders quickly identify key zones (like the "Golden Zone" between 0.5 and 0.618).
Unique Points
Fibonacci Focus: This script is specifically designed around Fibonacci retracement levels, which are popular among technical traders for identifying potential reversal points.
Dynamic Range Calculation: The use of the highest high and lowest low within a user-defined period offers a dynamic approach to adapting to changing market conditions.
How to use it
Adjust the length parameter (default is 60) to determine how many bars back the indicator will calculate the highest high and lowest low. A longer length may provide a broader perspective of price action, while a shorter length may react more quickly to recent price changes.
Observe the plotted Fibonacci levels: 0.236, 0.382, 0.5, 0.618, and 0.786. These levels often act as potential support and resistance points. Pay attention to how price interacts with these levels.
When the price approaches a Fibonacci level, consider it a potential reversal point. The filled areas between the Fibonacci levels indicate zones where price might consolidate or reverse. The "Golden Zone" (between 0.5 and 0.618) is particularly significant; many traders watch this area closely for potential entry points in an uptrend or exit points in a downtrend.
E9 Bollinger RangeThe E9 Bollinger Range is a technical trading tool that leverages Bollinger Bands to track volatility and price deviations, along with additional trend filtering via EMAs.
The script visually enhances price action with a combination of trend-filtering EMAs, bar colouring for trend direction, signals to indicate potential buy and sell points based on price extension and engulfing patterns.
Here’s a breakdown of its key components:
Bollinger Bands: The strategy plots multiple Bollinger Band deviations to create different price levels. The furthest deviation bands act as warning signs for traders when price extends significantly, signaling potential overbought or oversold conditions.
Bar Colouring: Visual bar colouring is applied to clearly indicate trend direction: green bars for an uptrend and red bars for a downtrend.
EMA Filtering: Two EMAs (50 and 200) are used to help filter out false signals, giving traders a better sense of the underlying trend.
This combination of signals, visual elements, and trend filtering provides traders with a systematic approach to identifying price deviations and taking advantage of market corrections.
Brief History of Bollinger Bands
Bollinger Bands were developed by John Bollinger in the early 1980s as a tool to measure price volatility in financial markets. The bands consist of a moving average (typically 20 periods) with upper and lower bands placed two standard deviations away. These bands expand and contract based on market volatility, offering traders a visual representation of price extremes and potential reversal zones.
John Bollinger’s work revolutionized technical analysis by incorporating volatility into trend detection. His bands remain widely used across markets, including stocks, commodities, and cryptocurrencies. With the ability to highlight overbought and oversold conditions, Bollinger Bands have become a staple in many trading strategies.

Linear Regression ChannelLinear Regression Channel Indicator
Overview:
The Linear Regression Channel Indicator is a versatile tool designed for TradingView to help traders visualize price trends and potential reversal points. By calculating and plotting linear regression channels, bands, and future projections, this indicator provides comprehensive insights into market dynamics. It can highlight overbought and oversold conditions, identify trend direction, and offer visual cues for future price movements.
Key Features:
Linear Regression Bands:
Input: Plot Linear Regression Bands
Description: Draws bands based on linear regression calculations, representing overbought and oversold levels.
Customizable Parameters:
Length: Defines the look-back period for the regression calculation.
Deviation: Determines the width of the bands based on standard deviations.
Linear Regression Channel:
Input: Plot Linear Regression Channel
Description: Plots a channel using linear regression to visualize the main trend.
Customizable Parameters:
Channel Length: Defines the look-back period for the channel calculation.
Deviation: Determines the channel's width.
Future Projection Channel:
Input: Plot Future Projection of Linear Regression
Description: Projects a linear regression channel into the future, aiding in forecasting potential price movements.
Customizable Parameters:
Length: Defines the look-back period for the projection calculation.
Deviation: Determines the width of the projected channel.
Arrow Direction Indicator:
Input: Plot Arrow Direction
Description: Displays directional arrows based on future projection, indicating expected price movement direction.
Color-Coded Price Bars:
Description: Colors the price bars based on their position within the regression bands or channel, providing a heatmap-like visualization.
Dynamic Visualization:
Colors: Uses a gradient color scheme to highlight different conditions, such as uptrend, downtrend, and mid-levels.
Labels and Markers: Plots visual markers for significant price levels and conditions, enhancing interpretability.
Usage Notes
Setting the Length:
Adjust the look-back period (Length) to suit the timeframe you are analyzing. Shorter lengths are responsive to recent price changes, while longer lengths provide a broader view of the trend.
Interpreting Bands and Channels:
The bands and channels help identify overbought and oversold conditions. Price moving above the upper band or channel suggests overbought conditions, while moving below the lower band or channel indicates oversold conditions.
Using the Future Projection:
Enable the future projection channel to anticipate potential price movements. This can be particularly useful for setting target prices or stop-loss levels based on expected trends.
Arrow Direction Indicator:
Use the arrow direction indicator to quickly grasp the expected price movement direction. An upward arrow indicates a potential uptrend, while a downward arrow suggests a potential downtrend.
Color-Coded Price Bars:
The color of the price bars changes based on their relative position within the regression bands or channel. This heatmap visualization helps quickly identify bullish, bearish, and neutral conditions.
Dynamic Adjustments:
The indicator dynamically adjusts its visual elements based on user settings and market conditions, ensuring that the most relevant information is always displayed.
Visual Alerts:
Pay attention to the labels and markers on the chart indicating significant events, such as crossovers and breakouts. These visual alerts help in making informed trading decisions.
The Linear Regression Channel Indicator is a powerful tool for traders looking to enhance their technical analysis. By offering multiple regression-based visualizations and customizable parameters, it helps identify key market conditions, trends, and potential reversal points. Whether you are a day trader or a long-term investor, this indicator can provide valuable insights to improve your trading strategy.

FVG Channel [LuxAlgo]The FVG Channel indicator displays a channel constructed from the averages of unmitigated historical fair value gaps (FVG), allowing to identify trends and potential reversals in the market.
Users can control the amount of FVGs to consider for the calculation of the channels, as well as their degree of smoothness through user settings.
🔶 USAGE
The FVG Channel is constructed by averaging together recent unmitigated Bullish FVGs (contributing to the creation of the upper bands), and Bearish unmitigated FVGs (contributing to the creation of the lower bands) within a lookback determined by the user. A higher lookback will return longer-term indications from the indicator.
The channel includes 5 bands, with one upper and one lower outer extremities, as well as an inner series of values determined using the Fibonacci ratios (respectively 0.786, 0.5, 0.236) from the channel's outer extremities.
An uptrend can be identified by price holding above the inner upper band (obtained from the 0.786 ratio), this band can also provide occasional support when the price retraces to it while in an uptrend.
Breaking below the inner upper band with an unwillingness to reach above again is a clear sign of hesitation in the market and can be indicative of an upcoming consolidation or reversal.
This can directly be applied to downtrends as well, below are examples displaying both scenarios.
Uptrend Example:
Downtrend Example:
🔹 Breakout Levels
When the price mitigates all FVGs in a single direction except for 1, the indicator will display a "Breakout Level". This is the level that price will need to cross in order for all FVGs in that direction to be mitigated, because of this they can also be aptly called "Last Stand Levels".
These levels can be considered as potential support and resistance levels, however, should always be monitored for breakouts since a substantial push above or below these points would indicate strong momentum.
🔹 Signals
The indicator includes Bullish and Bearish Signals, these signals fire when all FVGs for a single direction have been mitigated and an engulfing candle occurs in the opposite direction. These are reversal signals and should be used alongside other indicators to appropriately manage risk.
Note: When all FVGs in a single direction have been mitigated, the candles will change colors accordingly.
🔶 DETAILS
The script uses a typical identification method for FVGs. Once identified, the script collects and stores the mitigation levels of the respective bullish and bearish FVGs:
For Bullish FVGs this is the bottom of the FVG.
For Bearish FVGs this is the top of the FVG.
The data is managed to only consider a specific amount of FVG mitigation levels, determined by the set "Unmitigated FVG Lookback". If an FVG is mitigated, it frees up a spot in the memory for a new FVG, however, if the memory is full, the oldest will be deleted.
The averages displayed (Channel Upper and Lower) are created from 2 calculation steps, the first step involves taking the raw average of the FVG mitigation levels, and the second step applies a simple moving average (SMA) smoothing of the precedent obtained averages.
Note: To view the mitigation levels average obtained in the first step, the "Smoothing Length" can be set to 1.
🔶 SETTINGS
Unmitigated FVG Lookback: Sets the maximum number of Unmitigated FVG mitigation levels that the script will use to calculate the channel.
Smoothing Length: Sets the smoothing length for the channel to reduce noise from the raw data.

Periodic Linear Regressions [LuxAlgo]The Periodic Linear Regressions (PLR) indicator calculates linear regressions periodically (similar to the VWAP indicator) based on a user-set period (anchor).
This allows for estimating underlying trends in the price, as well as providing potential supports/resistances.
🔶 USAGE
The Periodic Linear Regressions indicator calculates a linear regression over a user-selected interval determined from the selected "Anchor Period".
The PLR can be visualized as a regular linear regression (Static), with a fit readjusting for new data points until the end of the selected period, or as a moving average (Rolling), with new values obtained from the last point of a linear regression fitted over the calculation interval. While the static method line is prone to repainting, it has value since it can further emphasize the linearity of an underlying trend, as well as suggest future trend directions by extrapolating the fit.
Extremities are included in the indicator, these are obtained from the root mean squared error (RMSE) between the price and calculated linear regression. The Multiple setting allows the users to control how far each extremity is from the other.
Periodic Linear Regressions can be helpful in finding support/resistance areas or even opportunities when ranging in a channel.
The anchor - where a new period starts - can be shown (in this case in the top right corner).
The shown bands can be visualized by enabling Show Extremities in settings ( Rolling or Static method).
The script includes a background gradient color option for the bands, which only applies when using the Rolling method.
The indicator colors can be suggestive of the detected trend and are determined as follows:
Method Rolling: a gradient color between red and green indicates the trend; more green if the output is rising, suggesting an uptrend, and more red if it is decreasing, suggesting a downtrend.
Method Static: green if the slope of the line is positive, suggesting an uptrend, red if negative, suggesting a downtrend.
🔶 DETAILS
🔹 Anchor Type
When the Anchor Type is set to Periodic , the indicator will be reset when the "Anchor Period" changes, after which calculations will start again.
An anchored rolling line set at First Bar won't reset at a new session; it will continue calculating the linear regression from the first bar to the last; in other words, every bar is included in the calculation. This can be useful to detect potential long-term tops/bottoms.
Note that a linear regression needs at least two values for its calculation, which explains why you won't see a static line at the first bar of the session. The rolling linear regression will only show from the 3rd bar of the session since it also needs a previous value.
🔹 Rolling/Static
When Anchor Type is set at Periodic , a linear regression is calculated between the first bar of the chosen session and the current bar, aiming to find the line that best fits the dataset.
The example above shows the lines drawn during the session. The offered script, though, shows the last calculated point connected to the previous point when the Rolling method is chosen, while the Static method shows the latest line.
Note that linear regression needs at least two values, which explains why you won't see a static line at the first bar of the session. The rolling line will only show from the 3rd bar of the session since it also needs a previous value.
🔶 SETTINGS
Method: Indicator method used, with options: "Static" (straight line) / "Rolling" (rolling linear regression).
Anchor Type: "Periodic / First Bar" (the latter works only when "Method" is set to "Rolling").
Anchor Period: Only applicable when "Anchor Type" is set at "Periodic".
Source: open, high, low, close, ...
Multiple: Alters the width of the bands when "Show Extremities" is enabled.
Show Extremities: Display one upper and one lower extremity.
🔹 Color Settings
Mono Color: color when "Bicolor" is disabled
Bicolor: Toggle on/off + Colors
Gradient: Background color when "Show extremities" is enabled + level of gradient
🔹 Dashboard
Show Dashboard
Location of dashboard
Text size

Bitcoin Logarithmic Growth Curve 2024The Bitcoin logarithmic growth curve is a concept used to analyze Bitcoin's price movements over time. The idea is based on the observation that Bitcoin's price tends to grow exponentially, particularly during bull markets. It attempts to give a long-term perspective on the Bitcoin price movements.
The curve includes an upper and lower band. These bands often represent zones where Bitcoin's price is overextended (upper band) or undervalued (lower band) relative to its historical growth trajectory. When the price touches or exceeds the upper band, it may indicate a speculative bubble, while prices near the lower band may suggest a buying opportunity.
Unlike most Bitcoin growth curve indicators, this one includes a logarithmic growth curve optimized using the latest 2024 price data, making it, in our view, superior to previous models. Additionally, it features statistical confidence intervals derived from linear regression, compatible across all timeframes, and extrapolates the data far into the future. Finally, this model allows users the flexibility to manually adjust the function parameters to suit their preferences.
The Bitcoin logarithmic growth curve has the following function:
y = 10^(a * log10(x) - b)
In the context of this formula, the y value represents the Bitcoin price, while the x value corresponds to the time, specifically indicated by the weekly bar number on the chart.
How is it made (You can skip this section if you’re not a fan of math):
To optimize the fit of this function and determine the optimal values of a and b, the previous weekly cycle peak values were analyzed. The corresponding x and y values were recorded as follows:
113, 18.55
240, 1004.42
451, 19128.27
655, 65502.47
The same process was applied to the bear market low values:
103, 2.48
267, 211.03
471, 3192.87
676, 16255.15
Next, these values were converted to their linear form by applying the base-10 logarithm. This transformation allows the function to be expressed in a linear state: y = a * x − b. This step is essential for enabling linear regression on these values.
For the cycle peak (x,y) values:
2.053, 1.268
2.380, 3.002
2.654, 4.282
2.816, 4.816
And for the bear market low (x,y) values:
2.013, 0.394
2.427, 2.324
2.673, 3.504
2.830, 4.211
Next, linear regression was performed on both these datasets. (Numerous tools are available online for linear regression calculations, making manual computations unnecessary).
Linear regression is a method used to find a straight line that best represents the relationship between two variables. It looks at how changes in one variable affect another and tries to predict values based on that relationship.
The goal is to minimize the differences between the actual data points and the points predicted by the line. Essentially, it aims to optimize for the highest R-Square value.
Below are the results:
It is important to note that both the slope (a-value) and the y-intercept (b-value) have associated standard errors. These standard errors can be used to calculate confidence intervals by multiplying them by the t-values (two degrees of freedom) from the linear regression.
These t-values can be found in a t-distribution table. For the top cycle confidence intervals, we used t10% (0.133), t25% (0.323), and t33% (0.414). For the bottom cycle confidence intervals, the t-values used were t10% (0.133), t25% (0.323), t33% (0.414), t50% (0.765), and t67% (1.063).
The final bull cycle function is:
y = 10^(4.058 ± 0.133 * log10(x) – 6.44 ± 0.324)
The final bear cycle function is:
y = 10^(4.684 ± 0.025 * log10(x) – -9.034 ± 0.063)
The main Criticisms of growth curve models:
The Bitcoin logarithmic growth curve model faces several general criticisms that we’d like to highlight briefly. The most significant, in our view, is its heavy reliance on past price data, which may not accurately forecast future trends. For instance, previous growth curve models from 2020 on TradingView were overly optimistic in predicting the last cycle’s peak.
This is why we aimed to present our process for deriving the final functions in a transparent, step-by-step scientific manner, including statistical confidence intervals. It's important to note that the bull cycle function is less reliable than the bear cycle function, as the top band is significantly wider than the bottom band.
Even so, we still believe that the Bitcoin logarithmic growth curve presented in this script is overly optimistic since it goes parly against the concept of diminishing returns which we discussed in this post:
This is why we also propose alternative parameter settings that align more closely with the theory of diminishing returns.
Our recommendations:
Drawing on the concept of diminishing returns, we propose alternative settings for this model that we believe provide a more realistic forecast aligned with this theory. The adjusted parameters apply only to the top band: a-value: 3.637 ± 0.2343 and b-parameter: -5.369 ± 0.6264. However, please note that these values are highly subjective, and you should be aware of the model's limitations.
Conservative bull cycle model:
y = 10^(3.637 ± 0.2343 * log10(x) - 5.369 ± 0.6264)

Market Oracle Plus [ChartPrime]ChartPrime Oracle Plus combines actionable, elegant and functional indicators into a single toolkit. It builds upon previously laid out creations in order to create a more advanced experience. Combinations of both trend following and contrarian logic aim to provide traders with a deeper insight into market movements; aiming to assist in better entries and exits.
Designed and created by the ChartPrime team, this toolkit takes deeper level theory and expresses it in a usable format for traders. ChartPrime Oracle Plus is designed to satisfy and cover major trading theories allowing the user to pick and select the features that fit them.
Trend signals, Prime Ranges and Quantum Reactor
When using any indicator suite it is important to understand these tools are there to assist trading rather than to be a single source of truth. Functionality such as Auto Maximization of parameters is there to guide and enhance user experience, however it is important to be aware of overfitting results.
Plus features:
ChartPrime Market Oracle Plus has introduced some unique additions in order to enhance traders’ experiences.
Custom Signals: Toolkits and signals often limit traders to a single algorithm. This reduces flexibility and adaptability in the market. Traders will often want to develop their own systems without the constraints of an existing one. Market Oracle Plus introduces a custom signals builder; taking components in the toolkit and allowing them to be combined into a single signal/alert. Want a signal when the trend changes with bullish candlestick patterns? With a few clicks this can now be enabled. Traders can also set alerts on their custom signals making automating trades easier than ever.
Custom signals labelled with a cross
The Quantum tools. Looking at the tiny in the market and making it clearer.
Quantum Bands: The quantum bands provide areas of highly likely reversals to occur by analysing market momentum and noise. They can be used classically and are comparable in application to the commonly used bollinger bands. When price finds itself inside a zone it is more likely to reverse. This is excellent when used in confluence with other reversal indicators. The reason these bands are unique is their ability to adapt to trending markets allowing not only reversals to be identified in ranging markets but also trending ones leveraging volatility calculations. They also enable the user to use MTF functionality to load bands from higher timeframes. This allows users to have a broader perspective of support and resistance levels in the market.
The quantum bands are powerful for scalpers who want faster entries and exits. Entering a trade on a bands extremity can give earlier entries and exiting on the touch of the opposing band can serve as a great take profit.
Quantum Bands bounce
Quantum Reactor: The quantum reactor is a custom weighted moving average analyzing trends in the market. Unlike another moving averages; weighting has been considered to account for ranging markets. The Reactor will turn gray in a ranging market to avoid chop allowing for filtering of trades. This offers a unique insight into price action. Classical moving averages will constantly attempt to re-adapt to a trend whereas the Reactor will avoid adaptation where it sees fit.
Filtering a ranging market
Features included & Use cases:
Signal Mode: Select the type of assistive signals you are requiring. Provided are both trend following signals with self optimization using backtest results as well as reversal signals, aiming to provide real time tops and bottoms in markets. Both these signal modes can be fine tuned using the tuning input to refine signals to a trader's liking. The ChartPrime Auto Maximizer will automatically apply a backtested parameter and display the "best performing signals" on your chart. It is important to note this is not indicative of future results. ChartPrime Trend Signals leverage audio engineering inspired techniques and low-pass filters in order to achieve and attempt to produce lower lag response times and therefore is designed to have a uniqueness when compared to more classical trend following approaches.
Candle Highlighting: Choose between a clean gradient or more classical red/green coloring. These color the candles to assist with trend identification.
ChartPrime Dashboard: This redesigned dashboard provides 4 simple to interpret metrics. Firstly, the Optimal Tuning box provides a backtested result giving you the most accurate input. Again, it is important to note this is not indicative of future results. A Prime Score is also provided. This metric is a collection of ChartPrime trend following indicators bundled into a single item. It ranges from 0 (being a very bearish trend) to 10 (being a very bullish trend). 5 would indicate a ranging market. A consolidation score is also provided showing how "ranging" the market is. 10 being a low volatility and consolidating market and 0 being a more volatile and trending market which can assist the trader in avoiding ranges (if undesired). Finally the market prophecy gives simple forecasts in text form giving outlooks on potential activity.
The unique bar based visualization makes it clearer than ever to quantify key metrics on your chart.
Additional Features:
The Dynamic Reactor provides a simple band passing through the chart. This can provide assistance in support and resistance locations as well as identifying the trend direction expressed via green and red colors. Taking a moving average and applying unique low lag adaptivity calculations gives this plot a unique and fast behavior. This gives a unique edge to standard high length moving averages.
The Prime Ranges provide VWAP inspired real time actionable ranges on your chart. These ranges provide support and resistance levels as well as coloring, once again, there to aid trend identification. By generating a distribution and projecting it we produce real time levels for traders.
Candlestick structures analyze candlestick formation putting a spin on classical candlestick patterns and provide the most relevant formations on the chart. These are not classical and are filtered by further analyzing market activity. A trader's classic with a spin.
The Prime Trend Assistant provides a trend following dynamic support and resistance level. This makes it perfect to use in confluence or as a filter for other supporting indicators. This is an adaptive trend following system designed to handle volatility leveraging filter kernels as opposed to low pass filters.
Settings:
Signal Mode: Drop down to select the types of signals wanted
Tuning: Integer input to adjust signal's responsiveness. Lower inputs result in more frequent signals being produced.
Auto Maximizer Toggle: Automatically apply a backtested parameter to the signals
Dashboard Size: Drop down to select the size of the dashboard
Dashboard Position: Change the location of the dashboard on your chart
Additional Features: A set of toggles turning on/off these indicators.
Example Usecases:
Trend based confluences:
ChartPrime Oracle Plus provides classical (all be-it self optimizing) trend based signals. When trading, taking into consideration other forms of confluences are crucial. Take the image below:
Here we see the quantum reactor being green suggesting the market was in an upwards trend. We then see a sell signal appear. Knowing that we were in a macro uptrend allows us to filter out signals that go against this. Albeit basic; understanding multi-level confluence is key.
Features such as the Prime Ranges have duplicate usecases whereby a trend can be identified via the color of the bands as well as providing TP/SL levels. Considering these assisting features is vital before entering a trade.
Contrarian trading methodologies:
Commonly; trading with a trending market is most well known. However; markets are just as susceptible to ranging behaviors. ChartPrime has designed this toolkit to cater to most market conditions. For example, finding confluence between reversal indicators such as our contrarian signals and the Quantum Band can provide for some very strong confluence that can help a trader attempt to enter at bottoms of retracements and achieve the best possible entries or exits.
Developing confluences as shown above can be key to a trader's success. It is important to avoid biases when looking at indicators and view the market as objectively as possible.
ChartPrime believes that there is no magic indicator that is able to print money. Indicator toolkits provide value via their convenience, adaptability and uniqueness. Combining these items can help a trader make more educated; less messy, more planned trades and in turn hopefully help them succeed.
Risk Disclaimer
All content and developments created by ChartPrime are purely for informational & educational purposes only. Past performance does not guarantee future results. Suggested usecases are theoretical.
Skrip berbayar

Polynomial Regression Keltner Channel [ChartPrime]Polynomial Regression Keltner Channel
⯁ OVERVIEW
The Polynomial Regression Keltner Channel [ ChartPrime ] indicator is an advanced technical analysis tool that combines polynomial regression with dynamic Keltner Channels. This indicator provides traders with a sophisticated method for trend analysis, volatility assessment, and identifying potential overbought and oversold conditions.
◆ KEY FEATURES
Polynomial Regression: Uses polynomial regression for trend analysis and channel basis calculation.
Dynamic Keltner Channels: Implements Keltner Channels with adaptive volatility-based bands.
Overbought/Oversold Detection: Provides visual cues for potential overbought and oversold market conditions.
Trend Identification: Offers clear trend direction signals and change indicators.
Multiple Band Levels: Displays four levels of upper and lower bands for detailed market structure analysis.
Customizable Visualization: Allows toggling of additional indicator lines and signals for enhanced chart analysis.
◆ FUNCTIONALITY DETAILS
⬥ Polynomial Regression Calculation:
Implements a custom polynomial regression function for trend analysis.
Serves as the basis for the Keltner Channel, providing a smoothed centerline.
//@function Calculates polynomial regression
//@param src (series float) Source price series
//@param length (int) Lookback period
//@returns (float) Polynomial regression value for the current bar
polynomial_regression(src, length) =>
sumX = 0.0
sumY = 0.0
sumXY = 0.0
sumX2 = 0.0
sumX3 = 0.0
sumX4 = 0.0
sumX2Y = 0.0
n = float(length)
for i = 0 to n - 1
x = float(i)
y = src
sumX += x
sumY += y
sumXY += x * y
sumX2 += x * x
sumX3 += x * x * x
sumX4 += x * x * x * x
sumX2Y += x * x * y
slope = (n * sumXY - sumX * sumY) / (n * sumX2 - sumX * sumX)
intercept = (sumY - slope * sumX) / n
n - 1 * slope + intercept
⬥ Dynamic Keltner Channel Bands:
Calculates ATR-based volatility for dynamic band width adjustment.
Uses a base multiplier and adaptive volatility factor for flexible band calculation.
Generates four levels of upper and lower bands for detailed market structure analysis.
atr = ta.atr(length)
atr_sma = ta.sma(atr, 10)
// Calculate Keltner Channel Bands
dynamicMultiplier = (1 + (atr / atr_sma)) * baseATRMultiplier
volatility_basis = (1 + (atr / atr_sma)) * dynamicMultiplier * atr
⬥ Overbought/Oversold Indicator line and Trend Line:
Calculates an OB/OS value based on the price position relative to the innermost bands.
Provides visual representation through color gradients and optional signal markers.
Determines trend direction based on the polynomial regression line movement.
Generates signals for trend changes, overbought/oversold conditions, and band crossovers.
◆ USAGE
Trend Analysis: Use the color and direction of the basis line to identify overall trend direction.
Volatility Assessment: The width and expansion/contraction of the bands indicate market volatility.
Support/Resistance Levels: Multiple band levels can serve as potential support and resistance areas.
Overbought/Oversold Trading: Utilize OB/OS signals for potential reversal or pullback trades.
Breakout Detection: Monitor price crossovers of the outermost bands for potential breakout trades.
⯁ USER INPUTS
Length: Sets the lookback period for calculations (default: 100).
Source: Defines the price data used for calculations (default: HLC3).
Base ATR Multiplier: Adjusts the base width of the Keltner Channels (default: 0.1).
Indicator Lines: Toggle to show additional indicator lines and signals (default: false).
⯁ TECHNICAL NOTES
Implements a custom polynomial regression function for efficient trend calculation.
Uses dynamic ATR-based volatility adjustment for adaptive channel width.
Employs color gradients and opacity levels for intuitive visual representation of market conditions.
Utilizes Pine Script's plotchar function for efficient rendering of signals and heatmaps.
The Polynomial Regression Keltner Channel indicator offers traders a sophisticated tool for trend analysis, volatility assessment, and trade signal generation. By combining polynomial regression with dynamic Keltner Channels, it provides a comprehensive view of market structure and potential trading opportunities. The indicator's adaptability to different market conditions and its customizable nature make it suitable for various trading styles and timeframes.

Linear Regression ChannelLinear Regression Channel with Logarithmic Scale Option
This advanced Linear Regression Channel indicator offers traders a powerful tool for technical analysis, with unique features that set it apart from standard implementations.
Key Features:
Logarithmic Scale Option: One of the most distinctive aspects of this indicator is the ability to switch between classic and logarithmic scales. This feature is particularly valuable for long-term analysis, as it ensures that equal percentage changes are represented equally, regardless of the price level.
Flexible Start Date: Unlike many indicators that rely on a fixed number of periods, this tool allows users to set a specific start date and time. This feature provides precise control over the regression analysis timeframe, enhancing its adaptability to various trading strategies.
Customizable Channel Settings: Users can adjust the upper and lower deviation multipliers, allowing for fine-tuning of the channel width to suit different market conditions and trading styles.
Trend Strength Indicator: An optional feature that displays the strength of the trend based on the Pearson correlation coefficient, offering additional insight into the reliability of the current trend.
Comprehensive Visual Customization: The indicator offers extensive color and style options for the regression line, upper and lower channel lines, and fill areas, allowing traders to create a visually appealing and easy-to-read chart setup.
Extended Line Options: Users can choose to extend the regression lines to the left, right, or both, facilitating projection and analysis of future price movements.
Multiple Alert Conditions: The indicator includes four alert conditions for crossing the upper deviation, lower deviation, and the main regression line in both directions, enhancing its utility for active traders.
Why Choose This Indicator:
The combination of logarithmic scale option and flexible start date setting makes this Linear Regression Channel uniquely suited for both short-term and long-term analysis. The logarithmic scale is particularly beneficial for analyzing assets with significant price changes over time, as it normalizes percentage moves across different price levels. This feature, coupled with the ability to set a precise start date, allows traders to perform more accurate and relevant regression analyses, especially when studying specific market cycles or events.
Moreover, the trend strength indicator and customizable visual elements provide traders with a comprehensive tool that not only identifies potential support and resistance levels but also offers insight into the reliability and strength of the current trend.
In summary, this Linear Regression Channel indicator combines flexibility, precision, and insightful analytics, making it an invaluable tool for traders seeking to enhance their technical analysis capabilities on TradingView.

Ultimate Bands [BigBeluga]Ultimate Bands
The Ultimate Bands indicator is an advanced technical analysis tool that combines elements of volatility bands, oscillators, and trend analysis. It provides traders with a comprehensive view of market conditions, including trend direction, momentum, and potential reversal points.
🔵 KEY FEATURES
● Ultimate Bands
Consists of an upper band, lower band, and a smooth middle line
Based on John Ehler's SuperSmoother algorithm for reduced lag
Bands are calculated using Root Mean Square Deviation (RMSD) for adaptive volatility measurement
Helps identify potential support and resistance levels
● Ultimate Oscillator
Derived from the price position relative to the Ultimate Bands
Oscillates between overbought and oversold levels
Provides insights into potential reversals and trend strength
● Trend Signal Line
Based on a Hull Moving Average (HMA) of the Ultimate Oscillator
Helps identify the overall trend direction
Color-coded for easy trend interpretation
● Heatmap Visualization
Displays the current state of the oscillator and trend signal
Provides an intuitive visual representation of market conditions
Shows overbought/oversold status and trend direction at a glance
● Breakout Signals
Optional feature to detect and display breakouts beyond the Ultimate Bands
Helps identify potential trend reversals or continuations
Visualized with arrows on the chart and color-coded candles
🔵 HOW TO USE
● Trend Identification
Use the color and position of the Trend Signal Line to determine the overall market trend
Refer to the heatmap for a quick visual confirmation of trend direction
● Entry Signals
Look for price touches or breaks of the Ultimate Bands for potential entry points
Use oscillator extremes in conjunction with band touches for stronger signals
Consider breakout signals (if enabled) for trend-following entries
● Exit Signals
Use opposite band touches or breakouts as potential exit points
Monitor the oscillator for divergences or extreme readings as exit signals
● Overbought/Oversold Analysis
Use the Ultimate Oscillator and heatmap to identify overbought/oversold conditions
Look for potential reversals when the oscillator reaches extreme levels
● Confirmation
Combine Ultimate Bands, Oscillator, and Trend Signal for stronger trade confirmation
Use the heatmap for quick visual confirmation of market conditions
🔵 CUSTOMIZATION
The Ultimate Bands indicator offers several customization options:
Adjust the main calculation length for bands and oscillator
Modify the number of standard deviations for band calculation
Change the signal line length for trend analysis
Toggle the display of breakout signals and candle coloring
By fine-tuning these settings, traders can adapt the Ultimate Bands indicator to various market conditions and personal trading strategies.
The Ultimate Bands indicator provides a multi-faceted approach to market analysis, combining volatility-based bands, oscillator analysis, and trend identification in one comprehensive tool. Its adaptive nature and visual cues make it suitable for both novice and experienced traders across various timeframes and markets. The integration of multiple analytical elements offers traders a rich set of data points to inform their trading decisions.

TP RSITP RSI - Integrated Trend, Momentum, and Volatility Analyzer
The TP RSI indicator is an innovative 3-in-1 technical analysis tool that combines RSI, Bollinger Bands, and an EMA ribbon to provide traders with a comprehensive view of trend, momentum, and volatility in a single, easy-to-interpret visual display.
Why This Combination? This mashup addresses three critical aspects of market analysis simultaneously:
Trend identification and strength (EMA ribbon)
Momentum measurement (RSI)
Volatility assessment (Bollinger Bands)
By integrating these components, traders can make more informed decisions based on multiple factors without switching between different indicators.
How Components Work Together:
1. EMA Ribbon (Trend):
10 EMAs form 5 color-coded bands
Blue: Uptrend, Red: Downtrend
Provides a nuanced view of trend strength and potential reversals
2. RSI (Momentum):
Color-coded for quick interpretation
Blue: Upward momentum, Red: Downward momentum, White: Neutral
Position relative to the ribbon offers additional insight
3. Bollinger Bands (Volatility):
Applied to RSI for dynamic overbought/oversold levels
Narrow bands indicate low volatility, suggesting potential breakouts
Unique Aspects and Originality:
Synergistic visual cues: Color coordination between ribbon and RSI
Multi-factor confirmation: Requires alignment of trend, momentum, and volatility for strong signals
Volatility-adjusted momentum: RSI interpreted within the context of Bollinger Bands
How these components work together:
Buy Signal: Blue ribbon with blue RSI outside the ribbon.
Sell Signal: Red ribbon with red RSI outside the ribbon.
Neutral: White RSI or RSI inside the ribbon (not recommended for trading)
Increasing Momentum: RSI crossing above upper Bollinger Band (upward) or below lower Band (downward).
Trend Strength: RSI rejection by the ribbon, while all bands are colored along with the trend direction, identifies a strong trend.

Adaptive RSI BandsThe RSI Band Optimizer is an innovative technical analysis tool designed to identify and display the most effective Relative Strength Index (RSI) band values for any given trading instrument. This powerful indicator dynamically calculates optimal overbought and oversold levels, moving beyond the traditional static 70/30 or 80/20 bands.
Core Functionality:
Dynamic RSI Band Calculation:
The indicator analyzes historical price data to determine the most effective RSI levels for identifying overbought and oversold conditions specific to the current trading instrument and timeframe.
Adaptive Optimization:
Rather than relying on external factors, the tool uses a proprietary algorithm that focuses solely on the relationship between historical RSI values and subsequent price movements. This pure RSI-based approach ensures that the bands are optimized for the indicator's own dynamics.
Continuous Recalibration:
The optimal RSI bands are continuously recalculated as new price data becomes available, ensuring that the indicator adapts to changing market conditions and remains relevant over time.
Key Inputs:
RSI Length:
Allows users to set the period for the RSI calculation. While the default is typically 14, users can adjust this to suit their trading style and the characteristics of the instrument they're trading.
Optimization Lookback:
Defines the historical period the indicator uses to calculate optimal bands. This balance between recent market behavior and longer-term patterns.
Band Sensitivity:
Enables fine-tuning of how aggressively the indicator adjusts the RSI bands. Higher sensitivity results in more frequent band adjustments, while lower sensitivity provides more stable levels.
What Makes It Unique:
Self-Contained Optimization:
Unlike indicators that rely on external data sources or comparisons, this tool focuses purely on optimizing RSI bands based on the indicator's own historical performance.
Instrument-Specific Bands:
By calculating optimal bands for each specific instrument, the indicator acknowledges that different assets may have different typical RSI ranges and behaviors.
Timeframe Adaptability:
The optimization process adapts to the selected timeframe, recognizing that optimal RSI bands may differ between short-term and long-term charts.
Dynamic Band Adjustment:
The continuous recalibration of bands allows the indicator to adapt to changing market volatility and trends, providing more relevant signals over time.
Enhanced RSI Interpretation:
By providing optimized, asset-specific overbought and oversold levels, the indicator offers a more nuanced and potentially more accurate interpretation of RSI values.
The RSI Band Optimizer represents a significant advancement in the application of the Relative Strength Index. By dynamically calculating optimal band values, it addresses one of the main criticisms of traditional RSI usage – the reliance on static, one-size-fits-all overbought and oversold levels. This tool empowers traders to make more informed decisions based on RSI readings that are truly tailored to the specific characteristics of the asset they're trading.
Signals & Overlays [UAlgo]The Signals & Overlays indicator is a comprehensive trading tool designed to provide traders with a holistic view of market conditions. It combines multiple analysis techniques to offer insights into trend direction, potential reversal points, and optimal entry and exit levels. This versatile indicator is suitable for various trading styles and timeframes, also has Beginner-Friendly presets to enable multiple features at once within one-click.
🔶 Key Features:
🔹 Contrarian Signals:
This feature identifies potential trend reversals and market turning points. These contrarian signals are displayed as arrow markers on the chart, alerting traders to possible opportunities that go against the prevailing trend. The signals are based on a combination of price action, momentum, and volatility factors, providing a multi-faceted approach to market analysis.
Customizable Settings :
Signal Sensitivity: Adjustable from 0.1 to 10.0. This controls how sensitive the indicator is to potential reversal signals.
🔹 Reversal Zones:
This feature utilizes statistical methods that compute a smoothed average and associated bands around a data series using Gaussian weights. The Gaussian distribution helps to assign more weight to data points near the center of the window, and the bands represent the average plus/minus a scaled measure of deviation.
This technique is often used in financial analysis to detect trends and measure volatility to identify key areas where price reversals are more likely to occur. These zones providing a dynamic representation of potential support and resistance areas. Traders can use these zones to anticipate potential price reactions and plan their entries and exits accordingly.
Users can also customize the responsiveness of the Reversal Zones through the "Zone Speed" setting. This allows for fine-tuning the model's sensitivity to price changes:
Swift Mode: Quickly adapts to recent price movements, ideal for short-term trading.
Standard Mode: Balances recent and historical data for a medium-term perspective.
Slow Mode: Emphasizes longer-term trends, suitable for position trading.
Customizable Settings :
Zone Data Source: Users can select which price data (open, high, low, close, etc.) to use for zone calculations.
Zone Speed: Choosable between "Swift", "Standard", and "Slow", affecting how quickly the zones adapt to price changes.
🔹 Smart Trail:
The Smart Trail feature provides an adaptive trend-following mechanism. It plots a dynamic line that adjusts based on price action and volatility, helping traders stay in trending moves while providing a trailing stop-loss reference. This feature is particularly useful for managing open positions and optimizing exit points.
🔹 Trend Cloud:
Generates a specialized trend indicator using double-smoothed EMAs applied to closing prices and the high-low price range. It visualizes market trends and volatility by shading the area between different indicator values over time. The color of the shading changes to reflect whether the current trend is strengthening or weakening.
The Trend Cloud feature provides a visually intuitive representation of the overall market trend. It generates a dynamic colored cloud on the chart that helps traders quickly assess the current market direction and strength. Bullish trends represented by blue clouds and bearish trends by red clouds.
🔹 Trend Analyzer:
The Trend Analyzer component provides an in-depth analysis of the current market trend. It uses a customizable moving average system to determine the trend direction and strength. The analyzer can be configured to focus on short-term, medium-term, or long-term trends, allowing traders to align their strategy with their preferred trading timeframe.
Customizable Settings :
Analyzer Calculation Period: Adjustable period for trend analysis calculations.
Analyzer Mode: Selectable between "Short-Term", "Medium-Term", and "Long-Term".
Analyzer Calculation Source: Customizable price data source for trend analysis.
Use Heikin Ashi: Option to use Heikin Ashi candles instead of regular candles for calculations.
🔹 TP/Exit/Entry Levels:
The indicator calculates and displays potential take profit (TP), exit, and entry levels based on market structure and volatility. These levels are marked on the chart, offering traders guidance on optimal points for trade management. This feature can be particularly helpful for setting profit targets and managing risk.
🔹 Dashboard:
The customizable dashboard provides a quick overview of key market metrics. It displays information such as trend strength, volume analysis, market volatility, the current state of the Trend Catcher and the market is "Bearish" or "Bullish". This at-a-glance summary helps traders make informed decisions without the need to switch between multiple indicators.
Customizable Settings :
Toggle: Option to display or hide the dashboard.
Dashboard Position and Size: Selectable between "Top Right", "Bottom Right", and "Bottom Left". Adjustable size to "Tiny", "Small" or "Normal".
🔶 Disclaimer:
Use with Caution: This indicator is provided for educational and informational purposes only and should not be considered as financial advice. Users should exercise caution and perform their own analysis before making trading decisions based on the indicator's signals.
Not Financial Advice: The information provided by this indicator does not constitute financial advice, and the creator (UAlgo) shall not be held responsible for any trading losses incurred as a result of using this indicator.
Backtesting Recommended: Traders are encouraged to backtest the indicator thoroughly on historical data before using it in live trading to assess its performance and suitability for their trading strategies.
Risk Management: Trading involves inherent risks, and users should implement proper risk management strategies, including but not limited to stop-loss orders and position sizing, to mitigate potential losses.
No Guarantees: The accuracy and reliability of the indicator's signals cannot be guaranteed, as they are based on historical price data and past performance may not be indicative of future results.
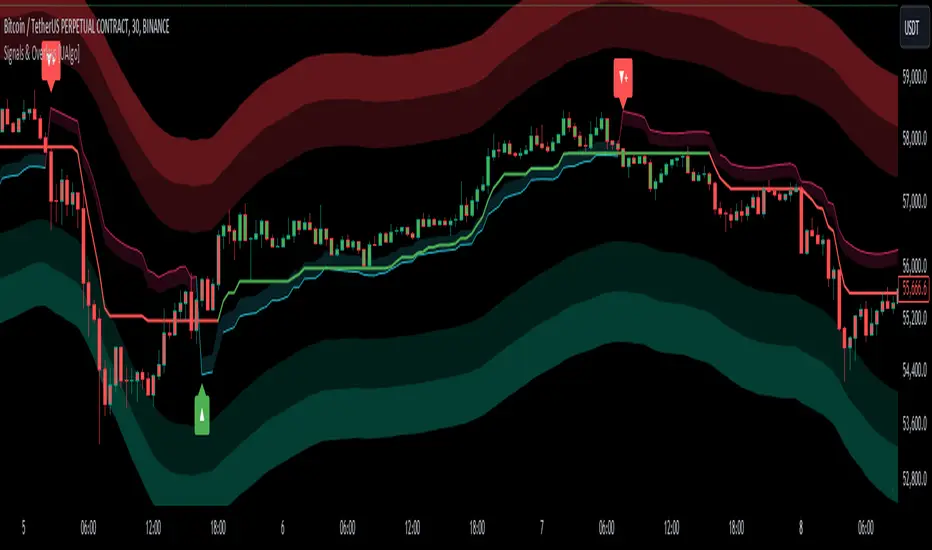
Absolute Move BandsOverview:
The Absolute Move Bands indicator calculates the absolute value of the expected return, also known as "momentum" by some traders, and then displays it with standard deviation bands. The indicator also shows a moving average and a Kalman filter of the absolute move. If you take the expected return, you get what many traders commonly call "momentum." Now, if you turn the negative values into positive values by getting the magnitude of the expected return, it shows the "strength or intensity of the expected return." A low value of the absolute value of the expected return shows that the expected return is close to 0, which means that there is no significant trending behavior. The higher the value, the higher the deviation is from the mean, indicating stronger trend moves in the expected return itself. This indicator then gets the standard score of the absolute value of the expected return and then gets the moving average and Kalman Filter.
This indicator is not a directional indicator, but it can help you time moves and determine the "strength" of the expected returns (also known as momentum).
Interpreting the Magnitude:
Low Values: A low absolute value of the expected return indicates that the expected return is close to 0, suggesting no significant trending behavior in the market.
High Values: A high absolute value indicates a strong deviation from the mean, reflecting stronger trend moves in the expected return itself.
Standard Score Calculation:
This indicator computes the standard score (z-score) of the absolute value of the expected return. The value shows how many standard deviations the absolute return is from the mean. This helps in identifying periods of extreme magnitude.
Moving Average and Kalman Filter:
Moving Average: The indicator calculates the moving average of the standard score to smooth out the short-term fluctuations and show the longer-term trends in the absolute returns.
Kalman Filter: Applied to further reduce noise and provide a clearer signal, it enhances the indicator's effectiveness in determining the strength of the expected returns.
Standard Deviation Bands
Purpose: The standard deviation bands help determine if the standard score is at an extreme low or high.
High Standard Score (+2 Standard Deviation Band): Indicates that the absolute value of the expected return is at a high level, suggesting a strong trend. This could mean that the trend is at its peak and might be nearing completion.
Low Standard Score (-2 Standard Deviation Band): Indicates that the absolute value of the expected return is at a low level, suggesting minimal or no trending behavior. This could imply that the expected return is around 0, and a new trend (in any direction) may start soon.
How to interpret and use this indicator
Two ways will be discussed on how you can use this indicator. First of all lets go back over the interpretation of the standard score and bands.
High Standard Score: Indicates that the absolute value is significantly higher than usual, which suggest a strong trend which may be nearing its peak. Some traders who entered a trade at a low standard score value might want to consider taking profits or preparing for a potential reversal.
Low Standard Score: Indicates that the absolute value is significantly low, close to 0, which suggest minimal trending behavior and a new trend or move may soon start.
This indicator shouldn't be used alone; you may need an indicator that shows you the trend with an expected return indicator or a "momentum" indicator, because all this shows you is the strength of the trend or "momentum." So let's say that if you see that the standard score is low and the Kalman filter is increasing, then this shows that a trend may start soon, so you can use the "momentum" indicator and enter with whatever the trend is on.
Another way to use the indicator is to trade extreme occurrences. If on an indicator that shows the expected returns, or "momentum," and its at an extreme standard deviation occurrence level like -2 standard deviation from the mean, and the standard score is at 2 standard deviation (the top band), and the Kalman filter starts decreasing, then the downtrend may be over and you could place a long.
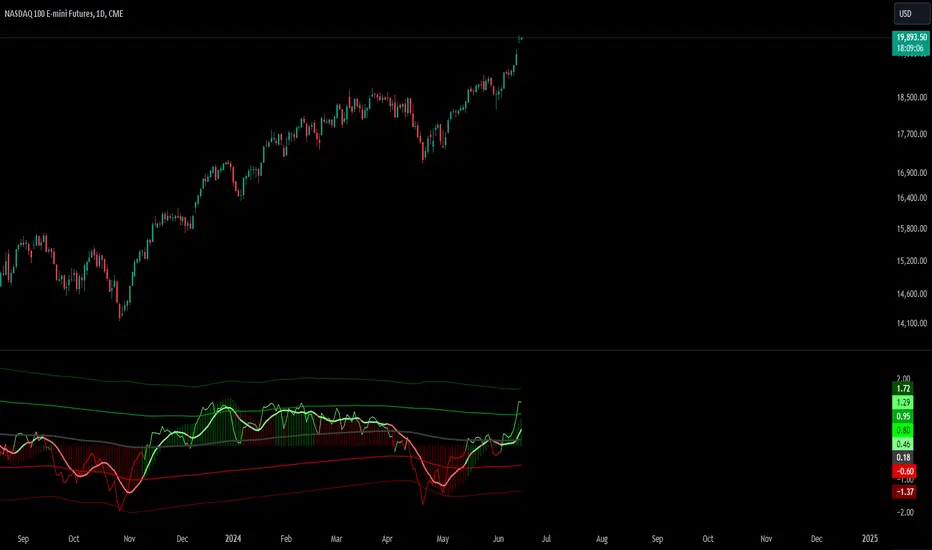
Anchored Monte Carlo Shuffled Projection [LuxAlgo]The Anchored Monte Carlo Shuffled Projection tool randomly simulates future price points based on historical bar movements made before a user-anchored point in time.
By anchoring our data and projections to a single point in time, users can better understand and reflect on how the price played out while taking into consideration our random simulations.
🔶 USAGE
After selecting the indicator to apply to the chart, you will be prompted to "Set the Anchor Point". Do so by clicking on the desired location on your chart, only time is used as the anchor point.
Note: To select a new anchor point when applied to the chart, click on the 'More' dropdown next to the indicator status bar (○○○), then select "Reset points...".
Alternate Method: You are also able to click and drag the vertical line that displays on the anchor point bar when the indicator is highlighted.
By randomly simulating bar movements, a range is developed of potential price action which could be utilized to locate future price development as well as potential support/resistance levels.
Performing numerous simulations and taking the average at each step will converge toward the result highlighted by the "Average Line", and can point out where the price might develop, assuming the trend and amount of volatility persist.
Current closing price + Sum of changes in the calculation window
This constraint will cause the simulations always to display an endpoint consistent with the current lookback's slope.
While this may be helpful to some traders, this indicator includes an option to produce a less biased range, as seen below:
🔶 DETAILS
The Anchored Monte Carlo Shuffled Projection tool creates simulations based on prices within a user-set lookback window originating at the specified anchor point. Simulations are done as follows:
Collect each bar's price changes in the user-set window.
Randomize the order of each change in the window.
Project the cumulative sum of the shuffled changes from the current closing price.
Collect data on each point along the way.
This is the process for the Default calculation; for the 'Randomize Direction' calculation, when added onto the front for every other change, the value is inverted, creating the randomized endpoints for each simulation.
The script contains each simulation's data for that bar, with a maximum of 1000 simulations.
To get a glimpse behind the scenes, each simulation (up to 99) can be viewed using the 'Visualize Simulations' Options, as seen below.
Because the script holds the full simulation data, the script can also calculate this data, such as standard deviations.
In this script the Standard deviation lines are the average of all standard deviations across the vertical data groups, this provides a singular value that can be displayed a distance away from the simulation center line.
🔶 SETTINGS
Lookback: Sets the number of Bars to include in calculations.
Simulation Count: Sets the number of randomized simulations to calculate. (Max 1000)
Randomize Direction: See Details Above. Creates a more 'Normalized' Distribution
Visualize Simulations: See Details Above. Turns on Visualizations, and colors are randomly generated. Visualized max does not cap the calculated max. If 1000 simulations are used, the data will be from 1000 simulations, however, only the last 99 simulations will be visualized.
🔹 Standard Deviations
Standard Deviation Multiplier: Sets the multiplier to use for the Standard Deviation distance away from the center line.
🔹 Style
Extend Lines: Extends the Simulated Value Lines into the future for further reference and analysis.

MTF Bollinger BandWidth [CryptoSea]The MTF Bollinger BandWidth Indicator is an advanced analytical tool crafted for traders who need to gauge market volatility and trend strength across multiple timeframes. This powerful indicator leverages the Bollinger BandWidth concept to provide a comprehensive view of price movements and volatility changes, making it ideal for those looking to enhance their trading strategies with multi-timeframe analysis.
Key Features
Multi-Timeframe Analysis: Allows users to monitor Bollinger BandWidth across various timeframes, providing a macro and micro perspective on market volatility.
Pivot Point Detection: Identifies crucial high and low pivot points, offering insights into potential support and resistance levels. Pivot points are dynamic and adjust based on the timeframe viewed, reflecting short-term fluctuations or longer-term trends.
Customizable Parameters: Includes options to adjust the length of the moving average, the standard deviation multiplier, and more, enabling traders to tailor the tool to their specific needs.
Dynamic Color Coding: Utilizes color changes to indicate different market conditions, aiding in quick visual assessments.
In the example below, notice how changes in BBW across different timeframes provide early signals for potential volatility increases or decreases.
How it Works
Calculation of BandWidth: Measures the percentage difference between the upper and lower Bollinger Bands, which expands or contracts based on market volatility.
High and Low Pivot Tracking: Automatically calculates and tracks the pivots in BBW values, which are critical for identifying turning points in market behavior. High and low levels will change depending on the timeframe, capturing distinct market behaviors from granular movements to broad trends.
Visual Alerts and Table Display: Highlights significant changes in BBW with visual alerts and provides a detailed table view for comparison across timeframes.
In the example below, BBW identifies a significant contraction followed by an expansion, suggesting a potential breakout.
Application
Strategic Market Entry and Exit: Assists traders in making well-informed decisions about when to enter and exit trades based on volatility cues.
Trend Strength Assessment: Helps in determining the strength of the prevailing market trend through detailed analysis of expansion and contraction periods.
Adaptable to Various Trading Styles: Suitable for day traders, swing traders, and long-term investors due to its customization capabilities and effectiveness across different timeframes.
The MTF Bollinger BandWidth Indicator is a must-have in the arsenal of traders who demand depth, accuracy, and responsiveness in their market analysis tools. Enhance your trading decisions by integrating this sophisticated indicator into your strategy to navigate the complexities of various market conditions effectively.

Volatility ATR Support and Resistance Bands [Quantigenics]Volatility ATR Support and Resistance Bands
The “Volatility ATR Support and Resistance Bands” is a trend visualization tool that uses Average True Range (ATR) to create a dynamic channel around price action, adapting to changes in volatility and offering clear trend indicators. The band direction can indicate trend and the lines can indicate support and resistance levels.
The script works by calculating a series of moving averages from the highest and lowest prices, then applies an ATR-based multiplier to generate a set of bands. These bands expand and contract with the market’s volatility, providing a visual guide to the strength and potential direction of price movements.
How to Trade with Volatility ATR Band:
Identify Trend Direction: When the bands slope upwards, the market is trending upwards, which may be a good opportunity to consider a long position. When the bands slope downward, the market is trending downwards, which could be a sign to sell or short.
Volatility Awareness: The wider the bands, the higher the market volatility. Narrow bands suggest a quieter market, which might indicate consolidation or a potential breakout/breakdown.
Confirm Entries and Exits: Use the bands as dynamic support and resistance; entering trades as the price bounces off the bands and considering exits as it reaches the opposite side or breaches the bands.
Hope you enjoy this script!
Happy trading!

Relative Average Extrapolation [ChartPrime]Relative Average Extrapolation (ChartPrime) is a new take on session averages, like the famous vwap . This indicator leverages patterns in the market by leveraging average-at-time to get a footprint of the average market conditions for the current time. This allows for a great estimate of market conditions throughout the day allowing for predictive forecasting. If we know what the market conditions are at a given time of day we can use this information to make assumptions about future market conditions. This is what allows us to estimate an entire session with fair accuracy. This indicator works on any intra-day time frame and will not work on time frames less than a minute, or time frames that are a day or greater in length. A unique aspect of this indicator is that it allows for analysis of pre and post market sessions independently from regular hours. This results in a cleaner and more usable vwap for each individual session. One drawback of this is that the indicator utilizes an average for the length of a session. Because of this, some after hour sessions will only have a partial estimation. The average and deviation bands will work past the point where it has been extrapolated to in this instance however. On low time frames due to the limited number of data points, the indicator can appear noisy.
Generally crypto doesn't have a consistent footprint making this indicator less suitable in crypto markets. Because of this we have implemented other weighting schemes to allow for more flexibility in the number of use cases for this indicator. Besides volume weighting we have also included time, volatility, and linear (none) weighting. Using any one of these weighting schemes will transform the vwap into a wma, volatility adjusted ma, or a simple moving average. All of the style are still session period and will become longer as the session progresses.
Relative Average Extrapolation (ChartPrime) works by storing data for each time step throughout the day by utilizing a custom indexing system. It takes the a key , ie hour/minute, and transforms it into an array index to stor the current data point in its unique array. From there we can take the current time of day and advance it by one step to retrieve the data point for the next bar index. This allows us to utilize the footprint the extrapolate into the future. We use the relative rate of change for the average, the relative deviation, and relative price position to extrapolate from the current point to the end of the session. This process is fast and effective and possibly easier to use than the built in map feature.
If you have used vwap before you should be familiar with the general settings for this indicator. We have made a point to make it as intuitive for anyone who is already used to using the standard vwap. You can pick the source for the average and adjust/enable the deviation bands multipliers in the settings group. The average period is what determines the number of days to use for the average-at-time. When it is set to 0 it will use all available data. Under "Extrapolation" you will find the settings for the estimation. "Direction Sensitivity" adjusts how sensitive the indicator is to the direction of the vwap. A higher number will allow it to change directions faster, where a lower number will make it more stable throughout the session. Under the "Style" section you will find all of the color and style adjustments to customize the appearance of this indicator.
Relative Average Extrapolation (ChartPrime) is an advanced and customizable session average indicator with the ability to estimate the direction and volatility of intra-day sessions. We hope you will find this script fascinating and useful in your trading and decision making. With its unique take on session weighting and forecasting, we believe it will be a secret weapon for traders for years to come.
Enjoy
