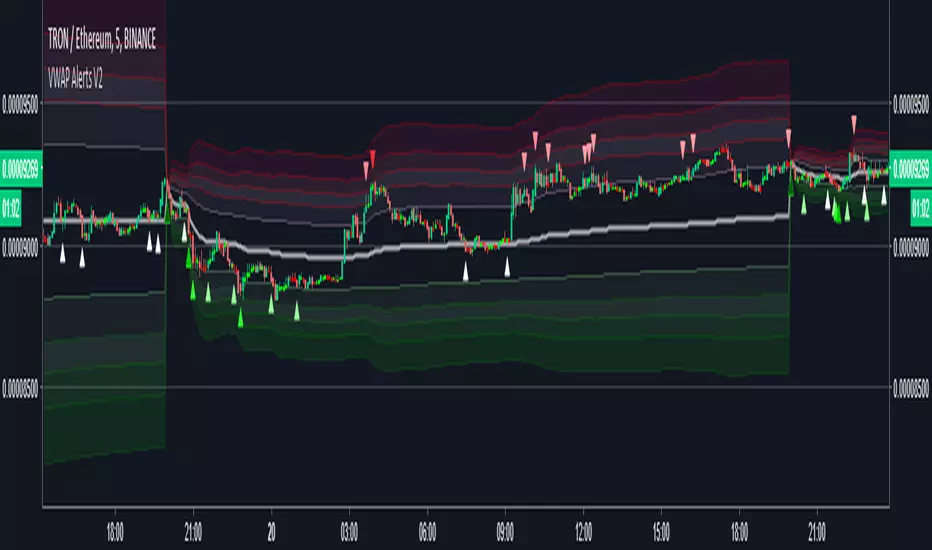
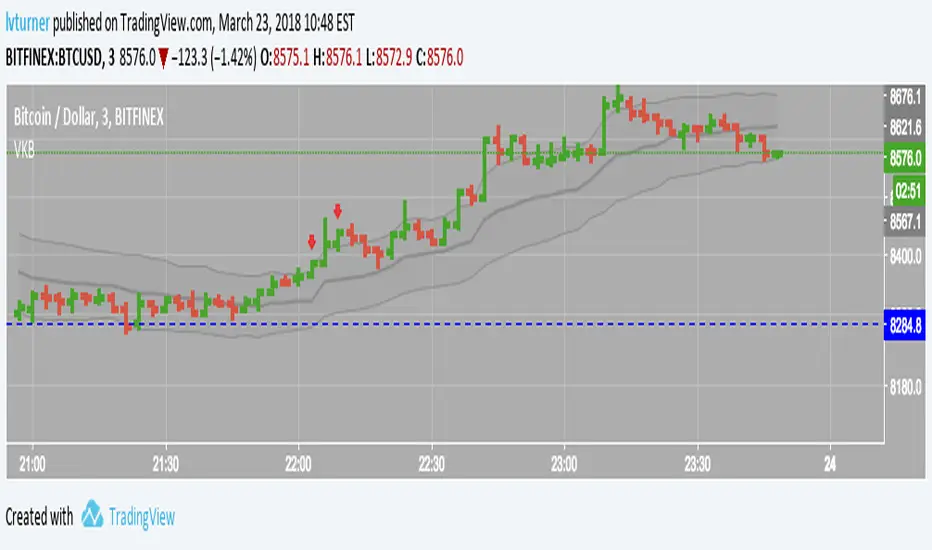
VWAP Alerts V2Alerts added to "VWAP Stdev Bands v2" by SandroTurriate
Changes
-Adjusted trigger conditions for higher signal sensitivity
-Color change on bands and signals for better readability and ease on the eyes
-Alerts added for up to 4 deviations up and down
-Re-enabled deviations 4 and 5
-Re-enabled previous close
Bands


Gunbot - Bbands - UnlockedThis is a repost, the first version was locked and I am unable to unlock it. So I'm simply publishing it anew.
Original Post
Original Description
This is more of a test run than anything. Gunbot approximation courtesy of Vosechu and the original can be found here.


Volatility Profit (VPI) & Bollinger Bands (BB) [checkm8]Hello and welcome to my 2-in-1 indicator of Volatility Profit Indicator and Bollinger Bands.
Volatility Profit Indicator is a script inspired by Jim Berg, from a 2005 article titled "The Truth About Volatility". This is a set of bands, where the upper band is based on a moving average of highs over a given period, added to the average true range of the period. The lower band is based on a moving average of lows over the same given period, from which the average true range is subtracted. The formula is shown below:
VPI High Band = MA(HI, type, x) + y * ATR(z)
VPI Low Band = MA(LO, type, x) - y * ATR(z)
where... type = MA Type (default to Exponential) x = MA Period (default to 13) y = True Range Multiplier (default to 2) z = True Range Period (default to 20)
Bollinger Bands should be familiar by now, but they are calculated based on a moving average of a source ( / 3), added to a particular standard deviation of the source.
This indicator:
- Allows you to choose whether you want to plot the Volatility Profit Indicator or Bollinger Bands. By default, each will show three bands.
- Has pre-made color schemes to choose from to simplify your life.
- Has smoothing for the Volatility Profit Indicator
- Allows you to choose the source for Bollinger Bands
- Allows you to select what multiplier of the average true range the Volatility Profit Indicator plots, as well as what standard deviations the Bollinger Bands show.
If you have any additional questions, concerns, or suggestions - feel free to reach out.
All the best & happy trading.

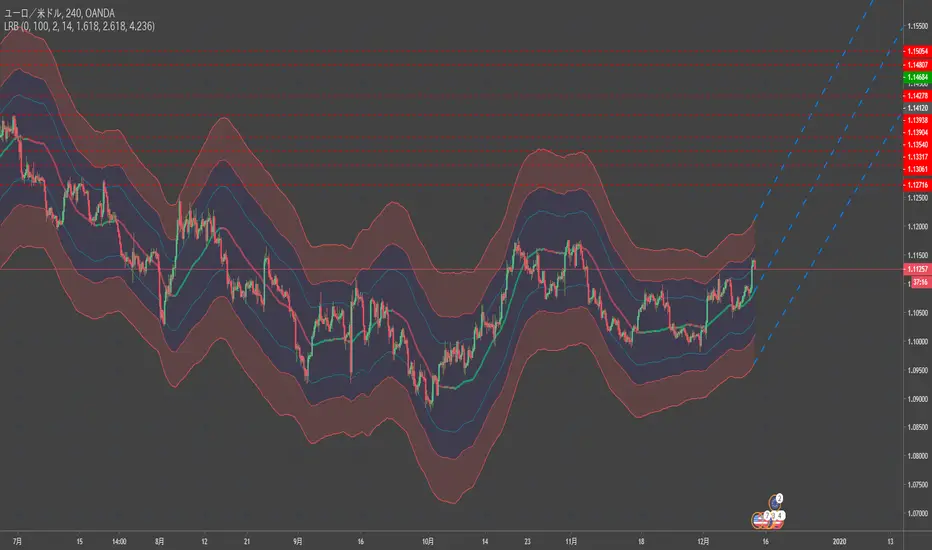
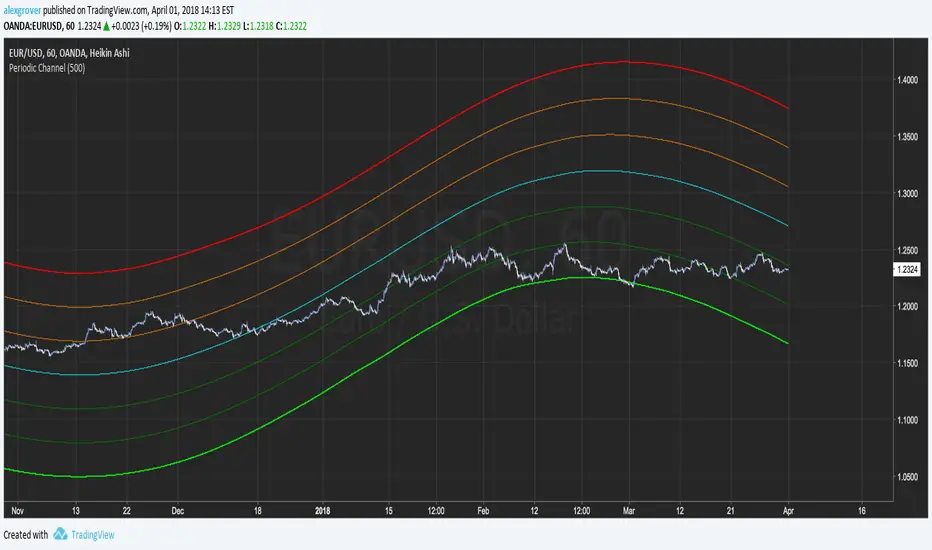
Periodic ChannelThis indicator try to create a channel by summing a re-scaled and readapted sinusoidal wave form to the price mean.
The length parameter control the speed of the sinusoidal wave form, this parameter is not converted to a sine wave period for allowing a better estimation, higher length's work better but feel free to try shorter periods.
The invert parameter invert the sinusoidal wave.
Each bands represent possible return points, the higher the band the higher the probability.
Inverted sin wave exemple
The performance of the indicator is subjective to the main estimation (blue line), select the parameter that best fit the blue line to the price.
Best ragards
Prime Number Bands Strategy Determining market trends has become a science even though a high number
or people still believe it’s a gambling game. Mathematicians, technicians,
brokers and investors have worked together in developing quite several
indicators to help them better understand and forecast market movements.
The Prime Number Bands indicator was developed by Modulus Financial Engineering
Inc. This indicator is charted by indentifying the highest and lowest prime number
in the neighborhood and plotting the two series as a band.
WARNING:
- This script to change bars colors.

VWMA Keltner BandsKind of like Keltner Channel/Bands (stockcharts.com) but using VWMA instead so that volume is taken in to account.
Outside the upper band can considered to be 'overbought' and outside the lower band can be considered to be 'oversold'
Has option to highlight signals (i.e. when price closes outside a channel) and also the option to only display signals if the price is on the correct side of VWAP (i.e. no sell signals if price is above VWAP)
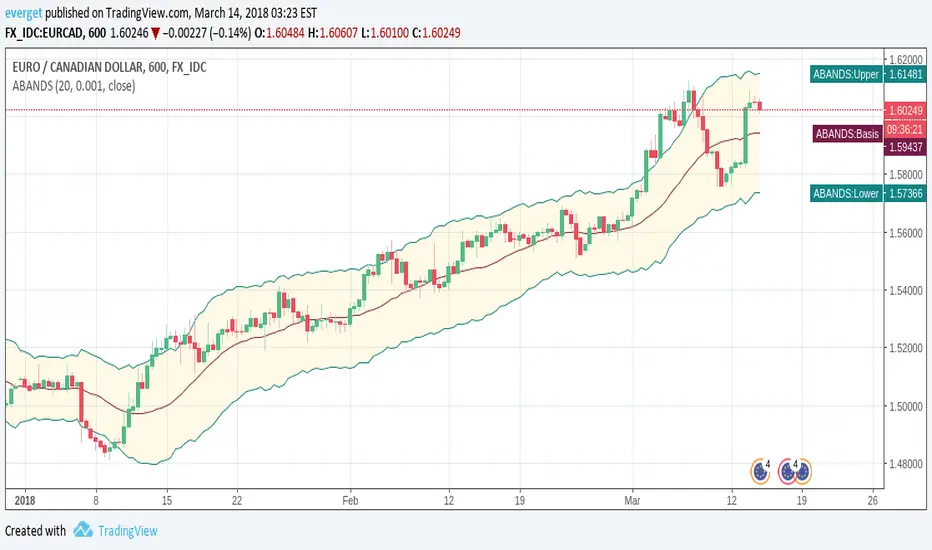
Acceleration BandsAcceleration Bands indicator script. This indicator was originally developed by Price Headley.
OHLC Daily Resolution BandsShout out to nPE- for the idea.
Bands made with stdev from 10 day OHLC.
Keeps resolution to daily, so you can use bands as daily pivots for day trading.
Upper band 1=yesterday close + 0.5 std(ohlc,10)
Upper band 1=yesterday close + 1 std(ohlc,10)
Mid=yesterday close
Lower band 1=yesterday close - 0.5 std(ohlc,10)
Lower band 2=yesterday close - 1 std(ohlc,1

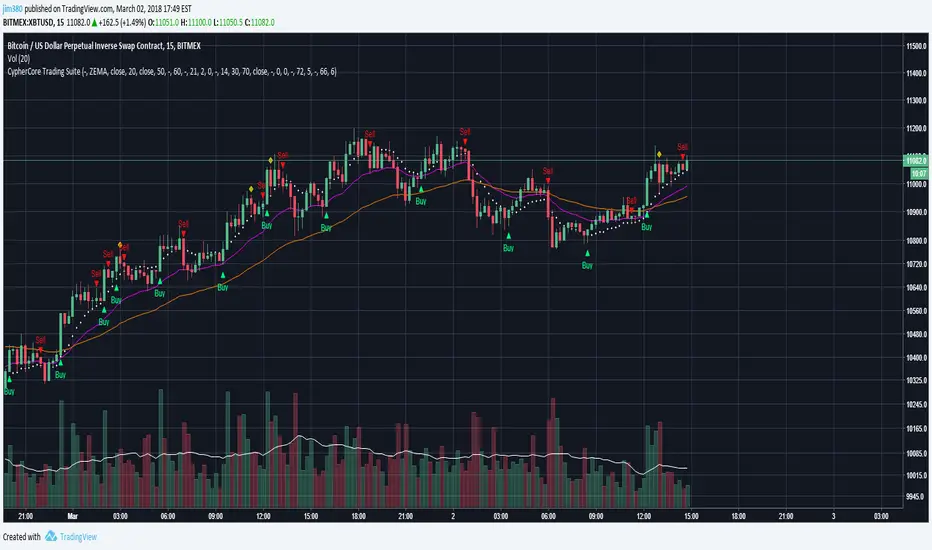
[STUDY] CypherCore Trading Suite
Rerband. Now a STUDY script.
- RSI overlay indicators (diamond shapes)
- Most commonly used MA types( i.e. SMA , EMA , WMA , VWMA , ZEMA )
- Bands
- Price Action Indicator (color coordinated)
color code:
yellow --- inside bars (breakout)
blue --- outside bars (breakout)
green --- up pin bars (reversal)
red --- down pin bars (reversal)
fuchsia --- down shaved bars (selling pressure, selling likely to continue)
aqua --- up shaved bars (buying pressure, buying likely to continue)
- Reversal candlestick patterns (only a few for now)
- Two strategies for determining buy/sell signals
1. buy/sell signals determined by EMAs crossover (better for position or swing trades)
2. buy/sell signals determined by MAs crossover (better for scalping)
03/02/2017
- Switched to STUDY
- Fractals added
- Alerts now fully working
- New "Input" menu
Buy/Sell signals are NOT financial advice.
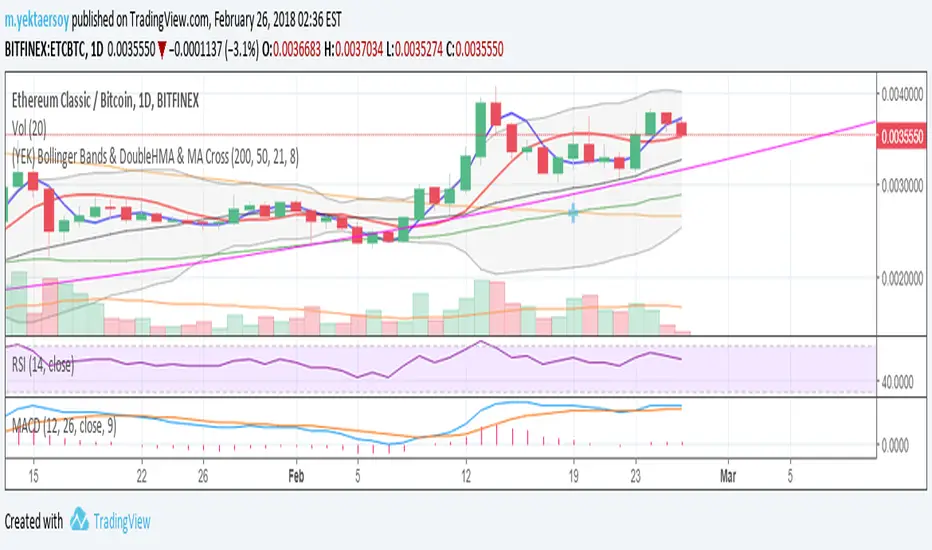
(YEK) Bollinger Bands & DoubleHMA & MA CrossMy favorite indicators ALL-IN-1: Bollinger Bands, Double Hull Moving Average (21,8), Double Moving Average (200,50)
Volume Weighted Average Range Bands [DW]This is an experimental study designed to identify the underlying trend bias and volatility of an instrument over any custom interval TradingView supports.
First, reset points are established at points where the opening price of the interval changes.
Next, Volume Weighted Average Price (VWAP) is calculated. It is the cumulative sum of typical price times volume divided by the cumulative volume. The cumulation starts over upon each reset point.
After that, Volume Weighted Average Range (VWAR) is calculated. The formula structure is the same as VWAP, except using range rather than typical price.
Lastly, the bands are calculated by multiplying the VWAR by the specified multiplier (approximate Golden Ratio by default) and by 1 through 5, then adding to and subtracting from the VWAP.
Custom Bar Colors are included.

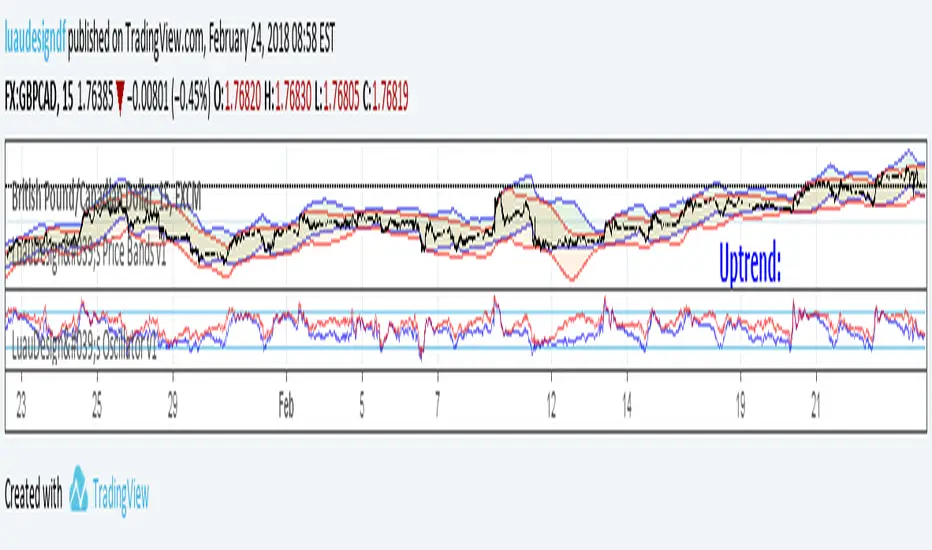
LuauDesign's Oscillator v1I wanted to make an indicator that behaved similarly to Parallel Channels. This is what I currently have.
Blue Oscillator for uptrend. Red Oscillator for downtrend. Both for ranges.
Recommended periods are powers of two (16, 32, 64, 128, 256), which should be adjusted according to volatility.
There's a alternate version of this same code that shows Price Bands instead. Easier to spot trend direction and how price responds to each Channel.

LuauDesign's Price Bands v1I wanted to make an indicator that behaved similarly to Parallel Channels. This is what I currently have.
Blue Channel for uptrend. Red Channel for downtrend. Both for ranges.
Recommended periods are powers of two (16, 32, 64, 128, 256), which should be adjusted according to volatility.
There's a alternate version of this same code that shows an Oscillator instead. Less clutter if you're using more than one at once.
Fractal Chaos Bands Backtest The FCB indicator looks back in time depending on the number of time periods trader selected
to plot the indicator. The upper fractal line is made by plotting stock price highs and the
lower fractal line is made by plotting stock price lows. Essentially, the Fractal Chaos Bands
show an overall panorama of the price movement, as they filter out the insignificant fluctuations
of the stock price.
You can change long to short in the Input Settings
WARNING:
- For purpose educate only
- This script to change bars colors.

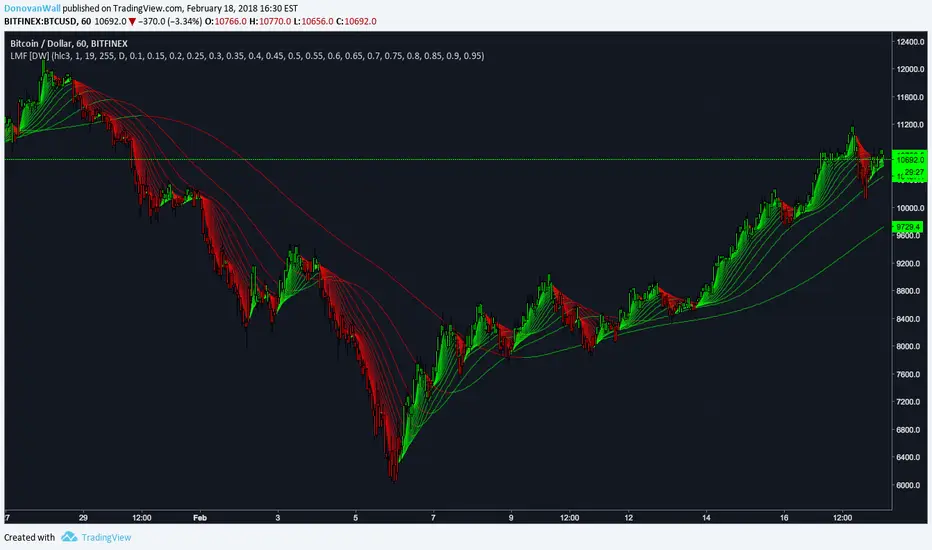
Laguerre Multi-Filter [DW]This is an experimental study designed to identify underlying price activity using a series of Laguerre Filters.
Two different modes are included within this script:
-Ribbon Mode - A ribbon of 18 Laguerre Filters with separate Gamma values is calculated.
-Band Mode - An average of the 18 filters generates the basis line. Then, Golden Mean ATR over the specified sampling period multiplied by 1 and 2 are added and subtracted to the basis line to generate the bands.
Multi-Timeframe functionality is included. You can choose any timeframe that TradingView supports as the basis resolution for the script.
Custom bar colors are included. Bar colors are based on the direction of any of the 18 filters, or the average filter's direction in Ribbon Mode. In Band Mode, the colors are based solely on the average filter's direction.
Fractal Chaos Bands Strategy Stock market moves in a highly chaotic way, but at a larger scale, the movements
follow a certain pattern that can be applied to shorter or longer periods of time
and we can use Fractal Chaos Bands Indicator to identify those patterns. Basically,
the Fractal Chaos Bands Indicator helps us to identify whether the stock market is
trending or not. When a market is trending, the bands will have a slope and if market
is not trending the bands will flatten out. As the slope of the bands decreases, it
signifies that the market is choppy, insecure and variable. As the graph becomes more
and more abrupt, be it going up or down, the significance is that the market becomes
trendy, or stable. Fractal Chaos Bands Indicator is used similarly to other bands-indicator
(Bollinger bands for instance), offering trading opportunities when price moves above or
under the fractal lines.
The FCB indicator looks back in time depending on the number of time periods trader selected
to plot the indicator. The upper fractal line is made by plotting stock price highs and the
lower fractal line is made by plotting stock price lows. Essentially, the Fractal Chaos Bands
show an overall panorama of the price movement, as they filter out the insignificant fluctuations
of the stock price.
WARNING:
- This script to change bars colors.

Fractal Chaos Bands Stock market moves in a highly chaotic way, but at a larger scale, the movements
follow a certain pattern that can be applied to shorter or longer periods of time
and we can use Fractal Chaos Bands Indicator to identify those patterns. Basically,
the Fractal Chaos Bands Indicator helps us to identify whether the stock market is
trending or not. When a market is trending, the bands will have a slope and if market
is not trending the bands will flatten out. As the slope of the bands decreases, it
signifies that the market is choppy, insecure and variable. As the graph becomes more
and more abrupt, be it going up or down, the significance is that the market becomes
trendy, or stable. Fractal Chaos Bands Indicator is used similarly to other bands-indicator
(Bollinger bands for instance), offering trading opportunities when price moves above or
under the fractal lines.
The FCB indicator looks back in time depending on the number of time periods trader selected
to plot the indicator. The upper fractal line is made by plotting stock price highs and the
lower fractal line is made by plotting stock price lows. Essentially, the Fractal Chaos Bands
show an overall panorama of the price movement, as they filter out the insignificant fluctuations
of the stock price.

Fractal Regression Bands [DW]This study is an experimental regression curve built around fractal and ATR calculations.
First, Williams Fractals are calculated, and used as anchoring points.
Next, high anchor points are connected to negative sloping lines, and low anchor points to positive sloping lines. The slope is a specified percentage of the current ATR over the sampling period.
The median between the positive and negative sloping lines is then calculated, then the best fit line (linear regression) of the median is calculated to generate the basis line.
Lastly, a Golden Mean ATR is taken of price over the sampling period and multiplied by 1/2, 1, 2, and 3. The results are added and subtracted from the basis line to generate the bands.
Williams Fractals are included in the plots. The color scheme indicated whether each fractal is engulfing or non-engulfing.
Custom bar color scheme is included.
