ATRP & Volatility Table - AIMAN93The ATRP & Volatility Table is a simple yet powerful tool designed to quantify market volatility and help traders adapt their position sizing accordingly.
It calculates the Average True Range Percentage (ATRP) — the ATR value relative to current price — and classifies market conditions into three volatility levels: LOW, MEDIUM, or HIGH. Based on the volatility level, it suggests an indicative risk percentage to guide your trade management.
This visual tool displays real-time ATRP, volatility classification, and corresponding risk percentage in a compact on-chart table. Ideal for systematic traders who rely on volatility-based decision-making, position sizing, or risk management models.
Features:
- Dynamic ATRP calculation for any symbol or timeframe
- Customizable colors for text and background
- Automatic volatility classification (low / medium / high)
- Suggested risk percentage for each volatility level
Rata-Rata Rentang Sebenarnya / Average True Range (ATR)

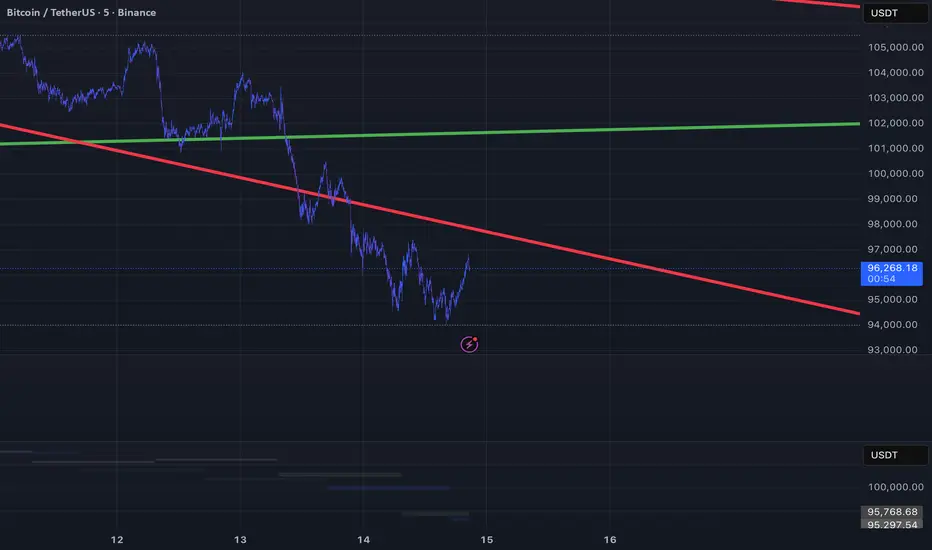
Trend-Adaptive 3-Band Reversal CloudThis indicator plots a trend-adaptive, volatility-based 3-band cloud on your chart to visually contextualize potential high-probability reversal, balance, and exhaustion price zones — all in strict alignment with TradingView’s house rules and best compliance practices.
How It Works
Trend Detection:
The script determines short-term trend direction using two adjustable EMAs (fast and slow). When the fast EMA is above the slow, the environment is classified as an uptrend; when below, as a downtrend.
Adaptive Bands and Clouds:
Around the dynamic trend baseline, three cloud “bands” are drawn using multiples of an ATR (Average True Range) volatility filter, automatically adjusting for evolving market conditions:
Middle Band (Fair Value Zone): Area around the baseline, where price is statistically balanced.
Upper Outer Band: In an uptrend, this shows a potential 'exhaustion/overextension' area; in a downtrend, it can act as a deep pullback or reversal area.
Lower Outer Band: In an uptrend, this highlights a possible 'deep pullback/reversal' area; in a downtrend, it becomes the potential exhaustion zone.
Contextual RSI Markers:
When price is in one of the outer bands and RSI is overbought (upper) or oversold (lower), a tiny diamond marker appears on that band as extra context — offering a visual cue for a possible high-momentum exhaustion or deep reversal zone, but never a trade signal or advice.
Visuals and Compliance:
All cloud regions use three different, semi-transparent colors for easy reading, and never block price action.
Labels indicate only “Possible Exhaustion,” “Deep Pullback Zone,” and “Balanced/Fair Value”—the language is strictly neutral and descriptive.
All calculations run only on confirmed, historical bars with zero repainting, no future bar lookahead, and no predictive overlays.
How to Use
Add to Chart:
Simply add the indicator to any chart and timeframe.
Configure:
Adjust the EMA, ATR, and RSI settings via the input panel to best fit your instrument and preferred sensitivity.
Choose band multipliers to widen or contract the cloud according to volatility or your system.
Toggle RSI marker/context highlighting as desired.
Interpretation:
Middle Cloud (“Balanced/Fair Value”): Price in this zone suggests mean reversion, equilibrium, or fair pricing for the session’s volatility/trend conditions.
Outer Clouds: If price reaches an outer cloud, pay attention for potential mean-reversion (if trend persists) or exhaustion zones (especially if a diamond appears).
Uptrend: Lower cloud is where larger pullbacks/reversals are often initiated; upper cloud indicates potential trend exhaustion.
Downtrend: Upper and lower clouds are reversed in interpretation.
Diamond Markers: A red diamond atop the upper band signifies RSI overbought; a lime diamond below the lower band shows RSI oversold. These do not recommend trading—only highlight increased likelihood that buyers/sellers may be overextended.
Best Practices:
Do not use the indicator in isolation or as a signal generator. Combine its context with price action confirmation, volume, or other non-repainting tools.
Use labels only for navigation/context, never as actionable advice.
Technical Details
Inputs/Customization: Fully adjustable (EMAs, ATR period, band multipliers, RSI thresholds, label/marker toggles).
Logic: All code processes only historical closed bars and overlays information in real time.
No repaint, strategy, or alerts: No signals, no script-driven trading, and no claims of prediction or guaranteed probability.
House-rule Clean: The script and its visuals are compliant with TradingView’s publishing requirements, both visually and textually.
Summary:
This tool is designed for traders who want to visually frame high-probability reversal, equilibrium, and exhaustion zones adaptively—while keeping price action primary and avoiding visual or conceptual clutter. Use it to better understand where price may statistically find resistance/support or revert, not to automate signals or guarantee outcomes

Trinity ATR Strategy (Saty) - Backtest EditionThis is not supposed to be a standalone indicator, but releasing this to give a general overview of what it could do, each commodity and timeframe would need to be back tested. Use in conjunction with other indicators and price action. This is not financial advice and is not a guarantee of financial results.

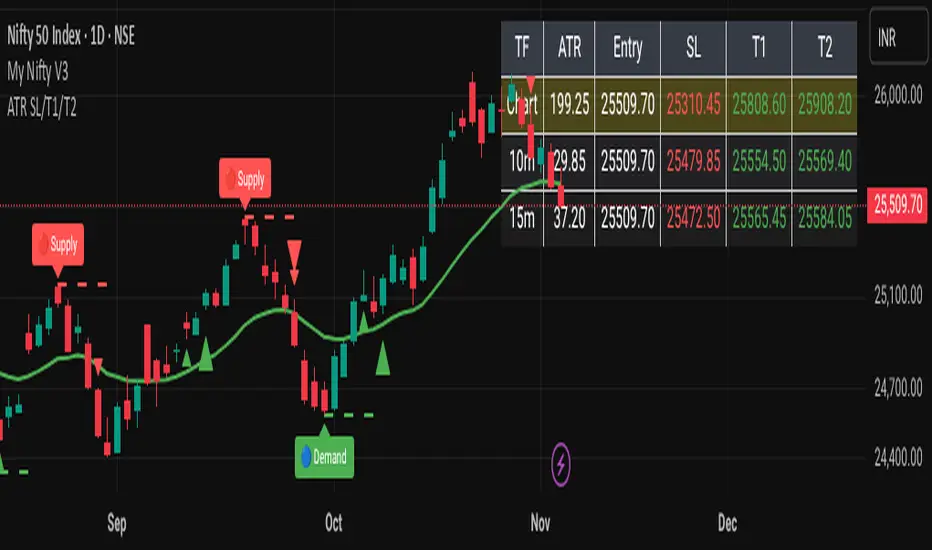
Trinity Dynamic ATR Levels (Saty)This is an updated version of the SATY ATR levels ()
Trinity Dynamic ATR Levels
The core logic is 100 % identical: same higher-timeframe ATR calculation, same trigger at ~23.6 %, same Fibonacci and extension levels, same 8-21-34 EMA ribbon for the trend color in the table, and the table itself looks exactly like the original again (4 rows, clean layout, no extra target row). The visual and usability upgrades you now have that the original does not:
Lower Trigger line is now red instead of yellow, Upper Trigger line is now green instead of aqua/cyan to indicate to go long or short.
Every single level group has its own color input so you can customize everything (previous close, fib levels, 61.8 %, 100 % ATR, extensions, 200 %, 300 %, etc.) without touching the code. Every plotted level now has a clear text label on the right side of the chart (“Prev Close”, “Lower Trig”, “Upper Trig”, “-61.8 %”, “+100 %”, “-200 %”, etc.) so you instantly know what you’re looking at.
A new input called “Target Distance (×ATR)” lets you decide how far your profit target is (default 1.0 = +100 % ATR, but you can set 1.618, 2.0, 2.618, etc. instantly).
As soon as price closes above the Upper Trigger or below the Lower Trigger, a big, obvious target box automatically appears on the right side of the screen showing the exact dollar target price for the active long or short (green box for longs, red box for shorts). When there is no active trigger, the box disappears and the table stays perfectly clean.
In short, you now have the exact same beloved Saty ATR indicator everyone uses, but with red/green triggers, full color control, level labels, and a beautiful dynamic target box that only shows up when you actually have a trade on — all while keeping the original clean 4-row table untouched. It’s the cleanest and most professional version you’ll find anywhere. Enjoy! 🚀

ATR or % Based Trailing Stop for Delta Exchange (trade_crush)This indicator calculates and visually displays a dynamic trailing stop line on the chart based on either the Average True Range (ATR) or a fixed percentage of the current close price. Designed especially for futures or crypto traders using Delta Exchange, it helps determine where to place trailing stop loss orders to manage risk effectively.

DCA Bot v7 - Cryptosa Nostra 1.0Technical Overview: Adaptive RSI DCA Bot
This is a sophisticated DCA (Dollar Cost Averaging) indicator designed for accumulating assets and managing portfolio distribution. It does not trade on simple RSI crosses. Instead, it combines multi-zone RSI analysis with ATR-based volatility triggers to execute staggered, dynamically-sized trades.
Its core feature is a "learning" engine that adapts its own settings over time. This "brain" can be trained on historical data and then applied to your real-time portfolio holdings via a "Live Override" feature.
Core Logic: How It Works
A trade is only executed when two conditions are met simultaneously:
The RSI Condition: The RSI must be inside one of the four pre-defined zones.
The Price Condition: The price must cross a "trigger line" (the green or red line) that is dynamically calculated based on volatility.
1. The Four RSI Zones
This script uses four distinct zones to determine the intent to trade:
Deep Buy Zone (Default: RSI <= 35 & Downtrend): This is the primary "value" buy signal. It only activates if the RSI is deeply oversold and the price is below the 200-period Trend MA.
Reload Buy Zone (Default: RSI 40-50 & Uptrend): This is a "buy the dip" signal. It looks for minor pullbacks during an established uptrend (price above the 200-period Trend MA).
Profit-Taking Zone (Default: RSI 70-80): Triggers a standard, small sell when the market is overbought.
Euphoria Zone (Default: RSI >= 80): Triggers a larger, more aggressive sell during extreme "blow-off" tops.
2. Dynamic Trade Sizing
The amount to buy or sell is not fixed. It scales dynamically based on how high or low the RSI is:
Buy Sizing: Spends a higher percentage of available cash when RSI is at its lowest (e.g., 35) and a smaller percentage when it's at the top of the reload zone (e.g., 50).
Sell Sizing: Sells a smaller percentage of holdings when RSI just enters the overbought zone (e.g., 70) and a much larger percentage when it's in the euphoria zone (e.g., 80+).
3. The "Adaptive Brain" (ATR Multipliers)
This is the script's learning mechanism. The green/red trigger lines are calculated as: Last Trade Price +/- (ATR * Multiplier).
This "Multiplier" is the brain. It adapts based on trade performance.
After a successful trade (as defined by profit_target_multiplier), the bot gets more confident and reduces the multiplier. This places the next trigger line closer to the price, making it more aggressive.
After a losing trade (as defined by loss_limit_multiplier), the bot gets more cautious and increases the multiplier. This places the next trigger line further away, making it more patient.
How to Use This Indicator
This script is designed to be "trained" on historical data to provide relevant signals for today.
To Train the Brain: In the settings, go to "1. Backtest Settings". Set the "Start Date (For Learning)" to a date in the past (e.g., 6 months or 1 year ago). The script will run a simulation from that date, allowing its Adaptive Multipliers (the "brain") to adjust to the market's volatility.
To See Live Signals: In "2. Live Portfolio Override", check the box "Override Backtest Balance?" and enter your real current coin and USD holdings.
Result: The "Live Status" table (top-right) will now display signals from the trained brain but will calculate the "Potential Buy %" and "Potential Sell %" based on your real portfolio. The "Buy Multi" and "Sell Multi" fields show you the brain's current learned values.

ATR Risk Display - Multi FuturesWhat This Does
I got tired of manually calculating my ATR stops and risk for different futures contracts, especially when switching between ES, NQ, and their micro versions. This indicator automatically detects what futures symbol you're trading and shows you the exact tick count and dollar risk for your stop loss.
The Problem It Solves
If you trade futures with ATR-based stops, you know the hassle:
Different contracts have different tick values
You need to calculate position risk in dollars
Switching between symbols means redoing all the math
Renko charts make it even more confusing since ATR needs to come from regular candles
This handles all of that automatically.
Key Features
Auto-detects futures symbols - ES, NQ, YM, RTY, GC, CL, and all the micros (MES, MNQ, etc.)
Shows everything you need in one line: ATR(timeframe) × multiplier = X ticks ($XXX)
Works on Renko charts - pulls ATR from regular timeframe charts (super important if you use Renko)
Adjustable position sizing - set your contract count and see total risk instantly
Clean, minimal display - just the info you need, no clutter
How to Use
Add it to any futures chart
Set your preferred ATR timeframe (I use 5-minute)
Set your ATR multiplier (I use 1.5x for my stops)
Set your contract size
That's it - the indicator handles the rest
The display will show something like: "ES ATR(5) × 1.5 = 12 ticks ($150)"
Settings Explained
ATR Timeframe: What timeframe to calculate ATR from (always uses regular candles, even on Renko)
ATR Multiplier: How many ATRs for your stop (1.5 is common, 2.0 for wider stops)
Number of Contracts: Your position size for risk calculation
Auto-Detect Symbol: Leave on unless you want to manually override
Supported Futures
Full size: ES, NQ, YM, RTY, GC, CL, ZB, ZN, 6E, 6J
Micros: MES, MNQ, MYM, M2K, MGC, MCL
Notes
Made this primarily for my own ES trading but figured others might find it useful
The tick values are based on standard CME specs
If you trade other futures, you can modify the code to add them
Works great alongside level indicators for risk management
Why This Exists
I use ATR trailing stops on all my trades and got tired of doing mental math every time I switched between charts or contracts. Especially useful if you trade both full-size and micro contracts - the risk difference is huge and easy to mess up.
Hope this helps your trading! Feel free to suggest improvements.

Enhanced Multi-Indicator StrategyEnhanced Multi-Indicator Strategy v7 is a trend-following confirmation tool that combines several classic indicators into one clear “voting system.”
Instead of relying on a single signal, this script counts how many indicators agree on a bullish or bearish bias and only fires when the majority lines up and the trend is strong.
It’s designed to help you:
Filter out low-quality signals
Avoid trading against the dominant trend
Get clean, one-time BUY/SELL markers instead of noisy spam signals
How it Works
The indicator evaluates up to 10 components on each bar:
Trend & Structure
Moving Average (MA 50)
EMA Fast (20) vs EMA Slow (50)
Momentum
RSI (14)
MACD (12/26/9)
KDJ
Volatility & Price Location
Bollinger Bands (20, 2)
VWAP
Volume
Volume vs Volume MA (20)
Trend Strength & Direction
ADX + DMI (trend strength and up/down direction)
Optional
Ichimoku Cloud (price vs Senkou A/B)
Each indicator votes bullish or bearish.
The script then:
Counts how many are bullish → bullish_count
Counts how many are bearish → bearish_count
Requires at least Min Indicators for Entry (user-defined) to agree in one direction
Requires ADX above a threshold (default 20) to confirm trend strength
(Optionally) forces entries to follow the DMI trend:
Longs only in uptrends
Shorts only in downtrends
Only when these conditions are met does the script consider a valid long zone or short zone.
Signals: 1x Fire + Cooldown
To keep the chart clean and prevent over-trading:
A BUY arrow is plotted only on the first bar when price enters a new bullish zone.
A SELL arrow is plotted only on the first bar when price enters a new bearish zone.
A cooldown (in bars) can be configured separately for BUY and SELL so the script will not fire again in the same direction too frequently.
Background colors (optional):
Green background = bullish zone (majority indicators bullish + strong trend)
Red background = bearish zone (majority indicators bearish + strong trend)
This makes it easy to see when the “environment” is favorable for longs or shorts, while the arrows highlight the first opportunity in each zone.
Inputs & Tuning
Key inputs:
Min Indicators for Entry – how many indicators must agree (e.g. 5–7 for stricter filtering)
Strict Trend Filter – if enabled, entries must follow DMI trend (recommended for trend-following)
Cooldown BUY / SELL – minimum number of bars before a new signal in the same direction
Toggles to enable/disable each component (MA, EMA, RSI, MACD, KDJ, BB, Volume, VWAP, ADX, Ichimoku)
General ideas:
Increase Min Indicators for Entry and/or cooldown to reduce the number of signals and focus on stronger trends.
Lower values will make the indicator more active, suitable for shorter-term trading or scalping.
Important Note
This is an indicator, not a full trading system:
It does not manage entries/exits, position sizing, or risk by itself.
Always combine it with your own risk management, stop-loss / take-profit rules, and higher-timeframe context.
Use it as a confirmation / regime tool:
Trade only in the direction of the active zone,
Take BUY signals during bullish regimes,
Take SELL signals during bearish regimes.

orb cody hoskinscody orb designed a 15 min range orb indicator for people to use dur8ng market open in asian and new york
ORB + INMERELO ADR + ATRThis indicator provides **two completely different but complementary lines of information** for intraday traders:
# **1. The ORB Line (ADR-Based Context Line)**
The ORB portion of the script focuses on **range expansion** relative to typical daily behavior.
### **What it measures**
* **20-day ADR (Average Daily Range)**
* **Today’s range as a % of ADR**
* **How much of the average range has been “used”** by the time you’re considering an Opening Range Breakout
### **Why it matters for ORB trading**
Successful ORBs thrive when:
* **ADR used% is low** (green) → plenty of fuel left for expansion
* **ADR used% is moderate** (orange) → breakout still possible but less explosive
* **ADR used% is high** (red) → breakout attempts often fail or reverse
### **What the indicator gives you**
A clean, color-coded readout of:
* ADR
* Today’s range
* Used%
* A simple green/orange/red evaluation of ORB quality
This allows a trader to quickly judge whether **conditions favor ORB continuation or mean-reversion reversal**—without manually calculating ranges or switching charts.
---
# **2. The INMERELO Line (ATR Stretch + MA Interaction)**
The INMERELO portion of the script is built around **mean-reversion mechanics**:
the market tends to revert back toward the **first daily MA it crosses under**.
### **How it determines the active MA**
At the start of each session, the script waits for price to cross under:
* **EMA10**
* **EMA21**
* **SMA50**
Whichever MA is crossed first becomes the **active MA** for the day.
If no cross has occurred yet, the indicator shows the **nearest MA**, so traders know exactly what the likely “INMERELO magnet” will be.
### **What it measures**
* **Stretch from the active MA (in ATR units)**
* **20-day ATR regime direction (expanding or contracting)**
* **Daily MA context: E10, E21, or S50**
### **Why it matters for INMERELOs**
This provides:
* The **target MA**
* The **distance to that MA in ATRs**
* A color-coded stretch score:
* **0.6–1.2 ATR** → prime INMERELO zone (Green)
* Moderately stretched → Orange
* Overstretched or dead zone → Red
An up/down arrow shows whether **volatility is expanding or compressing**, which affects expected retrace behavior.
### **What the indicator gives you**
All INMERELO data is displayed in a second compact line:
* Stretch to MA
* Active MA label (E10/E21/S50)
* ATR regime arrow
This allows fast identification of high-probability **mean-reversion trades back to the MA**.
---
# **Summary**
This indicator shows:
### **Line 1 → ORB Context (ADR)**
* Is the stock setup for a powerful breakout?
* How much ADR is left?
* Are you early (good) or late (risky)?
### **Line 2 → INMERELO Context (ATR + MA Stretch)**
* Which MA is in control today (EMA10, EMA21, or SMA50)?
* How many ATRs away from that MA are we?
* Is volatility expanding or contracting?
* Is this a clean INMERELO setup or not?
Together, these two lines give traders the **two most important intraday lenses**:
**range expansion (ORB)** and **mean reversion (INMERELO)**—updated every bar, without clutter.

Smart TP Manager - FREE Edition📘 Smart TP Manager - User Guide
🎯 Parameter Adaptation by Timeframe
IMPORTANT: Default parameters are optimized for M5 (5 minutes). If you trade on other timeframes, you MUST adapt the parameters for better results.
📊 Recommended Settings Table
M1 (1 minute) - Ultra Scalping
ATR SL Multiplier: 1.5 - 1.8
Number of TPs: 3 - 4
Base RR: 0.4 - 0.5
Confirmation Bars: 2
Cooldown: 3 - 5 bars
Breakeven: Enable after TP1
Profile: Very fast trades, immediate exits, tight SL
M5 (5 minutes) - Scalping ✅ DEFAULT
ATR SL Multiplier: 1.8 - 2.0
Number of TPs: 4 - 5
Base RR: 0.5 - 0.6
Confirmation Bars: 2 - 3
Cooldown: 5 - 8 bars
Breakeven: Enable after TP1 or TP2
Profile: Standard scalping, balance between speed and security
M15 (15 minutes) - Intraday
ATR SL Multiplier: 2.0 - 2.2
Number of TPs: 5 - 6
Base RR: 0.6 - 0.8
Confirmation Bars: 3
Cooldown: 8 - 10 bars
Breakeven: Enable after TP2
Profile: Intraday trading, 3-8 trades per day
H1 (1 hour) - Swing
ATR SL Multiplier: 2.2 - 2.5
Number of TPs: 5 - 6
Base RR: 0.8 - 1.0
Confirmation Bars: 3 - 4
Cooldown: 10 - 15 bars
Breakeven: Enable after TP2 or TP3
Profile: Swing trading, 1-3 trades per day
H4 (4 hours) - Position
ATR SL Multiplier: 2.5 - 3.0
Number of TPs: 6
Base RR: 1.0 - 1.2
Confirmation Bars: 4 - 5
Cooldown: 15 - 20 bars
Breakeven: Enable after TP3
Profile: Position trading, multi-day trades
🔍 Adaptation Logic
General Rule:
LOWER Timeframe → TIGHTER Parameters
HIGHER Timeframe → WIDER Parameters
Why Adapt?
1. ATR SL Multiplier
M1: Very volatile market, fast moves → Tight SL (1.5-1.8)
H4: Slow moves, breathing room needed → Wide SL (2.5-3.0)
2. Number of TPs
M1: Quick exits before reversal → 3-4 TPs
H4: Let profits run → 6 TPs
3. Base RR
M1: Close targets, quick exits → 0.4-0.5
H4: Ambitious targets, patience → 1.0-1.2
4. Confirmation Bars
M1: Fast entry, 2 candles enough
H4: Strong confirmation needed, 4-5 candles
5. Cooldown
M1: Multiple trades per hour possible → 3-5 bars
H4: Important spacing between trades → 15-20 bars
6. Breakeven
M1: Immediate protection after TP1
H4: Let trade breathe, BE after TP3
💡 Real Examples
Example 1: Gold M1 Scalping
Goal: 10-20 trades/day, ultra-fast exits
Recommended Parameters:
- ATR SL: 1.6
- TPs: 4
- Base RR: 0.5
- Confirmation: 2
- Cooldown: 5
- BE: ON after TP1
Expected Results:
- Winrate: 40-50%
- Net P/L: +3 to +6R per day
- SL: 10-15 pips
- TP1: 5-8 pips (quick exit)
Example 2: Gold M15 Day Trading
Goal: 3-6 trades/day, let it breathe
Recommended Parameters:
- ATR SL: 2.1
- TPs: 5
- Base RR: 0.7
- Confirmation: 3
- Cooldown: 10
- BE: ON after TP2
Expected Results:
- Winrate: 50-60%
- Net P/L: +5 to +10R per day
- SL: 20-30 pips
- TP1: 14-21 pips
Example 3: Gold H1 Swing Trading
Goal: 1-2 trades/day, maximum patience
Recommended Parameters:
- ATR SL: 2.4
- TPs: 6
- Base RR: 0.9
- Confirmation: 4
- Cooldown: 12
- BE: ON after TP2
Expected Results:
- Winrate: 55-65%
- Net P/L: +8 to +15R per week
- SL: 40-60 pips
- TP1: 36-54 pips
⚠️ Common Mistakes to Avoid
❌ MISTAKE #1: Using same parameters on all timeframes
M1 with ATR SL 2.5 → SL too wide, huge losses
H4 with ATR SL 1.5 → SL too tight, constant stop outs
❌ MISTAKE #2: Too many TPs on low timeframe
M1 with 6 TPs → Impossible to reach all TPs
❌ MISTAKE #3: Too long confirmation on M1
M1 with 5 confirmation bars → Misses all fast moves
❌ MISTAKE #4: Too short cooldown on H4
H4 with 3 bars cooldown → Overtrading, too many poor-quality trades
🎯 Testing Methodology
Step 1: Start with recommended values
Use the table above according to your timeframe
Step 2: Backtest on minimum 100 trades
Observe:
Winrate
Net P/L in R
Number of BE hits
Trade frequency
Step 3: Adjust based on results
If too many SL hits:
↑ Increase ATR SL Multiplier by +0.2
↑ Increase Confirmation Bars by +1
If not enough trades:
↓ Reduce Cooldown by -2
↓ Reduce Confirmation Bars by -1
If TPs never reached:
↓ Reduce Number of TPs by -1
↓ Reduce Base RR by -0.1
If too many BE but no real wins:
↑ Increase Base RR by +0.1
Disable BE temporarily
📈 Performance Tracking
Key indicators by timeframe:
TFTrades/DayMin WinrateNet P/L/DayAvg SL (pips)M110-2040%+3R10-15M55-1245%+4R15-20M153-850%+5R20-30H11-455%+3R40-60H40.5-260%+2R80-120
🚀 Final Advice
DO NOT USE THE SAME PARAMETERS ON DIFFERENT TIMEFRAMES!
Each timeframe has its own dynamics. Adapting parameters is not optional, it's MANDATORY for optimal results.
Different timeframe = Different parameters = Different results
Quick Reference Chart
M1 → AGGRESSIVE (tight SL, few TPs, quick BE)
M5 → BALANCED (default settings)
M15 → MODERATE (wider SL, more TPs)
H1 → PATIENT (wide SL, max TPs, late BE)
H4 → CONSERVATIVE (very wide SL, all TPs, very late BE)
📝 Best Practices
Always backtest on your specific timeframe before live trading
Start conservative - use higher ATR multipliers first
Track your stats - Wins, Losses, BE, Net P/L
Adjust gradually - change one parameter at a time
Respect your timeframe - don't force H4 parameters on M1
Use breakeven wisely - protect profits but don't choke trades
Monitor cooldown - too many trades = lower quality
🎓 Understanding the Strategy
EMA 9/21 Crossover
BUY: EMA9 crosses above EMA21
SELL: EMA9 crosses below EMA21
RSI Filter
Avoids overbought (>70) for longs
Avoids oversold (<30) for shorts
Confirmation System
Requires X consecutive candles meeting conditions
Reduces false signals
Take Profit Structure
Non-linear TP levels
TP1: 0.5R (default)
TP2: 1.0R
TP3: 1.5R
TP4: 2.0R
TP5: 2.5R
Risk Management
ATR-based stop loss (adapts to volatility)
Optional breakeven after specified TP
Cooldown prevents overtrading
🌟 Pro Tips
Gold (XAUUSD) specific: Use tighter parameters than forex pairs
NY Session: More volatility, tighter SL recommended
Asian Session: Lower volatility, consider skipping or wider SL
News events: Increase cooldown before/after major news
Trending markets: Increase Number of TPs
Ranging markets: Decrease Number of TPs, faster exits
Happy Trading! 🎯
Remember: Past performance does not guarantee future results. Always use proper risk management and never risk more than you can afford to lose.


KDH v2.0 (English) Trading Strategy Indicator# KDH Diamond Strategy v3.3 - TradingView Description
---
## 🇬🇧 ENGLISH VERSION
### 📊 KDH Diamond Strategy v3.3
**Professional High-Leverage Futures Trading System**
---
#### 🎯 Overview
KDH Diamond is an advanced algorithmic trading strategy specifically optimized for **1-hour timeframe futures trading** with high-leverage environments. Built on proven institutional concepts including Fair Value Gaps (FVG), Volume Profile analysis, and multi-layered confirmation filters, this strategy delivers consistent results without repainting.
---
#### ✨ Key Features
**🔥 Optimized for 1H Timeframe**
- Extensively backtested across multiple markets
- Highest profit rate achieved on 1-hour charts
- Perfect for swing traders and active position management
**🎨 No Repainting - 100% Reliable Signals**
- All signals are confirmed and locked on bar close
- What you see in backtest is what you get in real-time
- Complete transparency with `calc_on_order_fills=true`
**💎 Automated Risk Management**
- Automatic Stop Loss and Take Profit calculation
- Intelligent SL/TP placement based on market structure
- Built-in position sizing controls (adjustable % per trade)
**🚀 High-Leverage Futures Optimized**
- Designed specifically for leveraged futures trading
- Risk-reward ratios calibrated for 10-20x leverage environments
- Precision entry timing to maximize profit potential
**🔄 Advanced Position Management**
- Automatic reversal entries at TP levels
- Multiple re-entry opportunities per signal
- Dynamic trade management based on market conditions
**🎛️ Multi-Layer Confirmation System**
- **SMA50 Filter (1H)**: Trend alignment confirmation
- **Momentum Filter**: KAMA-based directional strength
- **RSI Divergence Filter**: Reversal detection at extremes
- **Volume Profile Filter**: Order flow and liquidity analysis
---
#### 📈 How It Works
**Signal Generation**
The strategy identifies **Inverted Fair Value Gaps (IFVG)** - institutional order blocks that signal high-probability reversal or continuation zones. Each signal is validated through multiple confirmation filters before execution.
**Entry Logic**
- Limit orders placed at optimal price levels within FVG zones
- Price must touch the midline and close in favorable direction
- All filters must align for signal activation
**Exit Strategy**
- Stop Loss: Placed at the next opposing FVG level
- Take Profit: Calculated using nearest FVG in profit direction
- Automatic reversal entry option at TP levels
**Visual System**
- Color-coded boxes show FVG zones (green/red)
- Real-time position tracking with entry, SL, and TP lines
- Comprehensive dashboard displaying filter status and P&L
---
#### 🎯 Who Is This For?
✅ **Perfect For:**
- Futures traders using 10-20x leverage
- Traders seeking systematic, rule-based strategies
- Those who want automated SL/TP management
- 1-hour chart swing traders
- Traders familiar with institutional concepts (FVG, order flow)
❌ **Not Ideal For:**
- Scalpers (designed for 1H timeframe)
- Spot-only traders (optimized for leveraged futures)
- Beginners unfamiliar with leverage risks
- Set-and-forget automated trading (requires monitoring)
---
#### 📊 What You Get
**Strategy Features:**
- Complete FVG detection and inversion system
- 4 professional-grade confirmation filters
- Automated SL/TP calculation and placement
- TP reversal entry system
- Volume Profile sentiment analysis
- Real-time position tracking dashboard
- Webhook alert support for automation
- Clean, organized code with detailed comments
**Visual Components:**
- FVG boxes with inversion coloring
- Volume Profile sentiment boxes (optional)
- Entry, SL, and TP lines for each position
- Position status table with live P&L
- Filter status dashboard
---
#### ⚙️ Customization Options
**Adjustable Filters (User Control):**
- SMA50 Filter (1H) - Trend alignment ON/OFF
- Momentum Filter - Directional strength ON/OFF
- RSI Divergence Filter - Reversal detection ON/OFF
- Volume Profile Filter - Order flow analysis ON/OFF
**Fixed Parameters (Optimized):**
- All core parameters are pre-optimized for 1H timeframe
- Ensures consistent performance without overwhelming options
- Prevents parameter over-fitting by users
---
#### ⚠️ Important Disclaimers
**Risk Warning:**
This strategy is designed for leveraged futures trading, which carries substantial risk. High leverage (10-20x) can result in rapid losses. Only trade with capital you can afford to lose.
**Performance:**
Past performance does not guarantee future results. Always backtest on your specific market and timeframe before live trading.
**Usage:**
This is a trading tool, not financial advice. Users are responsible for their own trading decisions and risk management.
**Requirements:**
- Understanding of futures trading and leverage
- Familiarity with Fair Value Gaps and institutional concepts
- Ability to monitor positions (not fully automated)
- Proper risk management discipline
---
#### 🔧 Technical Specifications
- **Platform:** TradingView Pine Script v5
- **Type:** Strategy (with backtesting capabilities)
- **Timeframe:** Optimized for 1H (works on other timeframes)
- **Markets:** Any futures market (crypto, stocks, indices, forex)
- **Repainting:** NO - All signals are final on bar close
- **Alerts:** Full webhook support for automation
- **Default Settings:** 10% position size, pyramiding enabled (max 10 positions)
---
#### 📞 Support
Questions about setup or usage? Contact the author through TradingView messages.
**Note:** This indicator is for educational and trading tool purposes only. The author is not responsible for trading losses. Trade responsibly and within your risk tolerance.

Average True Range Stop Loss Finder [MasterYodi]This indicator utilizes the Average True Range (ATR) to help traders identify optimal stop-loss levels that reduce the risk of premature exits caused by market volatility or tight stop placements. The default multiplier is set to 1.5, providing a balanced stop-loss buffer. For more conservative setups, a multiplier of 2 is recommended; for tighter risk management, use 1.
ATR values and corresponding stop-loss levels are displayed in a table at the bottom of the chart.
Use the high-based (red) level for short positions
Use the low-based (teal) level for long positions

ATR (No Gap) - Advanced Volatility IndicatorA customizable Average True Range indicator that eliminates gap distortion between trading sessions, providing cleaner volatility measurements for intraday and swing traders.
Key Features:
Gap Filtering: Optional toggle to ignore overnight/weekend gaps that distort volatility readings
EMA Smoothing: Defaults to EMA for more responsive volatility tracking (also supports RMA and SMA)
Half ATR Display: Shows 50% ATR value for quick stop-loss and take-profit calculations
Clean Value Table: Real-time values displayed on chart with configurable decimal precision
Flexible Settings: Customize length, smoothing method, and display options
Ideal for:
Setting dynamic stop losses and take profits
Position sizing based on current volatility
Comparing gap vs. no-gap volatility measurements
Trading instruments with large overnight gaps (indices, forex, crypto)
Use this indicator to get a more accurate picture of intraday volatility without the noise from session gaps!

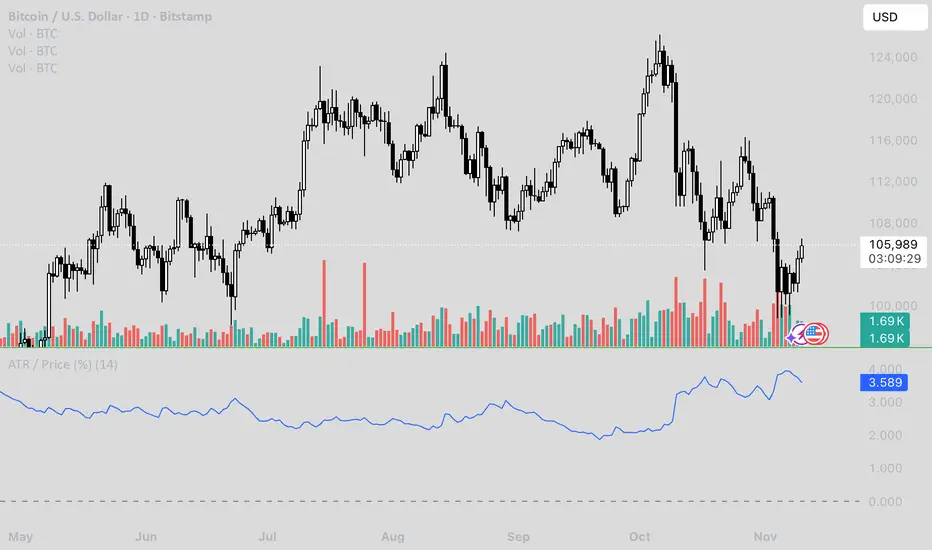
ATR / Price RatioDescription:
This indicator plots the ratio of the Average True Range (ATR) to the current price, showing volatility as a percentage of price rather than in absolute terms. It helps compare volatility across assets and timeframes by normalizing for price level.
A higher ATR/Price ratio means the market is moving a larger percentage of its value each bar (high relative volatility). A lower ratio indicates tighter, quieter price action (low relative volatility).
Traders can use this ratio to:
• Compare volatility between instruments
• Identify shifts into high or low volatility regimes
• Adjust position sizing and stop distances relative to risk
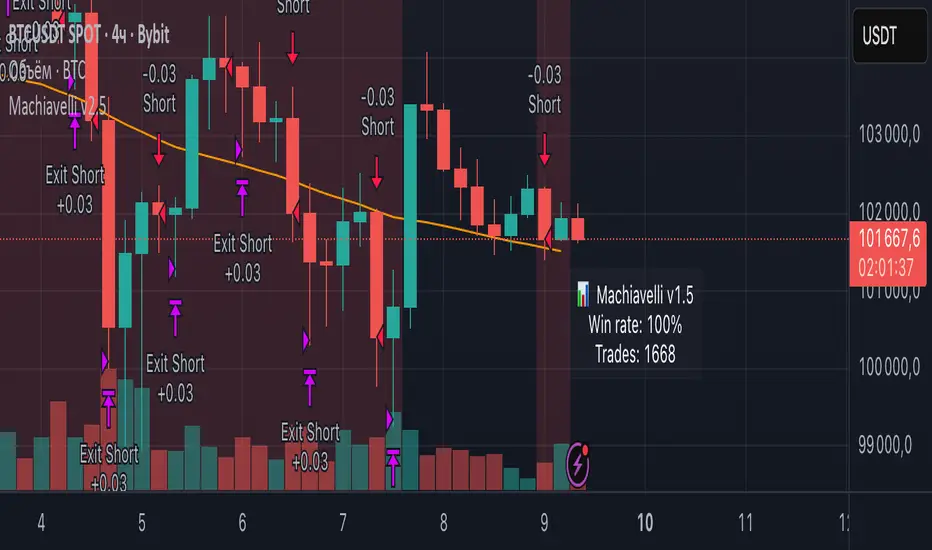
Machiavelli v2.5The purpose of this script is straightforward — to provide a reliable source of passive income.
Results speak for themselves.
Whale Hunter🇬🇧 English Description
Whale Hunt is a simple yet powerful indicator designed to detect unusually large candles in the market.
It identifies candles exceeding a set volatility threshold based on ATR (Average True Range), marking them as “Whale Candles.”
📈 Features:
Option to include/exclude wicks in calculations
Separate color customization for bullish and bearish candles
Midpoint lines projected forward based on candle size
Adjustable ATR period and multiplier
💡 Use Cases:
Detecting strong market moves
Observing volatility spikes
Identifying liquidity grabs
⚠️ Disclaimer:
This indicator is for educational purposes only and does not constitute financial advice.

Adaptive CE-VWAP Breakout Framework [KedArc Quant]Description
A structured framework that unites three complementary systems into one charting engine:
Chandelier Exit (CE) – ATR-based trailing logic that defines trend direction, stop placement, and risk/reward overlays.
Swing-Anchored VWAP (SWAV) – a dynamically anchored VWAP that re-starts from each confirmed swing and adapts its smoothness to volatility.
Pivot S/R with Volume Breaks – confirmed horizontal levels with alerts when broken on expanding volume.
This script builds a single workflow for bias → trigger → managementwithout mixing unrelated indicators. Each module is internally linked rather than layered cosmetically, making it a true analytical framework—not.
Acknowledgment
Special thanks to Dynamic Swing Anchored VWAP by Zeiierman, whose swing-anchoring concept inspired a part of the SWAV module’s implementation and adaptation logic.
Support and Resistance Levels with Breaks by LuxAlgo for S/R breakout logic.
How this helps traders
Trend clarity – CE color-codes direction and provides evolving stops.
Context value – SWAV traces adaptive mean paths so traders see where price is heavy or light.
Action filter – Pivot+volume logic highlights true structural breaks, filtering false moves.
Discipline tool – Optional R:R boxes visualize risk and target zones to enforce planning.
Entry / Exit guidelines (for study purposes only)
Bias Use CE direction: green = long bias red = short bias
Entry
1. Breakout method– Trade in CE direction when a pivot level breaks on valid volume.
2. VWAP confirmation– Prefer breaks occurring around the nearest SWAV path (fair-value cross or re-test).
Exit
Stop = CE line / recent swing HL / ATR × (multiplier)
Target = R-multiple × risk (default 2 R)
Optional live update keeps SL/TP aligned with current CE state.
Core formula concepts
ATR Stop: Stop = High/Low – ATR × multiplier
VWAP calc: Σ(price × vol) / Σ(vol) anchored at swing pivot, adapted by APT (Adaptive Price Tracking) ratio ∝ ATR volatility.
Volume oscillator: 100 × (EMA₅ – EMA₁₀)/EMA₁₀; valid break when threshold %.
Input configuration (high-level)
Master Controls
Show CE / SWAV modules Theme & Fill opacity
CE Section
ATR period & multiplier Use Close for extremums
Show buy/sell labels Await bar confirmation
Risk-Reward overlay: R-multiple, Stop basis (CE/Swing/ATR×), Live update toggle
SWAV Section
Swing period Adaptive Price Tracking length Volatility bias (ATR-based adaptation) Line width
Pivot & Volume Breaks
Left/Right bar windows Volume threshold % Show Break labels and alerts
Best timeframes
Intraday: 5 m – 30 m for breakout confirmation
Swing: 1 h – 4 h for trend context
Settings scale with instrument volatility—adjust ATR period and volume threshold to match liquidity.
Glossary
ATR: Average True Range (volatility metric)
CE: Chandelier Exit (trailing stop/trend filter)
SWAV: Swing-Anchored VWAP (anchored mean price path)
Pivot H/L: Confirmed local extrema using left/right bar windows
R-multiple: Profit target as a multiple of initial risk
FAQ
Q: Does it repaint? A: No—pivots wait for confirmation and VWAP updates forward-only.
Q: Can modules be disabled? A: Yes—each section has its own toggle.
Q: Can it trade automatically? A: This is an indicator/study, not an auto-strategy.
Q: Is this financial advice? A: No—educational use only.
Disclaimer
This script is for educational and analytical purposes only.
It is not financial advice. Trading involves risk of loss. Past performance does not guarantee future results. Always apply sound risk management.

BB SPY Mean Reversion Investment StrategySummary
Mean reversion first, continuation second. This strategy targets equities and ETFs on daily timeframes. It waits for price to revert from a Bollinger location with candle and EMA agreement, then manages risk with ATR based exits. Uniqueness comes from two elements working together. One, an adaptive band multiplier driven by volatility of volatility that expands or contracts the envelope as conditions change. Two, a bias memory that re arms the same direction after any stop, target, or time exit until a true opposite signal appears. Add it to a clean chart, use the markers and levels, and select on bar close for conservative alerts. Shapes can move while the bar is open and settle on close.
Scope and intent
• Markets. Currently adapted for SPY, needs to be optimized for other assets
• Timeframes. Daily primary. Other frames are possible but not the default
• Default demo. SPY on daily
• Purpose. Trade mean reversion entries that can chain into a longer swing by splitting holds into ATR or time segments
Originality and usefulness
• Novelty. Adaptive band width from volatility of volatility plus a persistent bias array that keeps the original direction alive across sequential entries until an opposite setup is confirmed
• Failure modes mitigated. False starts in chop are reduced by candle color and EMA location. Missed continuation after a take profit or stop is addressed by the re arm engine. Oversized envelopes during quiet regimes are avoided by the adaptive multiplier
• Testability. Every module has Inputs and visible levels so users can see why a suggestion appears
• Portable yardstick. All risk and targets are expressed in ATR units
Method overview in plain language
The engine measures where price sits relative to Bollinger bands, confirms with candle color and EMA location, requires ADX for shorts(in our case long close since we use it currently as long only), and optionally requires a trend or mean reversion regime using band width percent rank and basis slope. Risk uses ATR for stop, target, and optional breakeven. A small array stores the last confirmed direction. While flat, the engine keeps a pending order in that direction. The array flips only when a true opposite setup appears.
Base measures
• Range basis. True Range smoothed over a user defined ATR Length
• Return basis. Not required
Components
• Bollinger envelope. SMA length and standard deviation multiplier. Entry is based on cross of close through the band with location bias
• Candle and EMA filter. Close relative to open and close relative to EMA align direction
• ADX gate for shorts. Requires minimum trend strength for short trades
• Adaptive multiplier. Band width scales using volatility of volatility so envelopes breathe with conditions
• Regime gate optional. Band width percent rank and basis slope identify trend or mean reversion regimes
• Risk manager. ATR stop, ATR target, optional breakeven, optional time exit
• Bias memory. Array stores last confirmed direction and re arms entries while flat
Fusion rule
Minimum satisfied gates count style. All required gates must be true. Optional gates are controlled in Inputs. Bias memory never overrides an opposite confirmed setup.
Signal rule
• Long setup when close crosses up through the lower band, the bar closes green, and close is above the long EMA
• Short setup when close crosses down through the upper band, the bar closes red, close is below the short EMA, and ADX is above the minimum
• While flat the model keeps a pending order in the stored direction until a true opposite setup appears
• IN LONG or IN SHORT describes states between entry and exit
What you will see on the chart
• Markers for Long and Short setups
• Exit markers from ATR or time rules
• Reference levels for entry, stop, and target
• Bollinger bands and optional adaptive bands
Inputs with guidance
Setup
• Signal timeframe. Uses the chart timeframe
• Invert direction optional. Flips long and short
Logic
• BB Length. Typical 10 to 50. Higher smooths more
• BB Mult. Typical 1.0 to 2.5. Higher widens entries
• EMA Length long. Typical 10 to 50
• EMA Length short. Typical 5 to 30
• ADX Minimum for short. Typical 15 to 35
Filters
• Regime Type. none or trend or mean reversion
• Rank Lookback. Typical 100 to 300
• Basis Slope Length and Threshold. Larger values reduce false trends
Risk
• ATR Length. Typical 10 to 21
• ATR Stop Mult. Typical 1.0 to 3.0
• ATR Take Profit Mult. Typical 2.0 to 5.0
• Breakeven Trigger R. Move stop to entry after the chosen multiple
• Time Exit. Minimum bars and extension when profit exceeds a fraction of ATR
Bias and rearm
• Bias flips kept. Array depth
• Keep rearm when flat. Maintain a pending order while flat
UI
• Show markers and levels. Clean defaults
Usage recipes
Alerts update in real time and can change while the bar forms. Select on bar close for conservative workflows.
Properties visible in this publication
• Initial capital 25000
• Base currency USD
• If any higher timeframe calls are enabled, request.security uses lookahead off
• Commission 0.03 percent
• Slippage 3 ticks
• Default order size method Percent of equity with value 5
• Pyramiding 0
• Process orders on close On
• Bar magnifier Off
• Recalculate after order is filled Off
• Calc on every tick Off
Realism and responsible publication
No performance claims. Costs and fills vary by venue. Shapes can move intrabar and settle on close. Strategies use standard candles only.
Honest limitations and failure modes
High impact releases and thin liquidity can break assumptions. Gap heavy symbols may require larger ATR. Very quiet regimes can reduce contrast in the mean reversion signal. If stop and target can both be touched inside one bar, outcome follows the TradingView order model for that bar path.
Regimes with extreme one sided trend and very low volatility can reduce mean reversion edges. Results vary by symbol and venue. Past results never guarantee future outcomes.
Open source reuse and credits
None.
Backtest realism
Costs are realistic for liquid equities. Sizing does not exceed five percent per trade by default. Any departure should be justified by the user.
If you got any questions please le me know

QuantumFlow MTF System Extended
QuantumFlow MTF System Extended
Multi-Timeframe Directional Flow & Volatility Alignment Engine — Higher-Timeframe Edition
The QuantumFlow MTF System Extended is a higher-timeframe analytical framework that expands upon the original QuantumFlow concept.
While the base version focuses on short-term structures (1M – 15M), this edition is designed for traders who need to observe medium- to long-term directional harmony across the 30M, 45M, 1H, 2H, 3H and 4H timeframes.
Its purpose is to provide a structured, non-repainting overview of how momentum and volatility align over broader market horizons — helping traders understand the prevailing directional flow rather than predicting future prices.
Concept
The system aggregates confirmed Supertrend directions from each higher timeframe, converting them into normalized bullish or bearish values.
These values are then processed through dual-layer EMA momentum filters that validate the directional strength of each component.
The resulting matrix displays a precise snapshot of how higher-timeframe market structures are synchronized — serving as a compass of directional alignment rather than a buy/sell signal generator.
A multi-ATR framework defines adaptive volatility zones, allowing each instrument to react proportionally to its intrinsic volatility profile.
This approach smooths sensitivity shifts that often occur between intraday and multi-hour structures, delivering consistent analytical behavior across asset classes.
How It Works
Confirmed Multi-Timeframe Supertrend
Each timeframe produces a close-confirmed Supertrend direction, ensuring signal stability and preventing repainting.
Adaptive Multi-ATR Model
Multiple ATR instances with distinct deviation factors define dynamic volatility thresholds that self-adjust to market conditions.
Dual EMA Momentum Validation
Two independent EMA layers filter and confirm each Supertrend direction, improving directional clarity and reliability.
Flow Totals Engine
The indicator sums all timeframe states into real-time bullish/bearish totals and percentage ratios, clearly visualized within a single panel.
Configurable Alerts (Optional)
Users may set threshold-based alerts when directional alignment reaches specified intensity levels (for example, when all timeframes are synchronized).
Full Customization
All visual elements — colors, text, background, and layout — can be adjusted to match personal preferences or chart themes.
Intended Use and Benefits
Observe how higher-timeframe trends align to reveal medium-term directional bias.
Quantify the balance of bullish vs bearish momentum across multiple timeframes.
Combine with lower-timeframe analysis (e.g. the original QuantumFlow System) to establish multi-layer confirmation between short- and mid-term flows.
Maintain awareness of trend synchronization or divergence without relying on subjective chart interpretation.
This indicator does not provide trading signals, forecasts, or financial advice.
It is an analytical tool intended to assist users in studying market structure and volatility behavior.
Chart Display
QuantumFlow Extended presents a unified dashboard that lists each analyzed timeframe, its active directional state, and the overall flow balance in numeric and percentage form.
It functions seamlessly on all instruments and can be used standalone or alongside the original short-term version.
Access
This is an invite-only indicator.
To request access or additional information, please contact the author privately via the TradingView profile.

ATR SL/TP Precision Zones (Dots)ATR SL/TP Precision Zones (Dots) is a volatility-based tool designed to help traders set accurate Stop Loss and Take Profit levels based on real market volatility — not fixed pips or emotion.
This indicator uses ATR (Average True Range) multiplied by 1.2 to calculate dynamic distance bands.
Instead of drawing a ribbon or channel, it places simple dots above and below each candle:
Upper Dot (Green) → Suggested Take Profit / Price Stretch Zone
Lower Dot (Red) → Suggested Stop Loss Cushion / Support Expansion Zone
Because ATR measures market volatility, these dots expand during high volatility and tighten during slow markets, helping traders avoid stop-loss hunts and premature exits.
Why This Works
Most traders lose because:
They set SL too close → stopped out by noise
They set TP too far → price never reaches it
This tool calibrates those distances automatically based on real price movement behavior.
ATR = volatility
Volatility = market breathing room
This indicator ensures your trade has room to breathe, increasing win consistency.
Best Use Cases
Scalping
Swing trading
Trend continuation entries
Reversal confirmations with support/resistance
Works on Crypto / Forex / Stocks / Futures

ATR-Based Volatility SL/Target Planner (MTF Table)✅ ATR SL & Target Planner (MTF Table – Chart, 10m, 15m)
This indicator provides a clean multi-timeframe ATR table showing:
✅ ATR (Chart / 10m / 15m)
✅ Entry price (manual or auto)
✅ ATR-based Stop-Loss
✅ Target 1 & Target 2
✅ MTF level comparison
✅ High-contrast color-coded SL (Red) + Targets (Green)
✅ Selected timeframe highlighted automatically
Designed for intraday traders, positional traders, and volatility-based strategies.
✅ How to Use It
✅ 1. Choose Entry Mode
Manual Entry ON → Type your entry price
Manual Entry OFF → Last candle close is used
The script calculates ATR(14) on:
Current chart timeframe
10-minute timeframe
15-minute timeframe
Then it uses standard volatility-based formulas:
Stop-Loss = Entry ± (ATR × SL Multiplier)
Target 1 = Entry ± (ATR × T1 Multiplier)
Target 2 = Entry ± (ATR × T2 Multiplier)
Direction depends on Long/Short mode.
You can switch which ATR timeframe becomes active (affecting plotted lines + alerts).
✅ Why This Indicator Is Useful
This script solves 3 common problems:
✅ 1. “How wide should my stop-loss be?”
ATR automatically adjusts the SL to market volatility.
✅ 2. “Which timeframe ATR should I trust?”
You can compare Chart, 10m, and 15m in one panel.
✅ 3. “The table is too big in other indicators.”
This is compact, clean, color-coded, and readable.
Happy Trading :)