Wunder Keltner botWunder Keltner bot
1. Wunder Keltner bot is based on the breakout of the Keltner channel. For calculation, 2 channels are used, one for long trades, and the other for short trades. The division into 2 channels is used for more accurate entry calculations depending on trend directions.
2. The ADX indicator is used to filter signals and determine the trend strength. ADX determines the strength of the trend and confirms the entry into the strategy if the value is greater than the level indicated in the settings.
3. There are 3 ways to calculate Stop Loss and Take Profit. You can choose one of them:
Classic Stop Loss and Take Profit in a fixed percentage
ATR Stop Loss
Keltner. Stop Loss, which is set on the opposite Keltner’s Channel Band from Keltner breakout.
4. ATR and Keltner use Risk Reward (R:R) to calculate Take Profit. The script calculates Risk Reward based on the determined Stop loss level and uses the ration to calculate Take Profit.
5. A function for calculating risk on the portfolio (your deposit) has been added to the script. When this option is enabled, you get a calculation of the entry amount in dollars relative to your Stop Loss. In the settings, you can select the risk percentage on your portfolio. The loss will be calculated from the amount that will be displayed on the chart.
For example. Deposit - $1000, you set the risk to 1%. SL 5%. Entry volume will be $200. The loss at SL will be $10.10$ this is your 1% risk or 1% of the deposit.
Important! The risk per trade must be less than the Stop Loss value. If the risk is greater than SL, then you should use leverage.
The amount of funds entering the trade is calculated in dollars. This option was created if you want to send the dollar amount from Tradingview to the exchange. However, putting your volume in dollars you get the incorrect net profit and drawdown indication in the backtest results, as TradingView calculates the backtest volume in contracts.
To display the correct net profit and drawdown values in Tradingview Backtest results, use the ”Volume in contract” option.
Rata-Rata Rentang Sebenarnya / Average True Range (ATR)

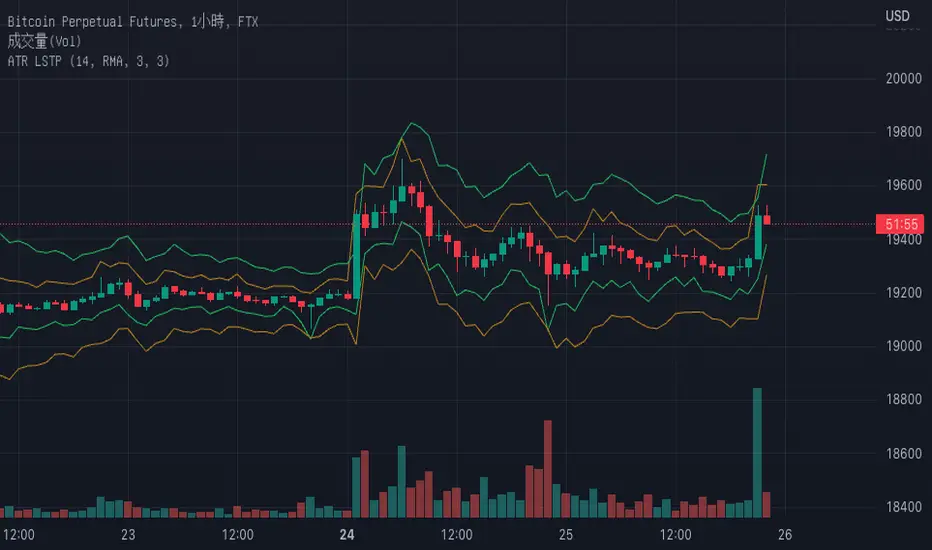
ATR+ Advanced Sessions ATR for DaterangeATR+ Advanced Sessions ATR for Daterange
The ATR+ adds the following additional filters to the stock ATR indicator by Tradingview:
- Calculates the overall average ATR for a user defined daterange, optionally filtered by trading session and selected weekdays, presented as a secondary line over the standard ATR line.
- Basic ATR line, with colour highlight to indicate the selected sessions, days and timeframe being calculated by the average ATR+ line.
- Average ATR+ line indicating the average of all ATRs within the defined timeframe, optionally filtered by instances of a selected trading session and selected weekdays.
- Customisable appearance.
- The ATR+ also includes the basic ATR configuration options typically found in the standard ATR by Tradingview, including period length and smoothing type. Defaults are set to the factory standards: 14 length, RMA smoothing type.
What Is the Average True Range (ATR)?
The ATR is a technical analysis tool that measures market volatility by decomposing the entire range asset price for that period. Investopedia describes the ATR as follows:
"The average true range (ATR) is a technical analysis indicator, introduced by market technician J. Welles Wilder Jr. in his book New Concepts in Technical Trading Systems, that measures market volatility by decomposing the entire range of an asset price for that period.
The true range indicator is taken as the greatest of the following: current high less the current low; the absolute value of the current high less the previous close; and the absolute value of the current low less the previous close. The ATR is then a moving average, generally using 14 days, of the true ranges."
For more information on the ATR and its calculations and use cases, see here:
Investopedia link here.
Tradingview link here.
Note
The indicator may time out if the number of bars being calculated is too long. If this happens, you will need to reduce the datetime range, or increase the chart timeframe in order to reduce the number of bars being calculated and the indicator will attempt to recalculate.

ATR Trend Run - Signals Alerts SL and TP by Tech Store OnThe script uses several ATR formulas for entering/exiting trades, support/resistance lines to take TP1 (take profit 1) and another ATR formula for TP2 (take profit 2). Everything is fully configurable to your preference, and you can back-test it via TradingView. You can also configure the indicator for signals during US trading sessions (with or without power hour), as well as taking profits/stop-loss session time(s), as well as to close a position at the end of the trading session no matter what. Also, you can turn all of that off, so there are no trading session/end of day limits and each trade will run until it either hits SL, TP1, TP1 > back to entry, TP2. Note: indicator is set to skip consecutive/opposite signals, while you currently have a trade open > if you hit a trend – ride it to the end!
For example: If you will be day trading SPY and you wish to close your positions no matter what right before the market closes (3:45PM ET > 15min before closes): Make sure to checkbox “Intraday – Close Position Before Market Closes” in the strategy/indicator Settings, so that you are alerted soon before the market closes, if you wish to continue holding the position – leave this checkbox unchecked.
SL: SL is set to be slightly above/below the signal candle, which is best suited for this strategy.
Strategy Take Profit Approach
While the initial position open and SL hit is always based on a closed candle bar (can’t do otherwise, as otherwise you will have 10s of fake signal alerts), there are 2 ways on trading this strategy in terms of TP1 and TP1 taken > back to Entry, which is based off Alert type.
You can switch this as you like within the indicator settings, “Checked: TP1 taken > back to Entry per Price Touch | Unchecked: per Candle Close”.
Candle Close vs Price Touch: with the Default method - Candle Close for an alert for TP1 or if price comes back to Entry after TP1 is taken will only be triggered once candle bar fully closes crossing the area, while Price Touch will alert when price touches the area before candle bar closes.
For example: your trade is running well, you grab TP1 and the price reverses and hits your trade Entry area. With Price Touch – you are immediately alerted to close your trade with no loss and with TP1 profit. With Candle Close - you will receive an alert only once candle bar fully closes on top of the Entry crossing it backwards, meaning it may lower your TP1 profit or even completely reverse the trade into loss in case it will be a huge candle bar for any reason. However, it may touch the Entry area, looking like the price is reversing, but then continue per initial trade direction, sometimes becoming a trend. So, while Price Touch seem like a more conservative approach, Candle Close can give you much bigger profits if you catch a trend, but you can always change it via the Settings.
Note: TradingView back-testing engine does not have a feature to open/close orders IMMEDIATELY via Price Touch trigger, but only when the candle closes after price touches the scripted area/line/etc., so you for the most accurate results, test your strategy out via Candle Close setting. Otherwise, decide yourself. I personally like more Candle Close since I can test it out via back-testing with the most accurate results.
TP2 is set per Candle Close as often the ATR trailing stop line will be hit and bounced off, so it’s best to wait until candle actually breaks it/closes through it.
Note: If you will be observing the strategy LIVE, during LIVE candle bar movement – it will look weird, like it’s placing an order after order during any trigger – this seem like a TradingView bug, but is only observational, once the candle bar is closed and you refresh TradingView it will all look correct.
Back-Testing
If you wish to do some back-testing, just modify the strategy/indicator Settings:
-----1) STRATEGY: This is for back-testing/experimenting with the script inputs.
----------a. You can setup a start date (date, month, year) from which it will start opening back-test trades, select a position size and select TP1 size, the idea here is to close half (or whatever you choose) portion of the trade once you hit your TP1, then to either close at small profit or to catch a trend and close the second portion of the position long way ahead from Entry, otherwise it will alert you to close the position at TP2, if price comes back to Entry, at reversal signal or at the end of US trading session if the option for it is checked. If you wish to close the whole position at TP1, just enter the same amount for TP1 to match backtest position size. Otherwise you can experiment with TP1 sizing – try it out!
-----2) Feel free to experiment with ATR settings and with S&R Left/Right bars, you may be amazed how results will differ and find some really cool combinations!
-----3) Make sure you select/de-select “Intraday – Close Position Before Market Closes” setting depending on what you are back-testing and on which conditions
-----4) Note: If you wish to do some deep back-testing (1+ years), use the “Deep Backtesting” feature within Strategy Tester on the TradingView as otherwise it may show wrong results or even fail to compute the results
Add the alerts
-----Right-click anywhere on the TradingView chart
-----Click on Add alert
-----Condition: ATR Trend Run - Signals Alerts SL and TP, by Tech Store On
----------o Right underneath the condition click on the drop-down menu and select “alert() function calls only”
-----Expiration time: Whatever you wish
-----Alert actions: Whatever notifications you wish
-----Alert name: DO NOT TOUCH THIS
-----Hit “Create”
-----Note: If you change ANY Settings within the indicator – you must DELETE the current alert and create a new one per steps above, otherwise it will continue triggering alerts per old Settings!
- Note: If you add the alert while the script is currently “In Position” it will not know that. So either wait when there will be no position open at all or close your position partially if the bot opens it twice bigger or so in case per script the bot will think it is already in position.
Note: Because of the slippage and the order processing time between TradingView, AutoView and the Broker (it’s usually about a second or so), it is suggested to not use a timeframe lower than 1min. The script is working really well with 1M/3M/5M/H1/H4 timeframes per my back-testing, but feel free to explore via Strategy Back-testing what’s best for the instrument you wish to trade.
If you wish to try this out for a week or so – please reach out and I will give you access.

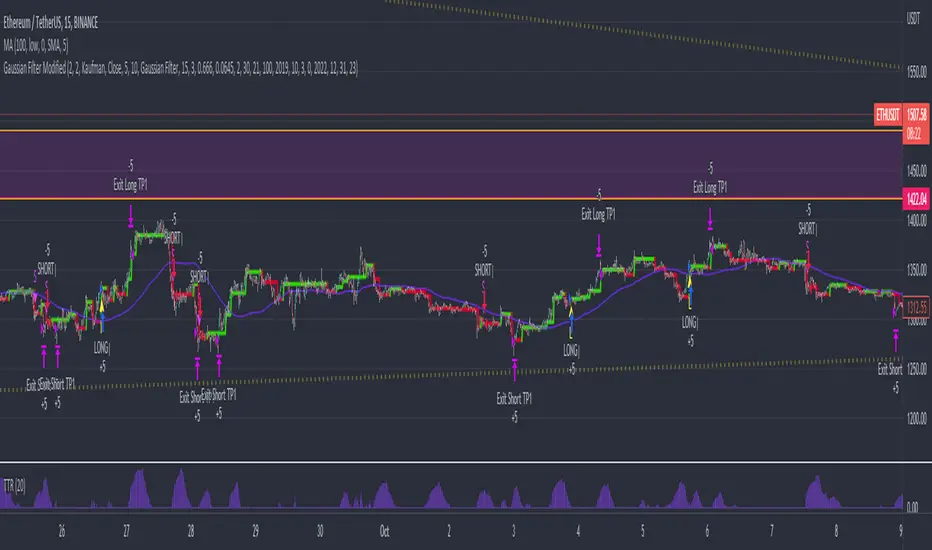
Gaussian Filter ModifiedAn effort to enhance auto-trading based on Gaussian Filter with Standard Deviation Filtering, Trading True Range and Smoothed SMA was added to remove noise contributing to ranging markets and unwanted entries against established trend.
Gaussian parameters need to be adjusted for different asset pair to find its own "signature", then filter out bad entry with TTR and SMA.
*Credits to Loxx for his work on Gaussian Filter
Interactive ATR Stop-Loss [TANHEF]This indicator is "Interactive" which means some inputs can are manually added through the first click after adding the indicator to the chart (ATR Trailing Stop-loss start point). See images below for more explanation.
Why use a trailing stop-loss?
A trailing stop-loss provides an exit when price moves against you but also enables you to move the exit point further into profit when price is moving in the desired direction of a trade. The ATR (Average True Range) which is used to measure volatility, is very effective at functioning as a trailing stop loss.
Indicator Explanation
Initially when this indicator is added to the chart, you will be prompted to select where to begin the ATR Trailing Stop-loss.
For a long stop-loss, select below price.
For a short stop-loss, select above price.
After this indicator is placed, it can be modified via dragging or from within the settings by modifying the time and the price input. Or simply re-add the indicator to the chart.
The ATR Stop Loss plotted. Note that the trailing value that is considered as the stop loss value is the value of the ATR from the prior candle. The settings for the ATR calculation can be modified within the settings.
An optional fixed profit target can be added within the settings. This profit target will only actively be plotted when the ATR Trailing Stop-loss has not be hit hit yet or until the profit target has been hit.
Here shows that the profit target was hit, then later on the ATR Trailing Stop-loss was hit.
Note, trailing stop-loss will continue to be plotted until it has been hit regardless of the profit target being hit or not.
Alerts
1. 'Check' alerts to use within indicator settings (trailing stop hit and/or profit target hit).
2. Select 'Create Alert'
3. Set the condition to 'Interactive ATR''
4. Select create.

Average True Range with stop loss and take profit finderBased on the official original average true volatility (ATR), two functions have been extended.
Users can see the suggested stop loss and take profit parameters when entering a long or short order with each K-line.
Part of the settings:
Length: The preset is 14 K lines, which can help you grab the suggested stop loss point.
Long-short single profit-loss ratio: After entering the value of the profit-loss ratio (floating point) you want, it will automatically convert and calculate the past take-profit point.
The five values displayed on the chart are from left to right: ATR, Short Stop Loss, Long Stop Loss, Short Take Profit, and Long Take Profit.
ATR - Average True Range + Dynamic Trend w/ Signals | by Octopu$↕ ATR - Average True Range + Dynamic Trend w/ Signals | by Octopu$
What is ATR?
ATR stands for Average True Range
A Technical Analysis Indicator that measures market volatility by decomposing the range of a Security Price in a specific period.
The ATR can be used as a High Low Spectrum,
As well as a variation of a Moving Average, considering the ranges on a timeframe, generally this being 14 days.
Shorter periods can be used (will generate more signals) or longer periods for steadier trends (for fewer signals)
A ticker on a high volatility has a high ATR.
A ticker on a low volatility has a low ATR.
It is an useful resource for a trading system:
Can be used to enter or exit trades and/or also measure the daily spectrum of a stock.
Does not necessarily points price direction, but takes into account gaps and strong legs.
Can also be used as trading positions confirmation,
Rather be it for stop losses or take profits,
As well as setting trailing stops or limit orders.
This tool offers a great Risk to Reward Ratio, considering the fact you will be aware of the possible moves that an asset can perform.
This indicator should not be used as a standalone tool.
(The combination of factors relies on your own knowledge about Confluence Factors along with your Due Diligence)
This indicator is not an advice to buy or sell securities.
www.tradingview.com
SPY
ANY Ticker. ANY Timeframe.
(Used SPY 5m as Example only)
Features:
• ATR ( Average True Range )
• Range UP and DOWN
• Movement from Price Line
• Dynamic ATR
• Cross/Test Signals
• Live and Last Close
Options:
• Specific Factors Setup
• Length Customization
• Toggle On/Off
• Color PIcker
• Styling Options
Notes:
v1.0
Indicator release.
Changes and updates can come in the future for additional functionalities or per requests. Follow and Stay Tuned!
Did you like it? Please Support and Shoot me a message! I'd appreciate if you dropped by to say thanks! Thank you.
- Octopu$
🐙

Profit Bands [Loxx]Profit Bands is a supplementary indicator to be used with Loxx's backtests and combination indicators that use volatility-based take profits and stop loss. This indicator includes two types of volatility: Average True Range and True Range Double. Additional volatility sources will be added in the future. The lines painted on the screen are multiples of ATR for Take Profits and Stoploss for Long/Short positions that you can change in the settings. 3 Take Profits and 1 Stoploss is supported. You can turn on/off each UI element. Position size is determined by calculating the size of an investment where you'd lose only X% of your balance if the Stoploss is hit. You can enter your total balance available to trade and the desired % risk you'd be willing to lose at SL. Typically this number is 1-2% of total balance per trade.
Always remember to wait for bar close on a signal to and then peg this indicator to 1 bar backward to fix the price levels the then seed the exact levels you'll use for Take Profits and Stoploss. This indicator will match exactly the levels in other indicators in Loxx's scripts such as Kaleidoscope. You would overlay this script over any other script that uses volatility stops to see where to place your TPs and SL

Didi ATR HybridThis is a hybrid indicator that combines the Didi Index with the Average True Range.
It acts as both an ATR and a Confirmation indicator, based on the No-Nonsense Forex (NNFX) trade rules.
The Didi Index takes three moving averages to build a fast line (MA1 and MA2) and a slow line (MA2 and MA3). You can use it several different ways (2 lines cross, zero-cross); in this setup, we only use the slow line with the zero-cross to produce a signal (source code is set up to take advantage of the fast line - you just need to plot it yourself).
ATR is a measure of candle volatility.
The plotted value is equal to the ATR, which then gets colored based on:
Black : Didi Index is below 0 - do not enter trade
Red : Didi Index is above 1, but the previous candle closed >1x ATR - do not enter trade (too volatile)
Green : Didi Index is above 1, and the previous candle closed <1x ATR - a possible trend is confirmed and you may enter the trade (use other indicators too)
The provided chart does not look exciting - as with NNFX, I am posting it with the OANDA:EURUSD , which is one of the harder FX pairs to trade.

Trend #4 - ATR+EMA channelOverview:
This strategy use ATR to take-profit, Red-EMA to stop-loss, Blue-EMA channel to judgment breakout.
This strategy use commission setting is 0.05%, slippage setting is 2 ticks, you can set the appropriate value size in the properties page.
What it does:
This strategy detects when a trend is emerging and buy or sell.
How it does it:
When the price breaks through the blue EMA channel, the trend is judged to be strong in the short term, strategy generates a buy or sell order.
After buying or selling,, if the price moves in the expected direction, uses ATR to determine the appropriate spread to take profit, otherwise use red EMA for stop loss.
How to use it:
Start Date and Stop Date - This parameter adjusts the time range used by the strategy.
Stoploss - This parameter adjusts the stop loss amount after each order is placed.
Blue EMA length - This parameter adjusts the length of the channel.
Blue EMA multy - This parameter adjusts the width of the top and bottom of the channel.
ATR Period - This parameter adjusts the number of candles used by the ATR.
ATR mult - This parameter adjusts the upper and lower widths of the ATR. Lowering this parameter can improve the win rate, but not necessarily the profitability.
Red EMA length - This parameter adjusts the number of candles used by the red EMA .
Long - This switch is used to turn Long position on or off.
Short - This switch is used to turn short position on or off.

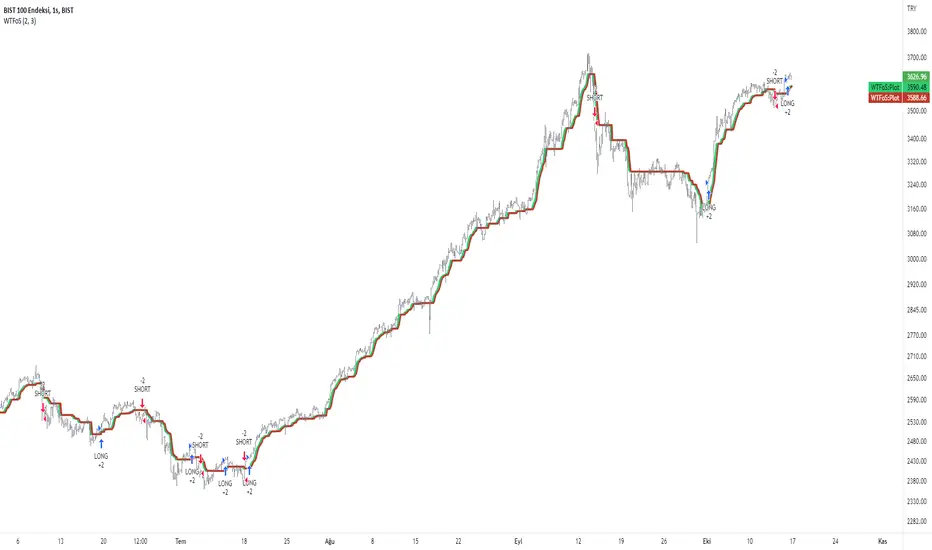
WilliamTrendFollower StrategyThis strategy is based on signals from the WilliamTrendFollower indicator.
You can optimize the parameters of this strategy as you wish. I hope you get the most accurate result.
About WilliamTrendFollower:
With this indicator, we try to catch the trends in price. With continued use of this indicator, we expect it to eventually escape horizontal positions and catch up with continuous trends.
Combined with the WilliamsR indicator and the exponential moving average indicator.
The WilliamsR Fisher Transforms are combined with the ATR indicator to create a line that lags behind the moving average value.
Since it is a tracking indicator, we created a line that is more connected to the price and itself.
In this way, a curve close to the price line is obtained in uptrends and downtrends.
In this indicator, if you choose the parameters correctly, you can easily bypass the horizontal positions. This gives you a safe visualization of support and resistance points as well.
From the settings of these indicators, you can set the multiplier and the exponential moving average period.
It works in all time intervals.
But it was calculated without volume , instead it was created using fisher transforms, moving averages, and the average true range .
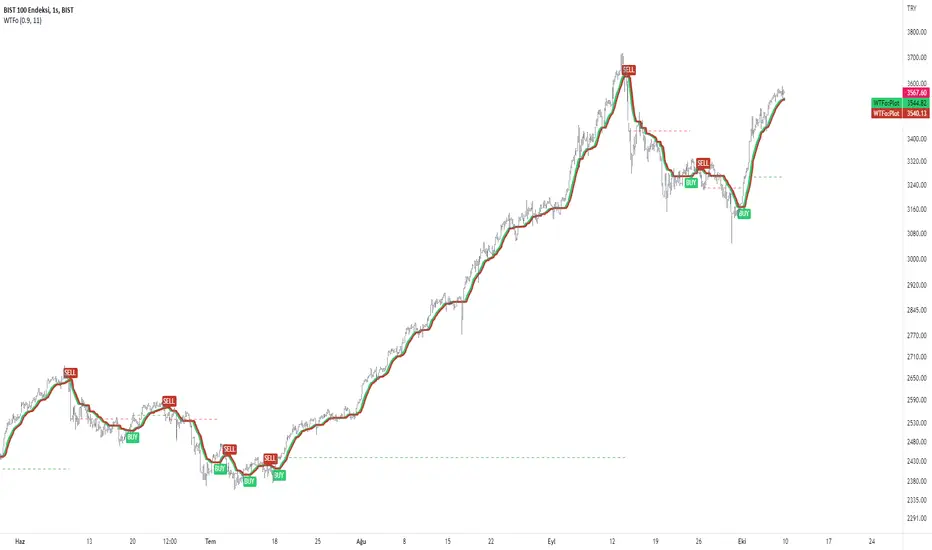
WilliamTrendFollowerWith this indicator, we try to catch the trends in price. With continued use of this indicator, we expect it to eventually escape horizontal positions and catch up with continuous trends.
Combined with the WilliamsR indicator and the exponential moving average indicator.
The WilliamsR Fisher Transforms are combined with the ATR indicator to create a line that lags behind the moving average value.
Since it is a tracking indicator, we created a line that is more connected to the price and itself.
In this way, a curve close to the price line is obtained in uptrends and downtrends.
In this indicator, if you choose the parameters correctly, you can easily bypass the horizontal positions. This gives you a safe visualization of support and resistance points as well.
With this tracker, you can generate Buy and Sell signals and you can see them on the chart.
From the settings of these indicators, you can set the multiplier and the exponential moving average period.
It works in all time intervals.
But it was calculated without volume , instead it was created using fisher transforms, moving averages, and the average true range .
You can set an alarm for Buy and Sell orders.
You can see the processing entry and exit areas in a straight line.
The Fisher Transform indicator is an oscillator that helps identify trend reversals and can be applied to any financial instrument. J.F. Created by Ehlers
Golden SlopeGolden Slope is an ATR based trend tool that mixes KNN machine learning to allow you to confirm your entry and exits, which can give out significantly more accurate signals.
Flag and rectangle signals are machine learning signals, they confirm an entry and exit position. You can use entry and exit signals alone but it's more accurate to confirm with machine learning signals. The idea is to either see a machine learning signal first and confirm it by Golden Slope entry or the other way around.
PS. Watch out if candle starts hitting the golden belly (or the yellow area after an entry signal is given because it can indicate a reversal before machine learning or the golden slope itself catch it, but these events happen rarely.

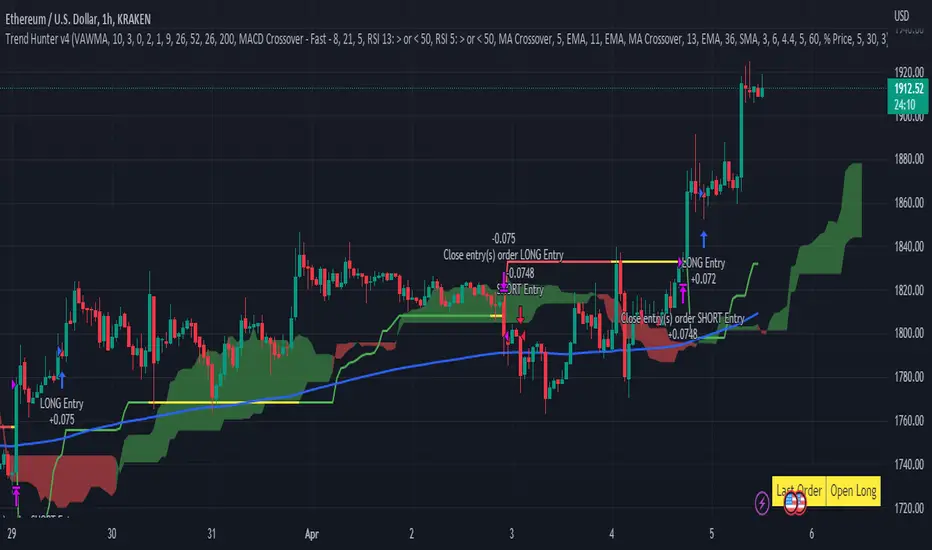
Trend Hunter v4This strategy follows the Trend Hunter training strategy taught at InvestIshare.
Entries are made based predominantly on the price action being above/below the Ichimoku Cloud with the ATR based super trend being used as a trailing stop loss.
Additional trend tracking tools can be toggled on / off to improve the wind rate on some time frames, with additional options available to limit entries if certain conditions are met.
If you would like access to this indicator, send me a DM on the Investishare Discord in the Trend Hunters channel.
The default parameters are set for BTC on the 2 HR time frame
True Average Period Traded RangeTrue Average Period Trading Range (TAPTR)
The J. Welles Wilder Average True Range calculation includes the ability to calculate in gaps into the equation.
It is in my opinion that gaps are untraded range values until the prices on their own come back and close the gaps.
The TAPTR calculation is simple, it is the average for a set period of time of the HIGH - LOW.
The ATR average calculation is automatically set based on the timeframe period you are looking at.
12 Months (1 year) = 10 (1 decade)
Months = 12 (1 year)
Weeks = 12 (1 business quarter)
Days = 21 (1 trading month)
4 Hour = 9 (5 trading days)
1 Hour = 33 (5 trading days)
45 minutes = 9 (1 trading day)
30 minutes = 14 (1 trading day)
15 minutes = 28 (1 trading day)
10 minutes = 42 (1 trading day)
5 minutes = 85 (1 trading day)
1 minute = 420 (1 trading day)
default value = 21 (if using a timeframe not described above)
The "master trend" as being a 21 SMA.
The colored columns represent the actual range value for that time period.
Description of values from left to right.
1) Actual Trade Range Value for the time period you are viewing
2) % of price (in decimal, you need multiply by 100 to get the true percent)
3) Average Traded Range
4) % of price
5) .618 of Average Traded Range
6) % of price
7) Mean of #3 and #5
8) % of price
The % of price is displayed in its calculated form. You need to multiple the value by 100 if you want the actual percent.
Example: Displayed Value: 0.0246 = 2.46%
Why calculated form only? If the ranges are .72 and the % of price is 2.32 the indicator looks all jacked up like a redneck's pick-up.
However, if it is .0232, everything is to scale.
Why is % of price helpful?
If you are trading and are aware that average period traded range is 5%, you now have an idea of an average return if you could catch from low to high (or short high to low).
Bar Colors
RED is greater than 4.2x TAPTR
ORANGE is greater than 2.618x TAPTR but less than RED
YELLOW is greater than 1.618x TAPTR but less than ORANGE
GREEN is greater than .618x TAPTR but less than YELLOW
BLUE is less than GREEN
The colors of the bars represent how far from the Master Trend (21 SMA) the close is.
This is determined by taking the difference between the close and the 21 SMA and dividing by the current TAPTR.
EXAMPLE:
IF you have a RED bar, the close is greater than 4.2 TAPTRs away from the 21 SMA. This means that either prices will stall and remain flat until
the SMA comes to the prices or turn and return to the SMA.
If prices are greater than 4.2 TAPTR, that also represents that it is greater than 4 or more time periods from the mean if the return traded within the averages.

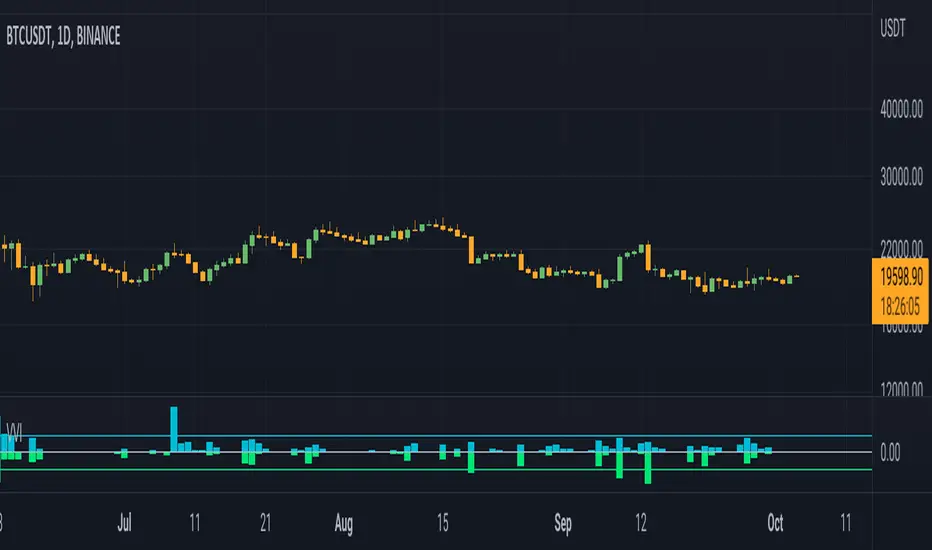
Volume Volatality IndicatorVolume Volatility Indicator
vol: volume; vma: rma of volume
Cyan column shows (vol - vma)/vma, if vol > vma else shows 0
0 value means vol less than vma: good for continuation
0 < value < 1 means vol more than vma: good for trend
value > 1 means vol more than 2 * vma: good for reversal
tr: truerange; atr: averagetruerange
Lime column show -(tr - atr)/atr, if tr > atr else show 0
0 value means tr less than atr: good for continuation
0 > value > -1 means tr more than atr: good for trend
value < -1 means tr more than 2 * atr: good for reversal
Cyan line = 1
Lime line = -1
This indicator shows the volume and truerange together.
Good for filtering trending and consolidating markets.
Thanks for the support.
Trend SuggestionsThis brings together a number of variables to produce trend predictions that could be utilized as decision-making tools.
Uses the aforementioned price and volume derivatives
- A moving average and three weighted moving averages (WMA1, WMA2, WMA3)
- Super Trend Line (ST)
- Opening Range Breakout on Five Minutes, Resistance Bands Pocket pivots, support, and price volume
he Direction is determined by the High and Low Bands of WMAs and the Supertrend Line, which are used to determine the Upper and Lower Lines around the Price. When the price passes below the lower boundary of the band, a downtrend is said to have begun.
Similarly, for an uptrend, this continues until the price passes over the upper edge of the band. Teal for an uptrend and fuchsia for a downturn area shared by the band to identify the trend.
The first five minutes of the breakout lines have a tiny buffer augmentation of 11% applied to them.
Based on what has been observed, support and resistance zones have been somewhat changed from the figures that are often utilized (might work other markets as well)
The markings that may be seen are as follows:
- Blue Triangle indicates a pocket pivot with an upward bias;
- Maroon Triangle indicates a pocket pivot with a downward bias;
- Teal colored Diamonds indicate price upthrusts and potential trend confirmation locations, depending on success or failure.
- Similar backdrop color changes that look as vertical shading are also used to identify them.
- Fuchsia-colored diamonds indicate price declines and a potential trend, depending on whether it persists or fails.
- Dark green and maroon square boxes indicate potential price reversals in the support and resistance bands, respectively.
It goes without saying that this work is derived from numerous other open-source community initiatives.
Feel free to adjust anything you'd like, and we appreciate any feedback.

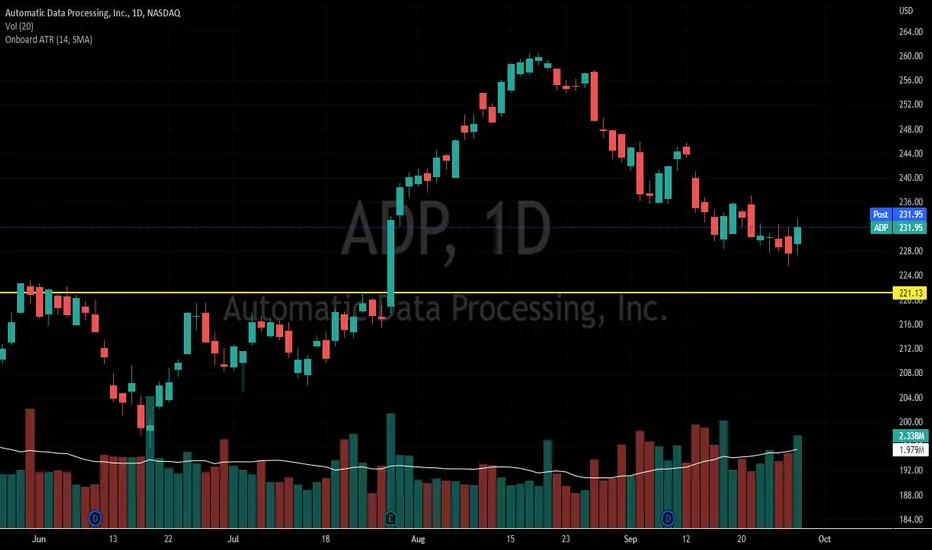
Onboard ATRThis indicator is similar in its operation to the ATR indicator. The change is that it is displayed on the chart and shows the value for the current candle, instead of being displayed as a chart under the price chart.

MACD strategy + Trailstop indicatorWelcome traveler !
Here is my first indicator I made after 3 days of hardlearning pine code (beginner in coding).
I hope it will please you, if you have any suggestion to enhance this indicator, do not hesitate to give me your thoughts in the comments section or by Private message on trading View !
How does it works ?
It's a simple MACD strategy as describe here :
Uses of EMA 200 as a trend confirmer,
For sells :
When above Zero line (MACD) and under EMA200, we go on sell (background color is red)
For buys:
When under Zero line (MACD) and above EMA 200, we go on Buy (back ground color is green)
FILTERS !
I haded one filter to reduce noise on the indicator :
Signals aren't taken if one of the 14 last candles closed on the other side of the EMA 14.
What are the green and red lines ?
The green line is equivalent of a potential stop loss as a buyer side, same for the red one on seller side !
To make the space with the price bigger, please use "ATR multiplier" in the input options of the indicator while on your chart !
Is it timeframe specific ?
Hell no it is not timeframe specific ! You can try to use it on every timeframe !
As usual, I like to remind you that the best way to test an indicator is to go backtest it or to paper trade before using it on real market conditions !
If you find an idea of filter for a specific timeframe, do not hesitate to contact me ! I'll try to do my best to enhance this indicator as the time goes !
Is there repainting ?
There is no repainting on confirmation !
There's only a movement that I don't know how to ignore on the current open candle for the trail stop indicator I built, it should not be a problem if you place alerts to automatise your trading on the close of the candle, and not the high or low !
If you know how to resolve this problem with my code, I would be glad to get your tips to enhance the script ! :)
Example of the indicator in market (backtest, as said, no repaint on confirmation) :

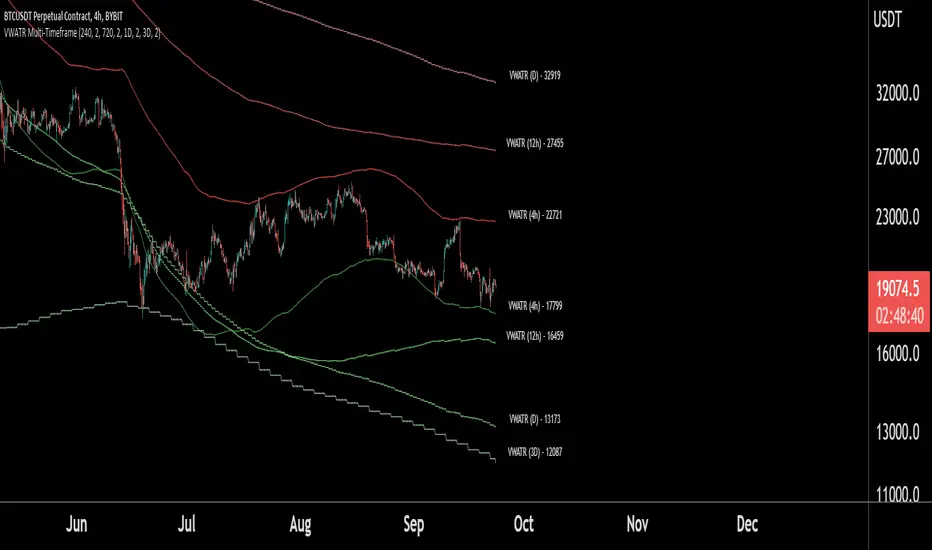
VWATR Multi-Timeframe RibbonThis script combines and averages Volume-Weighted Moving Averages in a specific way to make a unique ATR band that expands and retracts based on the volume in the current market.
This indicator allows for viewing up to 4 VWATR Bands on all the major trading timeframes.
This creates support and resistance levels that are fluid enough for traders to use these 4 methods:
- Identify a range to trade between in sideways markets.
- Identify when we are beginning a move(breaking out of the bands and using them as support to trade from).
- During a trend, traders can use higher timeframe VWATR Bands to identify take profits or potential rejection points.
- Identify when a trend may be over(losing the band as support after a breakout).
NOTE: This script will work fine on identifying crypto assets and stocks, but markets with different volume parameters will negatively affect the accuracy of this script.
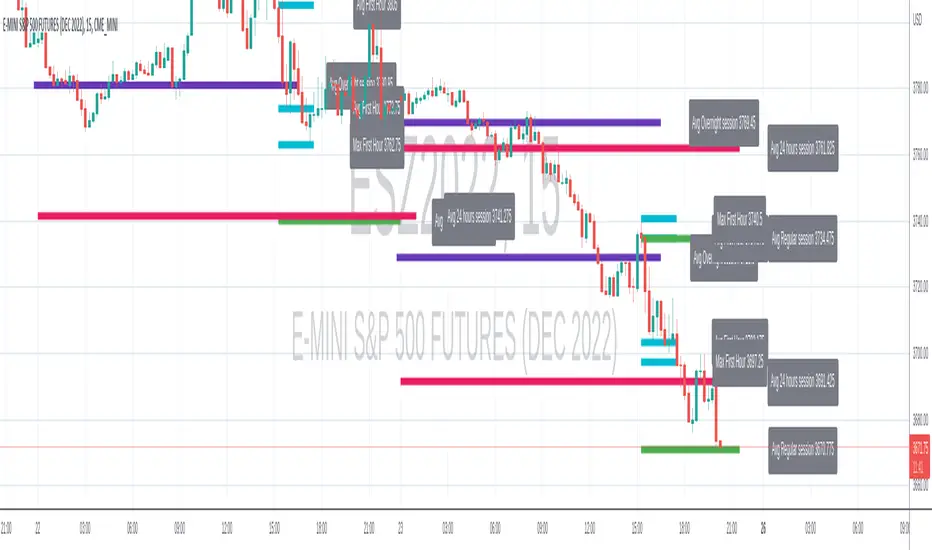
Range-AnalysisMarkets usually tend to stay within a range during a specific time frame (for example first hour of the regular trading session, the whole regular trading session). For traders before initiating a trade it can be helpful to determine the range potential left for the targeted time frame. So they can decide to either try to ride the current trend further or fade the current trend in the case there is no range potential left for the specific time frame. This could be especially helpful for example in the E-Mini S&P future during the first hour.
The script calculates the average range for the last x days of the session defined and plots a line at the expected range extremes based on that average (for example: RangeExtremeHigh would be currentSessionLow+average Range of the last x days.
Any feedback is appreciated.
Supertrend GoldSignalThis indicator is a combination of two atr with numbers 1.6 and 0.8
The signals that are displayed on the chart are the points where both atr signaled at the same time (if distance = 0).
-The atr1 check box is only for displaying atr signals with the number 1.6. You can choose the atr1 number in the slow multiplier section.
-The atr2 check box is only for displaying atr signals with a number of 0.8. You can select the number of atr2 in the fast multiplier section.
-Note: If the atr1 and atr2 checkboxes are off, only simultaneous signals will be displayed on the chart (that is, points where atr1 and atr2 signaled at the same time).
-In the distance section, you can specify the distance between the atr1 and atr2 signals, if it is zero, it means that the atr1 and atr2 signals must be given on the same candle.
For example, if the value of distance is 5, it means that atr1 and atr2 signals can have a distance of 5 candles.
-The filter check box is for filtering signals using boxes 9, 26 and 52 in Ichimoku.
At the points where we have signals, boxes of 9 candles, 26 candles and 52 candles are drawn, and for long signals, the bottom of the boxes must be equal, and for short signals, the top of the boxes must be equal,Signals that do not meet this condition are removed.
