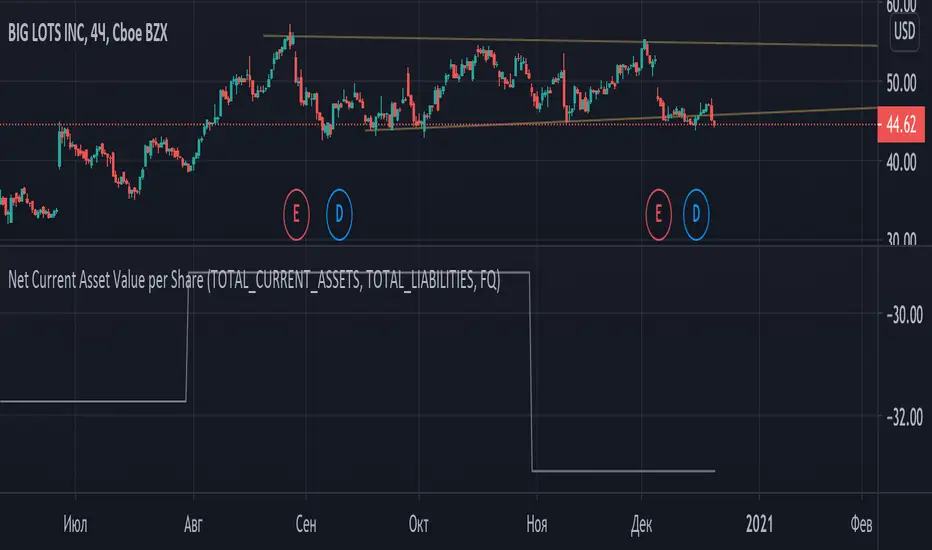
Graham Net Current Asset Value per ShareNet current asset value per share (NCAVPS) is a measure created by Benjamin Graham as one means of gauging the attractiveness of a stock. A key metric for value investors, NCAVPS is calculated by taking a company's current assets and subtracting total liabilities.
NCAVPS = Current Assets - (Total Liabilities + Preferred Stock) ÷ Shares Outstanding.
According to Graham, investors will benefit greatly if they invest in companies where the stock prices are no more than 67% (or 2/3) of their NCAV per share (price <= (2/3)*NCAV).
Coloring pattern:
- price <= (1/3)*ncav -> light green
- (1/3)*ncav < price <= (2/3)*ncav -> green
- (2/3)*ncav < price <= ncav -> dim red
- price > ncav -> red
Analysis
Long RSIThe RSI is a technical indicator generally used with the general setting being 14 days, and often shorter.
The accepted view is that a level of 70 indicates overbought conditions, and 30 indicates oversold conditions.
A short RSI setting will give signals quite often, and they might sometimes contradict each other.
As a individual investor, perhaps with a background in fundamental analysis, the RSI might be overlooked for other fundamental metrics.
But the idea here is that longer RSI settings can be used for investing.
The problem that arises is how to know when the indicator has reached a level that is either overbought or oversold.
This script solves that by using a specific look back period (selectable, but the standard is 1 year), and plotting the highest/lowest value that the RSI has had for that time period.
The idea is that a buy signal occurs when the indicator is at a 'historic' low, and a sell signal occurs when it at its 'historic' high.
Since you generally want to buy when the indicator is at its low, and has stopped decreasing, the script comes with a function that shows you when yesterdays value reached a historic low, but todays value is higher than yesterday.
This is shown by a color change of the background to green. The same is true, but opposite, for sell signals and then the background turns red.
THIS IS NOT TRADING ADVICE, AND YOU SHOULD ALWAYS DO YOUR OWN RESEARCH
GOOD LUCK AND HAPPY TRADING

Fundamental Metric to MarketThis script is supposed to be a quite basic way to find, from a fundamental standpoint, overvalue or undervalued stocks.
The script shows either Book to Market (inverse of P/B), EV /EBITDA, Earnings Yield (inverse of P/E) or Sales to Market (inverse of P/S).
For example, P/B is calculated as Close price / Book Value per share. As a contrarian investor you generally want to buy low P/B stocks and sell high P/B stocks. The problem is when a company has a negative Book Value. This might be the case when a company has written of a large amount of goodwill, which in turn wiped out their Book Value.
Instead you can use Book to Market, which is simply the inverse of P/B. It is calculated as Book Value per share / Close price. When using Book to Market you, generally, want to buy shares with high Book to Market values and sell those with low values. Because of the calculation, companies with negative Book Value will have negative Book to Market values and is therefore easy to identify.
The Fundamental Metric to Market indicator shows a colored background between the highest / lowest point of earlier values and the current value. When the background is mainly green the stock is probably undervalued, and the opposite is true when the background is red.
THIS IS NOT TRADING ADVICE, AND YOU SHOULD ALWAYS DO YOUR OWN RESEARCH
GOOD LUCK AND HAPPY TRADING

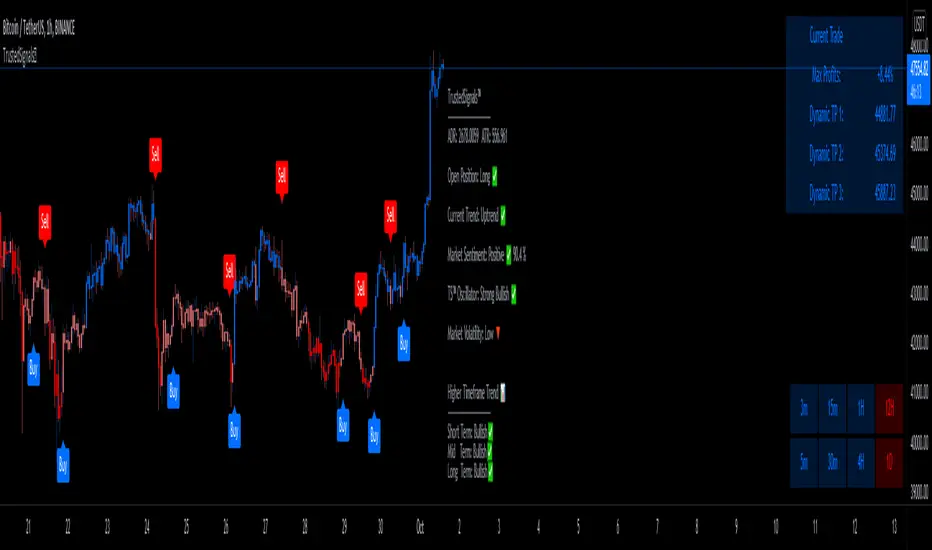
TrustedSignals™TrustedSignals Indicator includes standard Buy and Sell signals on the chart, Support & Resistance lines, Auto-Trendlines, AutoFibs and an All-in-One Market Dashboard.
(All these signals can be set up as Live Alerts directly in Tradingview)
The 2 main Input options for this algorithm are ' Reactivity ' and ' Depth '. By default, the indicator is added to your chart with the best settings we've found so far.
-The ' Reactivity ' controls how quickly the algorithm reacts to trend changes. The higher the reactivity, the fewer trades on the chart. If the Reactivity input is low, the algorithm will react more quickly, and show more frequent trades.
-The ' Depth ' controls the position of the signals relative to the trend swing. A lower Depth will allow for more frequent and earlier entries, while a higher Depth will give slower entries.
Our third (secondary) input is ' Trend Length ' (the Lookback of the ' Current Trend ' indicator). TrustedSignals™ is coloring the candles based on the current trend direction. The blue color shows an uptrend, while the red color shows a downtrend. Buy and Sell signals alerted while the current trend is showing pink (Sideways Market) should be taken carefully, as the market direction is not decided.
Since we believe in the idea of an ' All-in-One ' Indicator, we have included 3 more extremely useful and powerful trading tools.
-The first optional feature is the ' Support and Resistance ' lines. This feature can be activated to draw the key levels of Support and Resistance, easing your decision making and reinforcing the entry signals. Those levels can also be used as Stop Loss or Take Profit
-The second optional feature is the ' Auto-Trendlines '. This part of our amazing indicator automatically draws Trendlines based on the Lookback period the user inputs.
-The last and most important optional feature is the ' AutoFibs '. TrustedSignals™ will automatically draw Fibonacci Retracement levels from trend swing key points. (the lookback length can be adjusted by the user)
- Market Dashboard -
Within one simple panel on your chart, our Dashboard displays the most relevant data from all of our features in real-time.
Current Trend
(The bar color) is an indicator based on Murrey Math's lines. These lines are based on the idea that according to Gann, price moves in 1/8's that act as points of support and resistance. Given this 1/8 characteristic of price action, we assigned properties to each of the lines in a given octave, obtaining a perfect Trend Indicator shown by the candle color, ranging from red to orange to blue.
Market Sentiment
Market Sentiment is a zero lag, 'noise-free', custom improved version of the old 'Relative Strength Indicator ( RSI )' It measures trend velocity and momentum, while it charts the current and historical strength or weakness of the market. It is a much more accurate and vastly superior than the usual RSI.
Trusted Sginals Oscillator
TS Oscillator is our own branded indicator used to measure market momentum and determines whether bullish or bearish trend dominates the market. It measures the market momentum, with the aim to detect potential trend direction. Helping you to identify if the price is high or low in comparison to the recent price behavior.
Outputs: "Strong Bearish ", "Weak Bearish", "Strong Bullish ", "Weak Bullish"
Higher Timeframe Trend is a trend indicator based on our own non-repainting calculation of higher timeframe trend. It is based on a custom method that builds synthetic support and resistance lines from higher time, without repainting, while keeping the output extremely accurate.
Use the link below to obtain access to this indicator
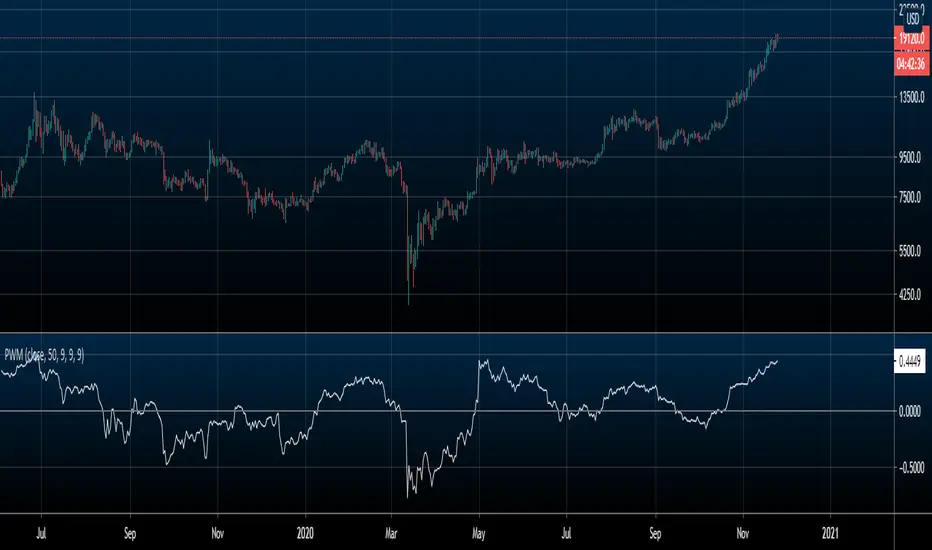
Price Weighted MomentumThis indicator is a momentum indicator that is standardized by price. A.K.A (momentum / price)
The purpose of this indicator is to compare momentum between different assets regardless of price.
EX: Bitcoin will always have more momentum than XLE because it's price is $19000 (as of writing this) compared to XLE's price of $40 (as of writing this). But if you divide the momentum by price, you get a standardized value to better compare the 2.
This indicator can be used to compare everything on TradingView.
HOW TO USE/INTERPRET
Positive values denote an uptrend
Negative values denote a downtrend
A value of 0 (or very very close to 0) denotes sideways price action
WHAT'S INCLUDED
Price Weighted Momentum (Unsmoothed by default)
Optional smoothing with either a simple or exponential moving average
Side note: I only added functionality of smoothing for EMA and SMA for my personal uses, but if you want a version of this with another way of smoothing (e.g. HMA, SSMA, etc.) that you would like, the cost of me adding that for you is a follow on Twitter. Just DM me there :)
BUY/SELL_Strategy_Paydar_V.07BUY/SELL_Strategy_Paydar_V.07
Hello dear friends
This system can be considered as a signal system.
*** This system just Suggests you for points. ***
My suggestion is not to use this system alone and conclude about entry and exit points according to charts, news, market fluctuations and trend direction.
The agenda of this system is as follows:
- Buy signal means:
Time to enter the trade / buy / take a long position and ...
- Sell signal means:
Time to leave the trade / sell / exit the long position
* I suggest you use this system in trading for cryptocurrency and especially for bitcoin.
* My suggested time frame is 1 minute, because during this time and according to the settings of this system, a better result was obtained for me.
* I suggest using this system first in spot trading and then in future trading.
System function:
This system is based on the analysis of 74 different systems, which are:
> 19 indicators and oscillators separately which include:
MACD, RSI, STOCHASTIC, STOCHASTIC RSI, BOLLINGER BANDs, PARABOLIC SAR, VOLATILITY and ...
(All of which can be used on the Trading View site as a public domain and open source)
> 11 cases of previous oscillators and indicators in combination
(All of which can be used in public view and open source on the Trading View site)
> 27 items MA, EMA, VMA, WM, MSM, etc. in combination and separately
> 9 lines and areas of automatic support and resistance
(All of which can be used in public view and open source on the Trading View site)
> 8 different strategies, all of which can be used in public view and open source on the Trading View site
Points.
*** All indicators, oscillators, lines and areas of automatic support and resistance, strategies, etc. can be used as a public domain and open source on the Trading View site. ***
Comment on using this system as well as how to use it.
_______________________________________________________________________________
* In this system, the main and basic indicators and oscillators are used, all of which are in the public view and open source site in Trading View *
I am very grateful and very loyal to Trading View, which built all the indicators, oscillators and strategies, because I used them to build this strategy system.
_______________________________________________________________________________
Be successful and profitable.

Graham NumberGraham Number is named after the “father of value investing,” Benjamin Graham, who was a mentor of Warren Buffett. The figure takes into account earnings per share and book value per share to measure a stock's maximum fair market value. In other words, it is the upper end of the price range that a defensive investor should pay for the stock.
The Graham Number = Square Root of (22.5) x (tmm EPS) x (mrq Book Value per Share).
The 22.5 is included in the formula as a rule of thumb to account for Graham's assumption that the price-to-earnings ratio should not be over 15 and the price to book ratio should not be over 1.5 for an undervalued stock. So, the number is generated as (P/E of 15) x (P/B of 1.5) = 22.5.
So the script generates a Graham number plot.

[Max] Power lag analysis An indicator that is a parametric lag power filter.
I'm starting Time Series Analysis by Hamilton James Douglas, to try to find some fun ideas to test and upgrade my skills on that subject and share them when it produce something that can be useful.
The idea behind that indicator, it's to only get the shape of the biggest movement in percent.
To solve that problem, I iterate about the rate of change of about 15 intervals and I apply a bigger power to the intervals that get bigger.
Why ? If the price is ranging, the indicator will show only the spics, but if the price breakout of the range, each new close that are longer from the price will have a better impact on the indicator and the last ones will be neglected.
I've try to use some parametric lag indicators on top of that indicator but he result is not good enough for me, it can't be used for trade directly but it can be an approach.
If you have upgrade ideas or recommendations on that indicator, I will be please to hear them.
Have fun with the script.
Have a great day !
Max

L1 Bitcoin Whale Pump DetectorLevel: 1
Background
One of the biggest differences between cryptocurrency and traditional financial markets is that cryptocurrency is based on blockchain technology. Individual investors can discover the direction of the flow of large funds through on-chain transfers. These large funds are often referred to as Whale. Whale can have a significant impact on the price movements of cryptocurrencies, especially Bitcoin. Therefore, how to monitor Whale trends is of great significance both in terms of fundamentals and technical aspects.
Function
L1 Bitcoin Whale Pump Detector script This is a simple technical indicator that judges whether Whale is involved in the relationship between price increase and trading volume. Its purpose is not to accurately judge Whale behavior, but to provide a starting point for more Pine lovers to develop more advanced Whale monitoring programs.
Key Signal
pumpcond1 use price information alone with 7% as a threshold
pumpcond2 use both price and volume infomation.
Pros and Cons
Pros:
1. Detect Whale pump in large time frame.
2. Not a mature and accurate buy and sell script but provide alerts of Whale movements.
3. When it resonante with Buy signal, it has higher confidence level.
Cons:
1. Only detect Whale Pump, not Whale Dump is realized.
2. Only provide large fund information, not an accurate trading signal generator.
Remarks
You can use this to confirm blockchain large fund transfer activities. E.g. Large amount of USDT flows into large exchanges.
Readme
In real life, I am a prolific inventor. I have successfully applied for more than 60 international and regional patents in the past 12 years. But in the past two years or so, I have tried to transfer my creativity to the development of trading strategies. Tradingview is the ideal platform for me. I am selecting and contributing some of the hundreds of scripts to publish in Tradingview community. Welcome everyone to interact with me to discuss these interesting pine scripts.
The scripts posted are categorized into 5 levels according to my efforts or manhours put into these works.
Level 1 : interesting script snippets or distinctive improvement from classic indicators or strategy. Level 1 scripts can usually appear in more complex indicators as a function module or element.
Level 2 : composite indicator/strategy. By selecting or combining several independent or dependent functions or sub indicators in proper way, the composite script exhibits a resonance phenomenon which can filter out noise or fake trading signal to enhance trading confidence level.
Level 3 : comprehensive indicator/strategy. They are simple trading systems based on my strategies. They are commonly containing several or all of entry signal, close signal, stop loss, take profit, re-entry, risk management, and position sizing techniques. Even some interesting fundamental and mass psychological aspects are incorporated.
Level 4 : script snippets or functions that do not disclose source code. Interesting element that can reveal market laws and work as raw material for indicators and strategies. If you find Level 1~2 scripts are helpful, Level 4 is a private version that took me far more efforts to develop.
Level 5 : indicator/strategy that do not disclose source code. private version of Level 3 script with my accumulated script processing skills or a large number of custom functions. I had a private function library built in past two years. Level 5 scripts use many of them to achieve private trading strategy.

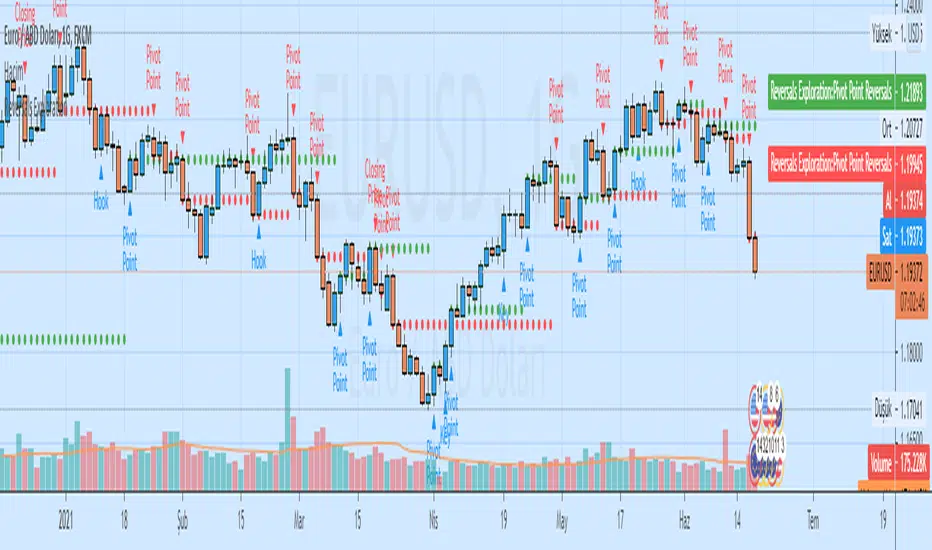
Auto Analysis Short-term Reversals ExplorationAuto Analysis Short-term Reversals Exploration
Based on a study by Larry Lovrencic
Closing Price Reversals Automatic Analysis
Hook Reversals Automatic Analysis
Island Reversals Automatic Analysis
Key Reversals Automatic Analysis
Open/Close Reversals Automatic Analysis
Pivot Point Reversals Automatic Analysis
Efficient Support & Resistance LevelsThis script is a mixture of my two previous scripts "True Strong Classical Support/Resistance Levels" and "Hidden Supports & Resistances + Round Levels". This combination brings on better identification of the most efficient support/resistance levels.
Note that "Hidden SnR Levels" part of the code is only expected to work on Forex charts, but apart from that, the other parts could be applied to any chart.
The script may:
- Draw classical support/resistance levels which retraced the price previously, aided by multi-timeframe analysis
- Draw hidden support/resistance levels based on psychological patterns of the price
- Adjust to wicks better than Pine Script built-in pivot functions
- Differ the levels color based on chart reactions
- Merge nearby classical levels to avoid congestion on the chart
Feel free to use it and send me your thoughts.

TeoTrading 37 - V1 - Ratios AFThis indicator prints fundamental data:
P/E Ratio.
Debt To Ebitda.
EPS (Earnings Per Share).
The fisrt column is the data of the Ticker opened in the graphic. In the configuration parameters you can enter the other three Stocks to compare.
The data is provided by FactSet across Tradingview.
This is the first version of the indicator, I am testing it. You can tell me if you find any bug. Thnaks!

Colored VolumeThe height represents total volume, the ratio of red to green represents the bullish/bearish volume. AKA buyers or sellers.

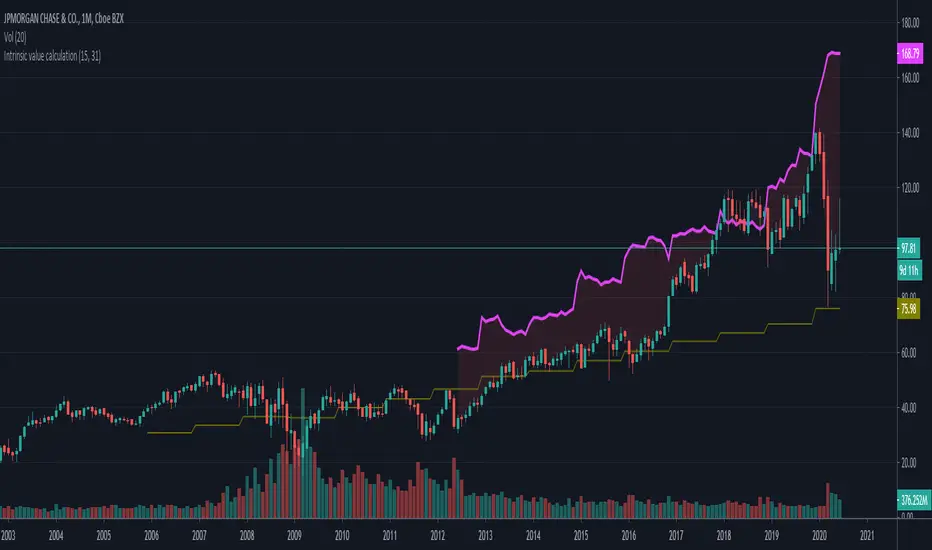
Intrinsic value calculation Intrinsic value calculator based on Warren Buffet's and Ben Graham's work
In value investing determing the true value of a COMPANY instead of a stock price is crucial.
This little indicator shows the "Intrinsic value" of the choosen stock meaning the value of the stock in 10 years time. Calculation is based on historical book value's average annual growth rate and dividends paid.
Since this is about long therm investing, use monthly charts.
"Intrinsic value can be defined simply: It is the discounted value of the cash that can be taken out of a business during its remaining life.”
– Warren Buffett
One way to calculate that is by the growth in per share book value and dividends taken in the forseeable future (10 years) than discount it with the prevailing 10 year note's rate.
In the inputs you have to set 2 variables:
1. How many years back you have the first data for book value per share available?
2. What was the per share book value that year?
(Bookvalue is ploted in olive colour and you can get the oldest one if you move your cursor over the latest data on the left)
CAUTION! You have to reenter it for every stock you analyse as this is stock-specific data!
After setting the input data, you will see the "Intrinsic Value"'s pink curve ploted over the price chart.
If the price is well below the pink line, the company is undervalued and can be a possible applicant for long therm investment.
Margin of safety: when the current price is 50% below the intrinsic value that means a 10% yearly growth potential (100% growth in 10 years) or a 100% margin of safety.
I am a beginer in Pine so please excuse my coding...
If anybody knows hot to extract historical data from 15 years ago, please share it with me, so I can automate the whole calculation without inputs necessary.
Tradespot Trade PanelCryptocurrency based TA panel.
Features
- In depth trend analysis
- Momentum analysis
- Alt coin risk management
- Technical sentiment at a glance
- Much more coming as we iterate and update this panel over time

Funamental and financialsEarnings and Quarterly reporting and fundamental data at a glance.
A study of the financial data available by the "financial" functions in pinescript/tradingview
As far as I know, this script is unique. I found very few public examples of scripts using the fundamental data. and none that attempt to make the data available in a useful form
as an indicator / chart data. The only fitting category when publishing would be "trend analysis" We are going to look at the trend of the quarterly reports.
The intent is to create an indicator that instantly show the financial health of a company, and the trends in debt, cash and earnings
Normal settings displays all information on a per share basis, and should be viewed on a Daily chart
Percentage of market valuation can be used to compare fundamentals to current share price.
And actual to show the full numbers for verification with quarterly reporting and debuggging (actual is divided by 1.000.000 to keep numbers readable)
Credits to research study by Alex Orekhov (everget) for the Symbol Info Helper script
without it this would still be an unpublished mess, the use of textboxes allow me to remove many squiggly plot lines of fundamental data
Known problems and annoyances
1. Takes a long time to load. probably the amount of financial calls is the culprit. AFAIK not something i can to anything about in the script.
2. Textboxes crowd each other. dirty fix with hardcoded offsets. perhaps a few label offset options in the settings would do?
3. Only a faint idea of how to put text boxes on every quarter. Need time... (pun intended)
Have fun, and if you make significant improvements on this, please publish, or atleast leave a comment or message so I can consider adding it to this script.
© sjakk 2020-june-08

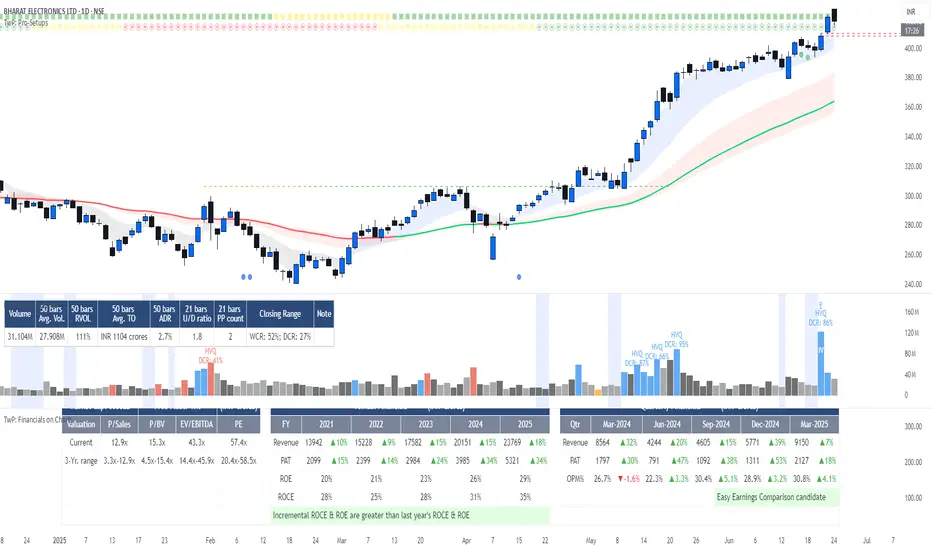
TwP: Financials on ChartsWith this indicator, you can see the following on a chart:
> An Info Panel , with the financial snapshot of the company, such as its market capitalization, annual & quarterly financials, Y/Y growth numbers, profitability margins, RoE & RoCE, and valuation ratios.
> EBITDA and PAT margins over a period of time.
> RoE and RoCE ratios over a period of time.
> Valuation multiples over a period of time.
> A comparison of margins, return ratios, and valuation multiples with any peer-group company .
Info Panel
This gives a quick snapshot of the financials of the company, which includes annual & quarterly Revenue, EBITDA, PAT, margins with Y/Y changes, Debt-Equity ratio, ROE, ROCE, and valuation multiples.
Profitability & Return Ratios
You can view quarterly as well as annual EBITDA & PAT margins and annual RoE, RoCE. You can choose to see these ratios either only for the company or can also add a peer company to compare.
Valuation Ratios
You can view TTM valuation ratios such as EV/Sales, EV/EBITDA, P/BV & P/E multiples. You can choose to see these valuation multiples either only for the company or can also add a peer company to compare.
Tradespot Quant Tradespot - Quant is an extensive trading algorithm, signal generator and technicals screener packed into one beautifully designed, functional indicator. The script is very customisable to not limit the trader using it but does have some very respectable settings for BTCUSD & ETHUSD on the 4H and 45M charts that we run in an automated fashion here a tradespot round the clock on Binance Futures.
What does Tradespot Quant do?
Trade following signals generated via our bespoke algorithm
Full customisation to allow a deeper use of the indicator across different assets
Beautifully illustrated 'Take Profit' and 'Stop Loss' levels that are configurable to easily see how successful the model can run
Presets for BTCUSD & ETHUSD on the 4H/45M timeframes avaliable instantly for your use.
Innovative trade panel that illustrates key information such as what trade the algorithm is looking for next? is altcoin trading deemed safe or risky right now? How are the technicals looking regarding the overal market trend?
More features being added all the time, we have great ideas and our only limitation is how fast we can program it!
Do you do a free trial?
Yes! Get in touch for a complimentary 48 hour free trial to the indicator, no strings attached.
Who are you?
Tradespot has been creating scripts for years on TradingView that we use to leverage our social trading and signal group offerings. We currently have over $200K in assets trading with our strategies across over 300 users.
You can learn more about us on our website. Please reach out to me or see the link on our profile.

TS - Trend Moving AveragesOverview
Simple trend indentification indicator based on a mix of SMA & WMA components.
Default settings built for the 1D chart with an optional 3rd fast MA that can be toggled.
Can be used alongside more advanced Tradespot indicators
Access
PM me, our indicators come as a wider package.

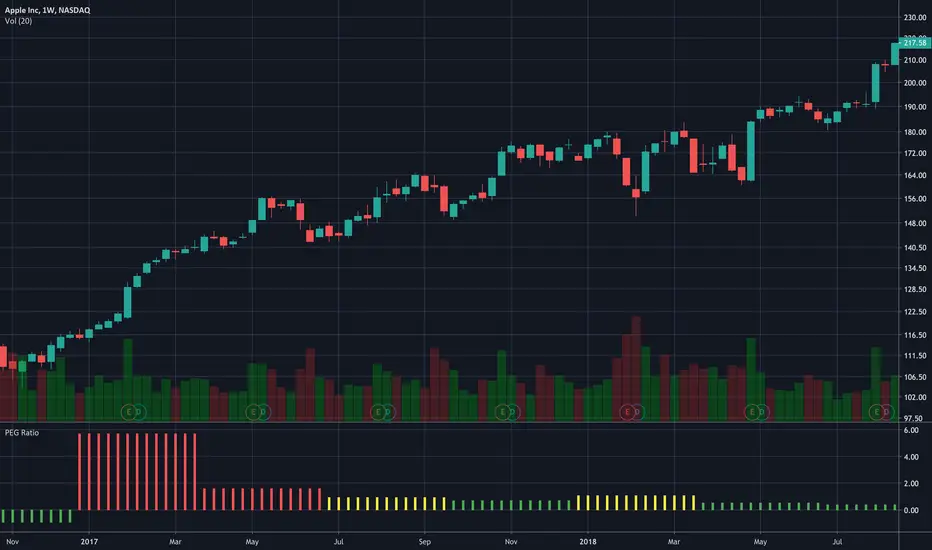
PEG RatioHello everyone,
Quick script to check the PEG Ratio.
What is PEG Ratio?
The price/earnings to growth ratio (PEG Ratio) is a stock's price-to-earnings (P/E) ratio divided by the growth rate of its earnings for a specified time period. The PEG ratio is used to determine a stock's value while also factoring in the company's expected earnings growth, and is thought to provide a more complete picture than the more standard P/E ratio.
A PEG Ratio greater than 1.0 means that the stock is overvalued, while below 1.0 means is is undervalued. When the PEG Ratio is exactly 1.0, then the stock is trading at fair valuation.
Formula:
PEG Ratio = (Price / EPS) / EPS Growth
Examples:
Company A:
Price per share = $46
EPS this year = $2.09
EPS last year = $1.74
Company B
Price per share = $80
EPS this year = $2.67
EPS last year = $1.78
Company A
P/E ratio = $46 / $2.09 = 22
Earnings growth rate = ($2.09 / $1.74) - 1 = 20%
PEG ratio = 22 / 20 = 1.1
Company B
P/E ratio = $80 / $2.67 = 30
Earnings growth rate = ($2.67 / $1.78) - 1 = 50%
PEG ratio = 30 / 50 = 0.6
The company A is overvalued whiled the B is undervalued.
In this script an overvalued stock is considered when the PEG Ratio is above 1.1, while it is 0.9 for an undervalued stock.
Only works with Stocks.
Happy trading,
Range StrengthRange Strength is a super simple indicator designed for the mean reversion (range trading) strategy, it shows you how strong the market is ranging or trending. When the indicator is positive (green color) the market is a range mode, when the indicator is negative (red color) it is in a trending mode.
It's best used together with our Buy Sell Bands indicator to identify entry and exit signals within the range, ideally only taking trades when the Range Strength indicator is showing positive (green) readings.
How Is It Different From Other Indicators?
- Designed specifically for the mean reversion (range trading) strategy
- Shows one simple reading and graphical representation of range strength
- Identify the best times to take mean reversion trades versus trend trades
- Works well in conjunction with the Buy Sell Bands indicator to validate entry & exit signals
- Can be applied to all markets and timeframes
How To Use The Indicator?
1) Visit our website URL shown below this description and signup
2) We will then grant your TradingView username permission to use our indicators
3) Go to your Indicators window, then the Invite-Only section and add our indicators to your chart
4) Our indicators will then show on every chart you now look at
5) You can set up alerts to be notified in real time of trading signals from our indicators
6) Read our user manual for all the best tips on how to use our indicators as part of a range trading strategy
7) Feel free to reach out to us for personal one-on-one help with getting setup
What Markets and Conditions Does It Work Best On?
All markets cycle between trending and ranging modes, and the key to successfully using our indicators is identifying when the market is in or about to go into a range trading mode, and as such it can be applied to all markets and timeframes.
Some markets and timeframes trade within ranges more predictably than others, for example Forex, Cryptocurrencies, and Futures on the 15 minute timeframe during the US night session can work well due to the lack of price sensitive news creating lasting trends. With Stocks & ETFs on the 5 minute timeframe during the midday session on large cap blue chip stocks with no recent news releases can show strong range trading environments to use our indicators in.
In addition to single markets, you can also use our indicators on pair charts, for example Coca Cola(KO) versus Pepsi(PEP), you can do this by entering KO/PEP inside your TradingView chart quote box and it will bring up a pair chart. Our indicators will show buy and sell signals right on the pair chart just like any other single instrument chart. You can get very creative with what type of pairs you can come up with.
Our indicators are primarily designed for day trading and swing trading, however they can also be used for position trading and investing by identifying technically oversold and overbought range levels that are based on current and past volatility around a dynamic average price, for this we recommend using a weekly chart to identify longer trading opportunities.
As always indicators should be used as part of a trading strategy to assist in making decisions, you can't just blindly follow every signal they produce, you should always seek to compliment technical trading signals with additional analysis to reduce your risk and increase your odds of making a winning trade.
Examples Of Use On Various Markets and Timeframes
GBP vs CHF Forex Pair 15 Minute Chart
Tesla Stock 1 Minute Chart
Bitcoin vs USD Crypto Pair 15 Minute Chart
Micro E-Mini SP500 Futures 1 Minute Chart
Mastercard vs Visa Stock Daily Pair Chart
To gain access to the Range Strength and Buy Sell Bands Indicators visit our website shown below.
Happy Range Trading :)

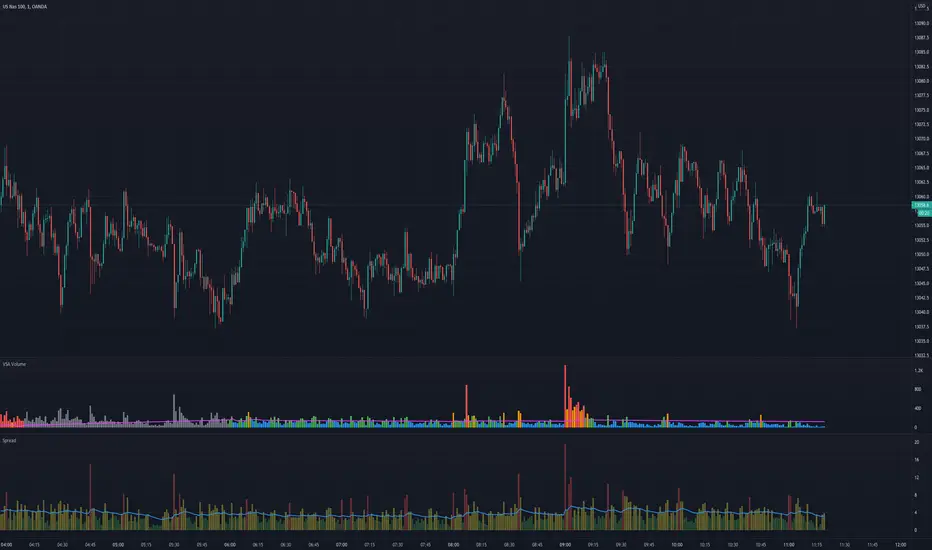
VSA VolumeVolume indicator judging level of volume per bar accordingly to Volume Spread Analysis rules. It allows either to set static volume levels or dynamic ones based on ratio comparable to Moving Average. Bars are coloured based on ratio or static levels, visually presenting level of Volume (low, average, high, ultra high).

VSA SpreadMeasures spread of the candle, useful especially for Volume Spread Analysis (VSA) and to measure trend strength. Spread is coloured based on level comparable to Moving Average.