Weekdays HeatmapA utility tool for getting interesting weekdays statistics.
Features
26 sources (standard prices, volumes, ranges)
Readable and optimized code
How to interpret
The darker the color, the stronger the weekday dominance
Supported sources/metrics
open
high
low
close
oo2 , (open + previous open) / 2
oh2 , (open + high) / 2
ol2 , (open + low) / 2
oc2 , (open + close) / 2
hh2 , (high + previous high) / 2
hl2 , median price
hc2 , (high + close) / 2
ll2 , (low + previous low) / 2
lc2 , (low + close) / 2
cc2 , (close + previous close) / 2
hlc3 , typical price
ohlc4
weighted close , (2 * close + high + low) / 4
true range
double true range , by Cynthia Kase
open/close range
high/low range
volume
tick volume
net volume
on balance volume
acc/dist , accumulation/distribution line
price volume trend
trade value , volume * close * pipvalue
How to get access
PM me for more details
Chart Mingguan

Weekly VWAP BandsOriginal Author: SandroTurriate
Weekly VWAP
Weekly VWAP close
Weekly stdv bands
Daily Vwap
band cross alerts

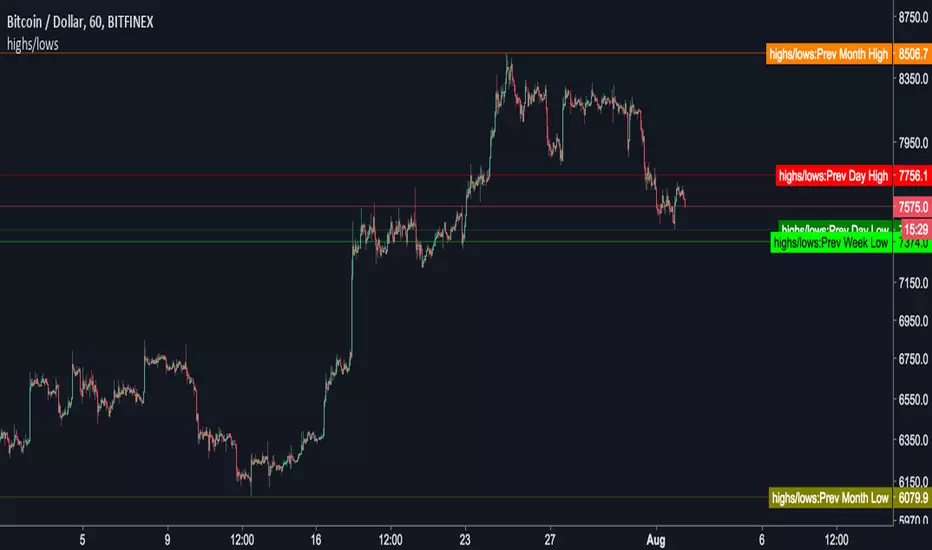
Instabots previous highs and lowsAdds previous daily, weekly and monthly highs and lows to the chart.
By default it just adds the price line to the chart. Change the default option to plot the highs and lows onto the chart, like below...

wPiv21This is a customised indicator highlighting key levels of support and resistance on the weekly time frame.

wPiv11This is a customised indicator highlighting key levels of support and resistance on the weekly time frame.
wPiv4This is a customised indicator highlighting key levels of support and resistance on the weekly time frame.
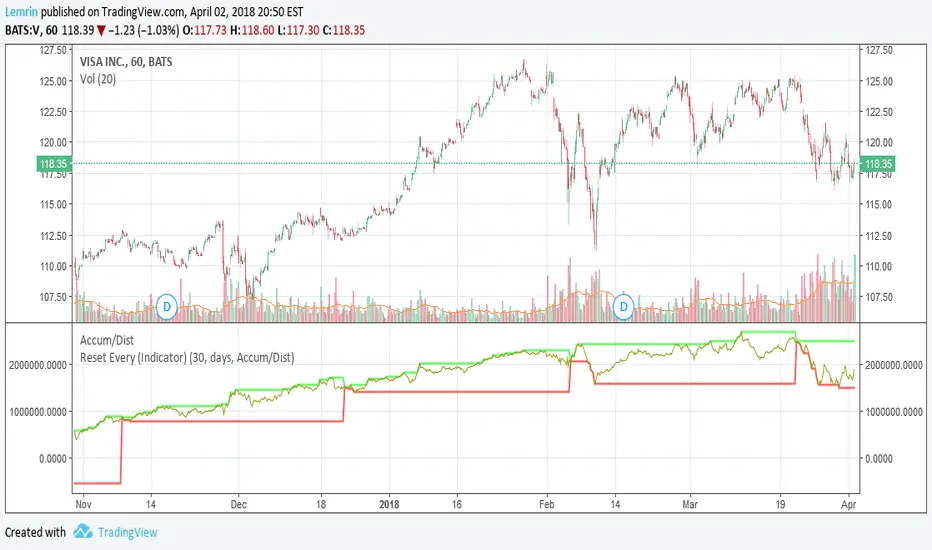
Reset Every (Indicator)Nearly identical to the price version , this configurable indicator retains the max and min value of a chart for the time duration you specify. The difference with this one is that it can be applied to any other indicator, not just price.
Applied to volume:
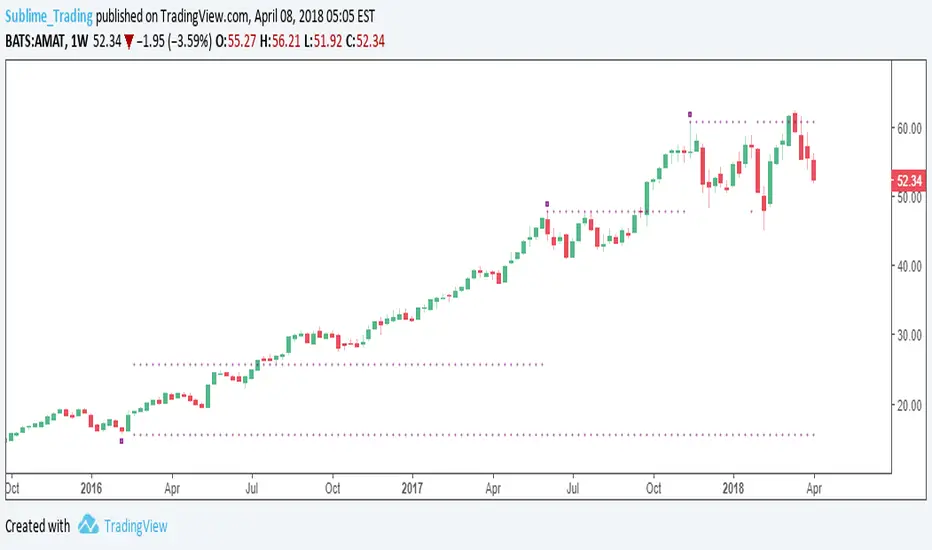
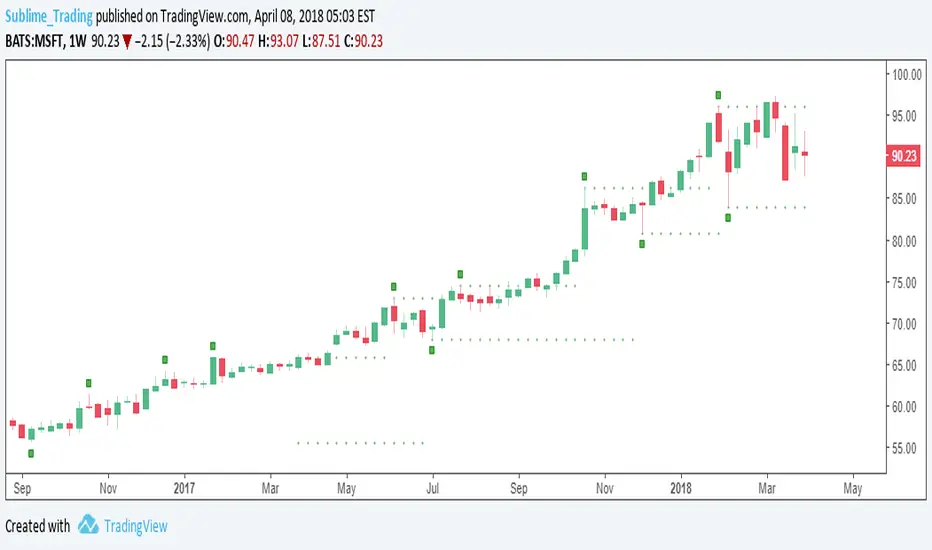
Reset Every (Price)Someone requested a high/low price indicator that would reset the "remembered" prices daily. I started out doing just that, and then decided to make it much more configurable.
Choose the units (minutes, hours, days, weeks, months) and the number of those units, and this will reset the highest/lowest value remembered to the current values on your chosen time interval.
This should work with any time interval you desire, within reason...asking for resets every 4000 hours on a monthly chart will probably not work.
GE, monthly, every 7 months:
Ford, weekly, every 18 months:
Dow Jones Industrial Average, weekly, every 90 days:
LTCBTC, daily, every 10 days:
ETHUSD, 30 minutes, every 10 days:
BTCUSD, 1 minute, every 10 hours:
EURUSD, 1 minute, every 50 minutes:
Also, I am about to publish another version of this with just one source input that can be applied to any indicator...stay tuned!

Close of relevant previous periodThis indicator puts the previous close value of a higher relevant time frame on the chart, it adepts to the period of the chart. Relevant means that it puts:
Close of previous year in monthly chart
Close of previous month in weekly chart
Close of either previous month of week in daily chart, default setting is week
Close of previous week in 4hourly and 3hourly charts
Close of previous day in 30minute and higher intraday charts
Not bother the user below 30 minutes.

Weekly closeIt turned out not to be that easy to plot the close of the previous week in hourly or daily charts. In my first experiments things went wrong on Friday or intraday if you simply use the security function. So here is the thing with an algorithm that guaranties the correct value.

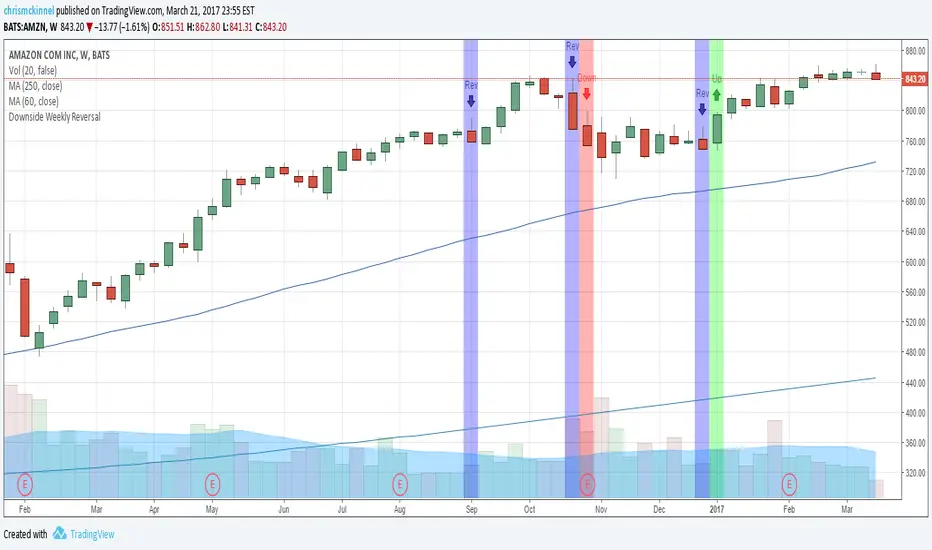
Downside Weekly ReversalBased on Thomas Bulkowski's top ranking small pattern: the Downside Weekly Reversal pattern.
Add this indicator to your weekly charts.
Blue bars represent weekly reversals and green bars following blue bars indicate an upside breakout. These are to be traded in a Bull market.
Red bars following blue bars indicate a downside breakout. These are to be traded in a Bear market.
More details: thepatternsite.com
Gleeson Trend Tracker (GTT) IndicatorComprehensive Trend Trading System Indicator made up of the four components to help you successfully trade market trends:
Entry Signals (Green & Red Arrows)
The entry arrows indicate entry conditions are present. Green for long entries and red for short entries. If you already in position in the direction of an entry signal, ignore it. Switch to position maintenance mode for that market once trading a market.
Current Trend Status Channels (Red/Green Overlay)
The channel overlay is intended to indicate whether the market has recently trended up/down. Green if moving higher, Red if moving Lower. Channels make it easier to visualise current & previous price trajectory.
On Close Stop Loss (OCSL) / Price Average (40 MA) Blue line
This acts both as the "line in the sand" in relation to trend direction but also importantly as your (OCSL) or sometimes also known as mental stop. If price closes beyond this line in the opposite direction to your position, exit the position. It's important to wait for price to close (this methodology works best on weekly charts so make entry & exit decisions when the market is closed). This method works best if you risk 1% per trade using the distance from entry price to the OCSL as your pre-defined risk, back-analysis confirms this.
Hard Stop Loss Red line
This line is your circuit breaker intended to protect your capital from sudden adverse moves. This line serves as the price for your fixed or hard stop loss point that should be entered with the order. The formula behind this line is risk * 2 (so 2% if you risk 1% between entry price and OCSL). HSL is your safety net, always use it.
Some other advice on how to trade this methodology:
Analysis Sunday, entries & exits Monday (so you can also have a life)
Do not pyramid with this system, it works best with individual entries spread across a range of markets including FX, Indices, Commodities and Interest Rates.
Risk only 1% per trade
This methodology works best over weekly/monthly charts. You want to capture moves that last weeks/months/years. I would not advise day trading this system.
If you have any feedback or need further help, email me at me@jackgleeson.co.uk
Good Luck!

B3 Weeklies - Pivot S/RBy request, some more of the levels that I like to see. I find that this works well on gold and crude oil the best. Stocks and ETF's sometimes have weird bars in after hours, and this sometimes destroys the week's levels. Any non liquid jump and back bars will likely not be tolerated by the study and ruin its data. The indexes sometimes work, but I find that the other pivot study I released is better for index futures. Forex hasn't been tested on this particular pivot study as of yet. Feel free to comment with your experiences using this with currencies.
This one is designed to show you your current week's action versus last week's action. Fibonacci levels are drawn from the range created by the week before, then offset from pivot HLC/3. These do not reprint so you can trust them to remain the same straight away from Sunday night into Friday's close. On other platforms I can get the next week in future to print as well, showing you where the next week trade levels on Friday before. Maybe I can figure out how to make pinescript print in the right extension, haven't got there yet.
Pretty good selection in 12 days of being a member though, so I am psyched how well this is going in TradingView, learnin' more language all the time. Feel free to leave some feedback, and happy to answer any questions. ~B3

Single Timeframe EMAThis plots EMAs from higher timeframes on intraday charts. Very useful for finding areas of S/R

High and LowsSimple script used to show the previous day/week/month high and low as an overlay on the chart
MAGNUS® CyclesThis indicator will help you if you struggle making any profit in bitcoin.
It generates very few signals with very nice profit potential ( around 100% this year ! ).
Perfect tool for longterm swing traders and new traders that need help figuring out the midterm trend.
Use it with these parameters only:
weekly: 13, 5, 12
daily: 92, 21, 96
