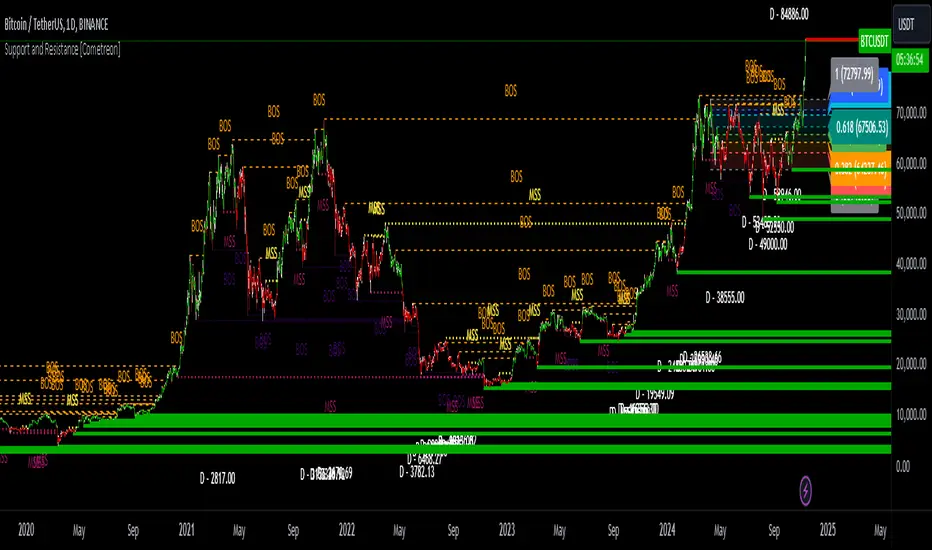
Support and Resistance MTF [Cometreon]The Support and Resistance MTF elevates your technical analysis by automatically identifying and plotting critical support and resistance levels across any symbol and timeframe—even higher ones. Powered by advanced algorithms, this tool continuously analyzes market structure and updates in real time, saving you hours of manual analysis.
If you're looking for a smart, dynamic, and highly customizable S&R solution, this is the tool for you.
🔷 Key Features & Improvements
🟩 Automatic Level Detection
The indicator automatically plots all support and resistance levels, providing a clear map of key points on the chart.
🟩 Historical Level Display
Shows historical support and resistance levels, providing a comprehensive view of the market over time.
🟩 Dynamic Trend Creation
Automatically identifies and updates trends based on levels, simplifying the understanding of market directions.
🟩 Automatic Fibonacci
Generates Fibonacci levels based on the last two support and resistance levels, offering additional reference points for potential price retracements or extensions.
🟩 Customizable Alerts
Offers a series of configurable alerts to keep you informed about breakouts, new confirmed levels, and price bounces on active levels.
🔷 Technical Details and Customizable Inputs
1️⃣ Line Types - Select the type of lines to display: active, broken, both, or none.
2️⃣ Left Length - Determines the number of candles to calculate the previous high or low point.
3️⃣ Right Length - Defines the number of candles needed to confirm a level as Support or Resistance.
4️⃣ Timeframe - You can modify the timeframe of supports and resistances to view levels of a higher timeframe. It's also possible to add additional support and resistance levels using a second timeframe.
5️⃣ Breakout Source - Change the source needed to break support and resistance levels between Close or High/Low.
6️⃣ Delete at Timeframe - Allows removing levels based on the current chart resource instead of using that of the higher timeframe.
7️⃣ Session Range - Choose a period of distance from the last candle to define how far back in the past the indicator should look for Supports or Resistances.
8️⃣ Style Valid Level - Customize the appearance of active levels, including the color of the level itself, Liquidity fill, text color, line style and thickness, extension, as well as the size, position, and values to display in the level text.
9️⃣ Liquidity - This option displays the liquidity associated with each support and resistance level, with three modes: "Wick" which goes from the high/low to the upper/lower body, "Body" instead goes from the level to the lower/upper body of the candle and "Full Range" which extends from the high to the low of the candle.
1️⃣0️⃣ Style Break Level - Allows modifying color, style, and thickness of lines, as well as text width, for two types of breakouts: "MSS" and "BOS".
" MSS " stands for " Market Structure Switch " and indicates a level breakout opposite to the previous breakout, signaling a trend reversal.
" BOS ", on the other hand, means " Break of Structure" and occurs when a level is broken in the same direction as the previous one, confirming trend continuation.
1️⃣1️⃣ Fibonacci Trend Line - Add up to 8 Fibonacci levels based on the last two identified support and resistance levels. Customize the different levels by modifying colors, thickness, style, and extension of lines. You also have the option to add a transparent background between each level.
1️⃣2️⃣ Use Only Confirmed Levels - Activate this option if you want the system to use only the last two confirmed levels, excluding potential levels not yet confirmed.
1️⃣3️⃣ Reverse - Used to reverse the direction of Fibonacci lines.
1️⃣4️⃣ Use Higher / Lower - This option allows using the currently active maximum and minimum levels of Support and Resistance. The indicator will update each Support level until it encounters another active Resistance, and vice versa.
1️⃣5️⃣ Trend Style - Activate/deactivate two types of indicator Trends: "Bar Color" based on level breakouts and "Background Color" based on the last active unconfirmed level.
1️⃣6️⃣ Signal Style - Activate or deactivate the various breakout and bounce signals. Bounces present three options:
Total Rejection(TR) : occurs when the price exceeds the high or low and closes below the liquidity level.
Internal Rejection(IR) : the price closes in the liquidity zone.
Liquidity Rejection(LR) : the price does not exceed the high or low, but only the liquidity level, closing below it.
1️⃣7️⃣ Customized Alerts - Set alerts to be notified in case of breakouts, bounces, or formation of new levels.
These options allow you to optimize the indicator for different trading styles and market conditions, ensuring accurate and tailored technical analysis.
🔍 How to Use Support and Resistance MTF Pro
📌 Using Critical Levels
Consider all levels on the chart as "magnetic points" for the price. These represent critical areas where the market tends to react.
📈 Signal Interpretation
Use the indicator's signals to interpret market movements. A level breakout can indicate a trend reversal or continuation. Bounces can suggest the holding of a level or signal a possible breakout.
🛠 Strategy Integration
Leverage the trend of support and resistance levels, breakouts, and bounces as key elements to develop and refine your trading strategies.
☄️ Support and Resistance simplifies your market analysis, saving you time and improving the accuracy of your decisions. Thanks to clearly visualized and customizable levels, you'll have a clearer and more immediate view of market dynamics.
Don't wait any longer: discover how Support and Resistance can enhance your market analysis, offering you clear indications for faster and more precise trading decisions.
Volumes
Volume Based Price Prediction [EdgeTerminal]This indicator combines price action, volume analysis, and trend prediction to forecast potential future price movements. The indicator creates a dynamic prediction zone with confidence bands, helping you visualize possible price trajectories based on current market conditions.
Key Features
Dynamic price prediction based on volume-weighted trend analysis
Confidence bands showing potential price ranges
Volume-based candle coloring for enhanced market insight
VWAP and Moving Average overlay
Customizable prediction parameters
Real-time updates with each new bar
Technical Components:
Volume-Price Correlation: The indicator analyzes the relationship between price movements and volume, Identifies stronger trends through volume confirmation and uses Volume-Weighted Average Price (VWAP) for price equilibrium
Trend Strength Analysis: Calculates trend direction using exponential moving averages, weights trend strength by relative volume and incorporates momentum for improved accuracy
Prediction Algorithm: combines current price, trend, and volume metrics, projects future price levels using weighted factors and generates confidence bands based on price volatility
Customizable Parameters:
Moving Average Length: Controls the smoothing period for calculations
Volume Weight Factor: Adjusts how much volume influences predictions
Prediction Periods: Number of bars to project into the future
Confidence Band Width: Controls the width of prediction bands
How to use it:
Look for strong volume confirmation with green candles, watch for prediction line slope changes, use confidence bands to gauge potential volatility and compare predictions with key support/resistance levels
Some useful tips:
Start with default settings and adjust gradually
Use wider confidence bands in volatile markets
Consider prediction lines as zones rather than exact levels
Best applications of this indicator:
Trend continuation probability assessment
Potential reversal point identification
Risk management through confidence bands
Volume-based trend confirmation

FuTech V-Spike & V-HighlighterFuTech V-Spike & V-Highlighter
In the context of trading and technical analysis, this volume spike & volume highlighter indicator is the perfect indicator used to assess market activity and make informed trading decisions.
Let's Understand in brief as below :
1) Volume Spike :
A volume spike refers to a sudden, significant increase in trading volume compared to the average volume over a specific period.
This spike can indicate heightened interest in a particular security, often preceding price movements.
Traders may look for volume spikes as signals for potential buy or sell opportunities because they can suggest that a stock is experiencing increased activity, possibly due to news, earnings releases, or other catalysts.
Characteristics of a Volume Spike:
Assess the sudden increase in trading volume.
It Can occur in both upward and downward price movements.
Often compared to the average volume over a defined period (e.g., the last 20 days).
2) Volume Highlighter:
A volume highlighter emphasizes significant changes in trading volume on a price chart. This indicator typically uses color coding to highlight periods of high volume, making it easier for traders to identify volume spikes at a glance.
How this indicator works:
a) Volume Spike will calculate the highest volume spike as per the user defined threshold multiplier. (Multiplier = when volume exceeds a certain threshold)
b) The threshold Multiplier can be set based on a fixed number or as a multiple of the Exponential Moving Average volume. Volume Spike Multiplier default is 1.5, means the EMA volume should cross 1.5 times the user defined lookback period
c) The result is derived from the user defined lookback candles by using its EMA instead of SMA, which will give us more precise results.
d) By default, last 10 candles EMA average is used to calculate the Volume Spike but you can choose your lookback period as many days, weeks, months, years of your choice !
e) In Volume Spike -
- Green candle will show Yellow color Bar as Bullish sentiments, whereas
- Red candle will show Black Bar as Bearish sentiments.
f) Volume Highlighter will highlight the candles background if the highest volume is crossing as per the the user defined lookback period
g) Default Lookback period is 20, Color coding (e.g., Blue for bullish spikes, Red for bearish spikes) helps traders quickly assess the volume context.
h) Volume Highlighter plotting shapes and positions can be modified
Illustration:
From the Above pic,
If last Volume Spike is 10 lookback candles, Spike multiplier is 1.5 and Highlighter lookback candles is 20,
Then yellow candle means the spike in volume which is 1.5 times higher than the last 10 candles
Highlighting color defines the highest volumes trading from the last 20 candles which is either Blue (Bullish) or Red (Bearish) sentiments
Conclusion :
Using FuTech V-Spike & V-Highlighter indicator - will help traders identify potential trading opportunities and better understand market dynamics.
By analyzing volume in conjunction with price movements, traders can make more informed decisions based on market sentiment.
Thank you !
Jai Swaminarayan Dasna Das !
He Hari ! Bas Ek Tu Raji Tha !

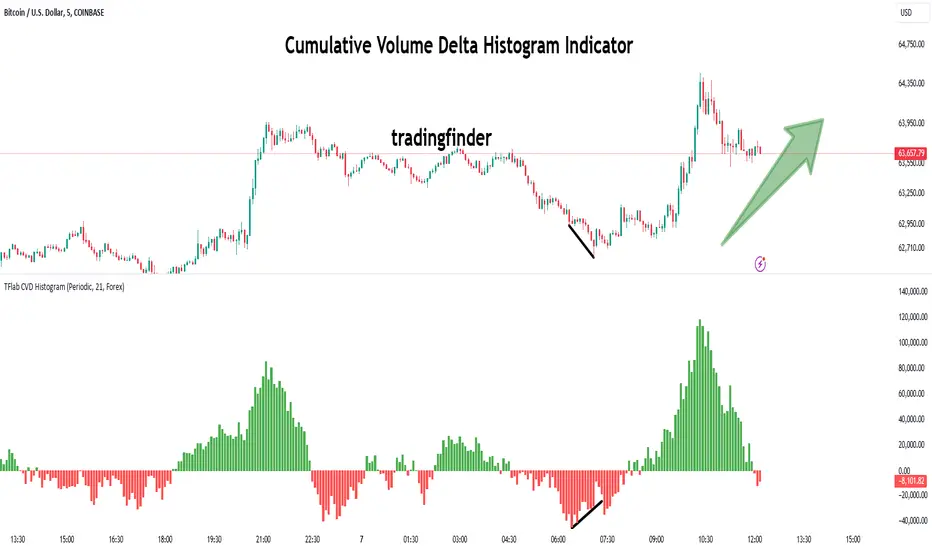
Cumulative Volume Delta Histogram [TradingFinder] CVD Histogram🔵 Introduction
To fully understand Cumulative Volume Delta (CVD), it’s important to start by explaining Volume Delta. In trading, "Delta" refers to the difference between two values or the rate of change between two data points. Volume Delta represents the difference between buying and selling pressure for each candlestick on a chart, and this difference can vary across different time frames.
A positive delta indicates that buying volume exceeds selling volume, while a negative delta shows that selling pressure is stronger. When buying and selling volumes are equal, the volume delta equals zero.
The Cumulative Volume Delta (CVD) indicator tracks the cumulative difference between buying and selling volumes over time, helping traders analyze market dynamics and identify reliable trading signals through CVD divergences.
🔵 How to Use
Cumulative Volume Delta (CVD) is an essential technical analysis tool that aggregates delta values for each candlestick, creating a comprehensive indicator. This helps traders evaluate overall buying and selling pressure over market swings.
Unlike standard Volume Delta, which compares the delta on a candle-by-candle basis, CVD provides a broader view of buying and selling pressure during market trends. A downward-trending CVD suggests that selling pressure is dominant, which is typically a bearish signal.
Conversely, an upward-trending CVD indicates bullish sentiment, suggesting buyers are in control. This analysis becomes even more valuable when compared with price action and market structure, helping traders predict the direction of asset prices.
🟣 How to Use CVD in Trend Analysis and Market Reversals
Understanding how to detect trend changes using Cumulative Volume Delta is crucial for traders. Typically, CVD aligns with market structure, moving in the same direction as price trends.
However, divergences between CVD and price movements or signs of volume exhaustion can be powerful indicators of potential market reversals. Recognizing these patterns helps traders make more informed decisions and improve their trading strategies.
🟣 How to Spot Trend Exhaustion with CVD
CVD is particularly effective for identifying trend exhaustion in the market. For instance, if an asset's price hits a new low, but CVD doesn’t follow, this might indicate a lack of seller interest, signaling potential exhaustion and a possible reversal.
Similarly, if an asset reaches a new high but CVD fails to follow, it can suggest that buyers lack the strength to push the market higher, indicating a possible reversal to the downside.
🟣 How to Use CVD Divergence in Price Trend Analysis
Another effective use of CVD is identifying divergences in price trends. For example, if CVD breaks a previous high or low while the price remains stable, this divergence may indicate that buying or selling pressure is being absorbed.
For instance, if CVD rises sharply without a corresponding increase in asset prices, it may suggest that sellers are absorbing the buying pressure, which could lead to a strong sell-off. Conversely, if prices remain stable while CVD declines, it may indicate that buyers are absorbing selling pressure, likely leading to a price increase once the selling subsides.
🟣 CVD Display, Candlestick vs. Histogram – What’s the Difference?
CVD can be displayed in two different formats :
Candlestick Display : In this format, the data is shown as green and red candlesticks, each representing the difference in buying and selling pressure over a given time period. This display allows traders to visually analyze market pressure along with price changes.
Histogram Display : Here, the data is represented as vertical green and red bars, where each bar’s height corresponds to the volume delta. This format offers a clearer view of the strengths and weaknesses in market buying and selling pressure.
🟣 What are the Key Settings for CVD?
Cumulative Mode : CVD offers three modes: "Total," "Periodic," and "EMA." In "Total" mode, CVD accumulates the delta from the beginning to the end of the session. In "Periodic" mode, it accumulates volume periodically, resetting at specific intervals. In "EMA" mode, the CVD is smoothed using an Exponential Moving Average (EMA) to filter out short-term fluctuations.
Period : The "Period" setting allows you to define the number of bars or intervals for "Periodic" and "EMA" modes. A shorter period captures more short-term movements, while a longer period smooths out the fluctuations and provides a broader view of market trends.
Market Ultra Data : This feature integrates data from 26 major brokers into the volume calculations, providing more reliable volume data. It’s important to specify the type of market you are analyzing (Forex, crypto, etc.) as different brokers contribute to different markets. Enabling this setting ensures the highest accuracy in volume analysis.
🔵 Conclusion
Cumulative Volume Delta (CVD) is a powerful technical indicator that helps traders assess buying and selling pressure by aggregating the delta values of each candlestick. Whether displayed as candlesticks or histograms, CVD provides insights into market trends, helping traders make informed decisions.
CVD is particularly useful in identifying divergences and exhaustion in market trends. For example, if CVD does not align with price movements, it can signal a potential trend reversal. Traders use this tool to fine-tune their entry and exit points and better predict future market movements.
In summary, CVD is a versatile tool for analyzing volume data and understanding the balance of buying and selling pressure in the market, making it an invaluable asset in any trader’s toolkit
Volume to Shares Outstanding Ratio IndicatorDescription:
This indicator shows the ratio of trading volume to the total number of shares outstanding.
Formula:
Volume to Shares Outstanding Ratio = (Trading Volume / Shares Outstanding) * 100
説明:
このインジケーターは、出来高を発行済株式数で割った比率を表示します。
式:
出来高の割合 = (出来高 / 発行済株式数) × 100

Cumulative Volume Delta Divergence [TradingFinder] Periodic EMA🔵 Introduction
The Cumulative Volume Delta (CVD) is a powerful tool in technical analysis that is derived from market volume or trading activity. The Cumulative Volume Delta Divergence Detector Indicator helps traders identify Cumulative Volume Delta Divergences (CVD Divergence), which can provide reliable trading signals.
These divergences, such as bullish and bearish CVD divergences, act as key indicators of potential trend reversals in financial markets. By analyzing CVD divergences, traders can gain insights into the strength of buying and selling pressure and make more informed predictions about price trends.
The CVD indicator is particularly effective for traders who engage in day trading and scalping, as it helps identify price reversal points by analyzing volume and price behavior.
Using the CVD indicator in combination with other technical tools such as support and resistance levels and candlestick patterns allows for a more accurate market analysis.
🔵 How to Use
Divergences are one of the most important technical analysis signals that indicate the current strength of a price move may not be sustainable.
Cumulative Volume Delta Divergence helps traders identify potential trading opportunities that may not be visible on the price chart alone.
This type of divergence examines the relationship between buying and selling volume and price, enabling traders to better understand price trends.
🟣 Bullish CVD Divergence
A bullish CVD divergence occurs when the price makes a lower low, but the CVD indicator shows a higher low. This indicates increasing buying pressure in the market, even though the price is declining. In other words, despite the price dropping, buyers are gradually gaining strength, which could signal a price reversal and the start of a bullish trend.
How to use this signal : In this scenario, traders looking to go long can use this signal as a favorable opportunity to enter the market. After a bullish divergence, the market typically tends to move upward.
To reduce risk, traders can wait for further confirmation from the price chart. For example, if the price breaks through the previous high after the divergence or breaks a resistance level, this could be a more reliable signal for entering the market.
🟣 Bearish CVD Divergence
A bearish CVD divergence is the opposite of a bullish divergence. In this type of divergence, the price makes a higher high, but the CVD indicator shows a lower high. This indicates decreasing buying pressure and weakening momentum in the current bullish trend. A bearish divergence often serves as a warning of a potential market reversal to the downside.
How to use this signal : Traders can use this divergence as an opportunity to exit long positions or enter short positions. When the CVD indicator makes a lower high compared to the price, it signals weakness in buyer strength.
If traders receive further confirmation from the price chart, such as a break of key support levels or an increase in selling volume, this can serve as a stronger signal for the beginning of a bearish trend.
🟣 How to Build a Trading Strategy with Cumulative Volume Delta Divergence
Using CVD divergence alone may not be sufficient. Traders should combine this tool with other technical analysis techniques and indicators to have more confidence in their decisions. For example, when observing a CVD divergence, traders can also analyze volume, trend lines, or candlestick patterns to get a more accurate market analysis.
Additionally, risk management should always be a priority. Using stop-loss orders and properly sizing trades can help traders minimize their losses if they make a mistake.
🔵 Setting
Divergence Fractal Period : Determines the period of swings. The minimum and default value is 2.
CVD Period : You can set the period of " Periodic " and " EMA " modes.
Cumulative Mode : It has three modes "Periodic" and "EMA". In "Periodic" mode, it accumulates the volume periodically and in "EMA" mode, it calculates the moving average of the volume.
Market Ultra Data : If you turn on this feature, 26 large brokers will be included in the calculation of the trading volume. The advantage of this capability is to have more reliable volume data. You should be careful to specify the market you are in, FOREX brokers and Crypto brokers are different.
🔵 Conclusion
The Cumulative Volume Delta (CVD) indicator is a powerful tool in technical analysis, helping traders better identify price trends and make more accurate market predictions. By identifying CVD divergences, traders can anticipate price reversals and time their market entries and exits accordingly.
Bullish and bearish CVD divergences each provide valuable signals that can help traders identify the best entry and exit points in the market. A bullish CVD divergence signals strength in buying that will likely lead to a price increase, while a bearish CVD divergence indicates weakness in the bullish trend and the potential for the beginning of a bearish trend.
Overall, combining CVD with other technical analysis tools and employing risk management strategies can help traders make better trading decisions and capitalize on available market opportunities.

Price-Volume w Trendline - Strategy [presentTrading]█ Introduction and How it is Different
The Price-Volume with Trendline Strategy is an innovative strategy that combines volume profile analysis, price-based Z-scores, and dynamic trendline filtering to identify optimal entry and exit points in the market. What sets this strategy apart is the integration of volume concentration (Point of Control or PoC) with dynamic volatility thresholds. Additionally, this strategy introduces a multi-step take profit (TP) mechanism that adjusts based on predefined levels, allowing traders to exit trades progressively while capitalizing on market momentum.
BTCUSD 6hr LS Performance
█ Strategy, How it Works: Detailed Explanation
The combination of multiple indicators and methodologies serves to create a more robust and reliable trading system. Each element is carefully chosen for its complementary role in providing accurate signals while minimizing false entries and exits. Here’s why the different components were chosen and how they work together:
- PoC and Z-Scores: The volume profile identifies key price areas, while the Z-score measures deviations from the mean. Together, they highlight points where the market is likely to react. For example, when the Z-score indicates an oversold condition near a PoC support level, it increases the probability of a reversal, providing a clear entry signal.
- Trendlines and Z-Scores: Trendlines serve as a secondary filter to ensure that price deviations identified by Z-scores align with broader market trends. This ensures that trades are only entered when the price has both deviated from its average and broken through a significant trendline level, reducing the likelihood of false signals.
- Multi-Step TP and Risk Management: Finally, the multi-step take profit logic works in tandem with the entry signals generated by the PoC, Z-scores, and trendlines. As the price moves in favor of the trade, profits are gradually locked in, ensuring the trader captures gains while still leaving room for further upside.
🔶 Point of Control (PoC) and Volume Profile Analysis
The PoC identifies the price level with the highest volume concentration within a specified lookback period. This price level represents where the most trading activity has occurred, often acting as a strong support or resistance. By breaking down the range into several rows (bins), the strategy identifies how much volume was traded at each price level.
🔶 Z-Score Calculation
The Z-score is a statistical metric that measures how far the current price is from its mean, expressed in terms of standard deviations. This is calculated both for price deviation and PoC-based deviation.
🔶 Trendline Breakout Filtering
The trendline filtering is a crucial aspect that refines entry signals by confirming trend continuation or reversals. It calculates trendlines based on pivot highs and lows using the selected method (e.g., ATR or standard deviation).
🔶 Multi-Step Take Profit
The multi-step take profit mechanism allows the strategy to take partial profits at several predefined levels. For example, when the price reaches 3%, 8%, 14%, or 21% above (or below) the entry price, it exits portions of the position. This is a useful technique for locking in profits as the market moves favorably.
Local
█ Usage
The Price-Volume with Trendline Strategy can be applied to various asset classes, including stocks, cryptocurrencies, and commodities. It is particularly effective in volatile markets where price deviations and volume concentrations signal potential reversals or trend continuations. By adjusting the settings for volatility and the lookback period, this strategy can be tailored to both short-term intraday trades and longer-term swing trades.
█ Default Settings
The default settings in the strategy play a vital role in shaping its performance.
- POC_lookbackLength (144): This defines the number of bars used to calculate the PoC. A longer lookback captures more data, leading to a more stable PoC, but may result in delayed signals. A shorter lookback increases responsiveness but may introduce noise.
- priceDeviationLength (200): This determines the period for calculating the standard deviation of price. A higher length smooths out the volatility, reducing the likelihood of false signals. Shorter lengths make the strategy more sensitive to sudden price movements.
- TL_length (14): Controls the swing detection period for trendline calculation. A shorter length will generate more frequent trendline breakouts, while a longer length captures only significant moves.
- Stop Loss and Take Profit: The strategy offers both fixed and SuperTrend-based stop losses. SuperTrend is adaptive to volatility, while fixed stop losses provide simpler risk control. The multi-step take profit ensures that profits are secured progressively, which can improve performance in trending markets by reducing the risk of full reversals.
Each of these settings can significantly affect the strategy’s risk-reward balance. For instance, increasing the stop loss level or the take profit percentages allows the strategy to stay in trades longer, potentially increasing profit per trade but at the cost of larger drawdowns. Conversely, tighter stops and smaller profit targets result in more frequent trades with lower average profit per trade.

Cumulative Delta [TradingFinder] Volume + Periodic + EMA🔵 Introduction
To fully grasp the concept of Cumulative Volume Delta (CVD), it's essential first to understand Volume Delta. In trading and technical analysis, the term "Delta" typically refers to the difference between two values or the rate of change between two data points.
Volume Delta represents the difference between buying and selling pressure, calculated for each candlestick on a chart. This difference can vary across different timeframes.
A positive delta indicates that buying volume exceeds selling volume, while a negative delta shows that selling volume is greater. When buying and selling volumes are equal, the volume delta equals zero.
🟣 What is Cumulative Volume Delta (CVD)?
Cumulative Volume Delta (CVD) is a powerful tool in technical analysis that aggregates delta values for each candlestick, creating a comprehensive indicator that helps traders assess market trends.
Unlike the standard Volume Delta, which compares delta on a candle-by-candle basis, CVD provides insight into the overall buying and selling pressure during key market swings. A downward-trending CVD suggests that selling pressure is dominating, which is typically a bearish signal.
Conversely, an upward-trending CVD indicates bullish sentiment. This analysis becomes even more significant when comparing CVD with price action and market structure, helping traders to predict asset price directions.
By evaluating market highs and lows, one can determine the market trend. A consistent rise in these points indicates an uptrend, while a consistent fall suggests a downtrend.
🔵 How to Use
Understanding how to detect trend changes using Cumulative Volume Delta is crucial for traders. Typically, CVD aligns with market structure, moving in the same direction as price trends.
However, divergences between CVD and price trends or signs of exhaustion in volume can be powerful indicators of potential market reversals. Recognizing these patterns can help traders make informed decisions and improve their trading strategies.
🟣 Identifying Trend Exhaustion with Cumulative Volume Delta (CVD)
The Cumulative Volume Delta (CVD) indicator is especially effective in identifying weakening trends in the market. For instance, if gold's price hits a new low, but CVD does not follow suit, this may indicate a lack of seller interest despite the new low, signaling potential seller exhaustion.
Most traders interpret this as a possible reversal from a bearish to a bullish trend. Similarly, if gold reaches a new high but CVD fails to do the same, it can suggest that buyers lack the strength to push the market higher, indicating a possible trend reversal.
🟣 Utilizing Cumulative Volume Delta (CVD) Divergence in Price Trend Analysis
Another effective use of CVD is identifying divergences in price trends. For example, if CVD breaks a previous high or low while the price remains stable, this divergence often indicates that buying or selling pressure is being absorbed.
For instance, if CVD rises sharply without a corresponding increase in gold prices, it may suggest that sellers are absorbing the buying pressure, potentially leading to a strong sell-off. Conversely, if gold prices remain stable while CVD declines, it could indicate that buyers are absorbing selling pressure, likely leading to a price increase once selling subsides.
🔵 Setting
Cumulative Mode : It has three modes "Total", "Periodic" and "EMA". In "Total" mode, it collects the volume from the beginning to the end. In "Periodic" mode, it accumulates the volume periodically and in "EMA" mode, it calculates the moving average of the volume.
Period : You can set the period of " Periodic " and " EMA " modes.
Market Ultra Data : If you turn on this feature, 26 large brokers will be included in the calculation of the trading volume.
The advantage of this capability is to have more reliable volume data. You should be careful to specify the market you are in, FOREX brokers and Crypto brokers are different.
🔵 Conclusion
Cumulative Volume Delta (CVD) is a powerful analytical tool in financial markets that helps analysts and traders assess buying and selling pressure by aggregating and combining the volume delta for each candlestick.
CVD can indicate the strength or weakness of a market trend. When CVD moves upward, it signals that buying pressure is dominant and is considered a bullish signal; conversely, a downward movement in CVD indicates that selling pressure is stronger and is viewed as a bearish signal.
This indicator is particularly effective in identifying divergences and exhaustion in market trends. For example, if CVD does not align with price movements, it may suggest a potential trend reversal.
Traders use this information to make more informed trading decisions, especially when identifying entry and exit points in the market.
Overall, CVD is a tool that enables analysts to better understand market fluctuations and more accurately predict future market trends.

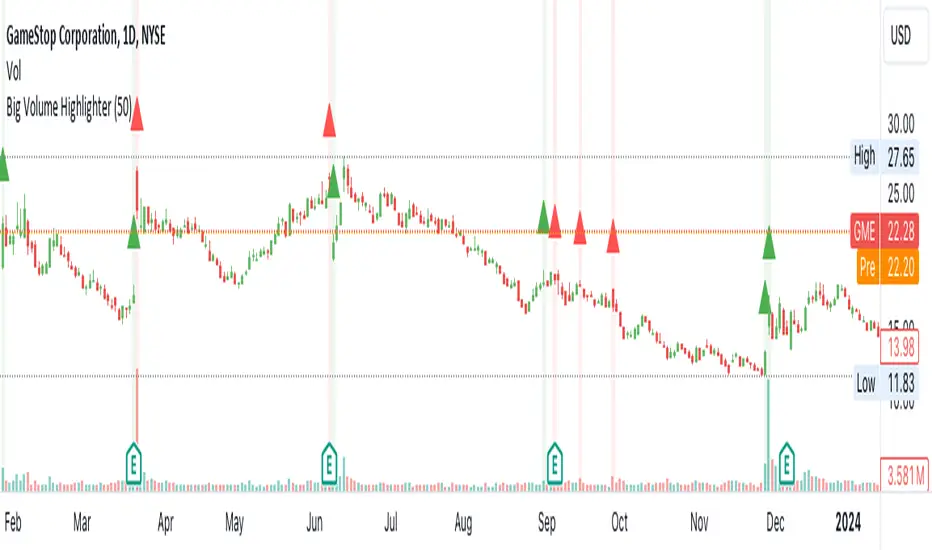
Big Volumes HighlighterBig Volumes Highlighter
Overview:
The "Big Volume Highlighter" is a powerful tool designed to help traders quickly identify candles with the highest trading volume over a specified period. This indicator not only highlights the most significant volume candles but also color-codes them based on the candle's direction—green for bullish (close > open) and red for bearish (close < open). Whether you're analyzing volume spikes or looking for key moments in price action, this indicator provides clear visual cues to enhance your trading decisions.
Features:
Customizable Lookback Period: Define the number of candles to consider when determining the highest volume.
Automatic Color Coding: Candles with the highest volume are highlighted in green if bullish and red if bearish.
Visual Clarity: The indicator marks the significant volume candles with a triangle above the bar and changes the background color to match, making it easy to spot important volume events at a glance.
Use Cases:
Volume Spike Detection:
Quickly identify when a large volume enters the market, which may indicate significant buying or selling pressure.
Trend Confirmation: Use volume spikes to confirm trends or potential reversals by observing the direction of the high-volume candles.
Market Sentiment Analysis: Understand market sentiment by analyzing the direction of the candles with the biggest volumes.
How to Use:
Add the "Big Volume Highlighter" to your chart.
Adjust the lookback period to suit your analysis.
Observe the highlighted candles for insights into market dynamics.
This script is ideal for traders who want to incorporate volume analysis into their technical strategy, providing a simple yet effective way to monitor significant volume changes in the market.
Volume Insignts AnalyzerDescription:
The Volume Insight Analyzer is an advanced Pine Script designed for traders who want a comprehensive view of volume dynamics on their charts. This script combines multiple volume-based indicators to help identify key trading opportunities, including significant volume days, volume dry-ups, and pocket pivots.
Key Features:
VDU (Volume Dry-Up) Detection: Automatically identifies and marks days when the volume is significantly below its moving average, helping to spot potential breakout or breakdown points. Customizable volume thresholds allow for tailored analysis based on your trading strategy. The Volume Dry-Up label appears when the volume is substantially below its average level and the price is near a key moving average. This condition indicates a period of equilibrium between supply and demand, suggesting a potential low-risk entry point for traders.
Pocket Pivot Analysis using 5 and 10 Length Pocket Pivots: Highlights days with exceptionally high volume compared to recent history, indicating potential pocket pivots. Visual markers on the chart and volume bars color-coded for 5 and 10-day lengths. Pocket pivot points are identified when the volume on a given day exceeds the maximum volume observed over the past several days. Specifically, a 5-day pocket pivot point is marked when today's volume surpasses the highest selling volume of the last 5 days. A cluster of 5-day pocket pivot points within a base is a strong indicator of stock strength. Similarly, a 10-day pocket pivot point following a Volume Dry-Up (VDU) suggests a potential entry opportunity. Moreover, a pre-existing cluster of 5-day pocket pivot points before a 10-day pocket pivot point provides greater conviction in the trade.
Volume Moving Averages: Set different lengths for primary and secondary moving averages to track volume trends over daily, weekly, and monthly timeframes. Options to display moving average lines on the volume chart.
Volume Visualization:
a. Major and Minor Volume Bars: Option to display bars that are either above or below average volume levels. Adjustable settings to show or hide these bars based on user preference.
b. Volume Bar Coloring: Volume bars are color-coded based on significant volume thresholds, including green for bullish signals, red for bearish signals, and orange for volume dry-ups.
Volume Metrics Table: A customizable table that displays real-time volume metrics including Relative Volume (RVOL), Turnover, and the number of high volume days. The table can be oriented horizontally or vertically and styled according to your theme preferences.
Visual Indicators:
a) Volume Dry-Up (VDU) Labels: Clearly marked VDU events with textual annotations on the chart.
b) Bullish and Bearish Arrows: Arrows indicating potential bullish or bearish closes based on volume analysis, enhancing decision-making.
Customization Options:
a) Dark and Light Theme Support: Toggle between dark and light themes to match your chart settings.
b) Adjustable Parameters: Easily configure input settings such as volume thresholds, MA lengths, and table display options to fit your trading style.
How to Use:
Set Parameters: Adjust the script settings such as volume thresholds, moving average lengths, and display preferences according to your analysis needs.
Analyze Volume Patterns: Use the indicators and visual markers provided by the script to identify significant volume patterns and potential trading signals.
Monitor Metrics: Refer to the volume metrics table for a quick overview of key volume-related statistics and trends.
Make Informed Decisions: Utilize the visual cues and volume data provided by the script to enhance your trading strategy and make more informed decisions.
Disclaimer:
This script is for informational purposes only and should not be considered as trading advice. Use it in conjunction with other analysis tools and consult with a financial advisor if needed. Trading involves risk, and past performance does not guarantee future results.

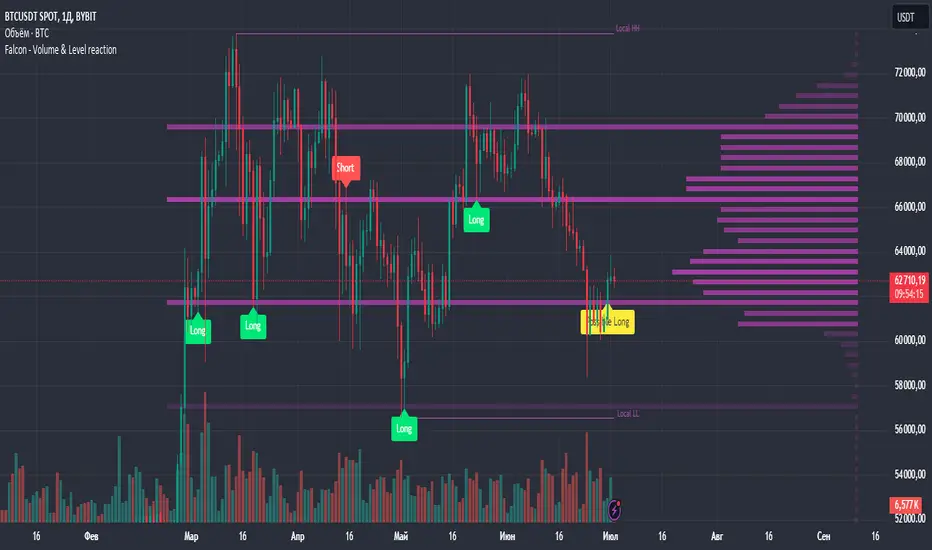
Falcon - Volume & Level reaction Falcon - Volume & Level Reaction
Our indicator, Falcon - Volume & Level Reaction, is designed to provide traders with comprehensive insights into price behavior through the calculation of horizontal volume profiles. By analyzing these profiles, the indicator identifies key levels and assesses price reactions, offering valuable trading signals.
---
# Concept
The Falcon - Volume & Level Reaction indicator is built to help traders identify and capitalize on key market levels by analyzing volume profiles and price behavior. This indicator enhances trading strategies by providing clear signals based on robust analysis, allowing traders to make informed decisions and improve their trading outcomes.
---
# Functions
1. Volume Profile Calculation
- Profile Period: Calculates horizontal volume profiles over a specified number of bars.
- Peak Volumes: Identifies peak volume levels based on the sensitivity parameter.
2. Price Behavior Analysis
- Primary Check: Determines if bars close above or below the peak level.
- Secondary Checks:
- Volume Decrease: Confirms a decrease in volume after the price touches the level.
- Volatility Check: Ensures bars do not exceed the average ATR range.
3. Signal Generation
- Combined Signals: The primary check generates initial long/short signals, while secondary checks strengthen these signals.
- Real-time Alerts: Provides "Potential" short or long signals based on the current candle's closure relative to the level.
4. Comprehensive Analysis: Helps identify multiple factors that validate level protection and potential price reversals.
---
# Description of Checks
1. Primary Check: Price Closure
- This check assesses whether the bars close above or below the identified peak volume levels. If the price closes above the level, it generates a long signal; if it closes below, it generates a short signal. This check is fundamental as it directly indicates the price's interaction with significant volume levels.
2. Secondary Check 1: Volume Decrease
- After the price touches a peak volume level, this check verifies if there is a subsequent decrease in trading volume. A decrease in volume after touching the level suggests reduced market interest at that price, which can indicate potential reversals or continuations based on the overall market context.
3. Secondary Check 2: Volatility Check
- This check ensures that the price bars do not exceed the average ATR range after touching the peak volume level. Lower volatility near key levels indicates stability and strengthens the signal generated by the primary check, confirming the market's reaction to these levels.
---
# How to Use the Indicator
1. Set Parameters: Define volume profile parameters such as profile period, number of peaks, and level sensitivity.
2. Analyze the Chart: Observe the peak volume levels displayed on the chart.
3. Receive Signals: Follow the buy or sell signals that appear when the price touches the level and the primary and secondary checks are met.
4. Respond to Alerts: When a "Potential" long or short signal appears, evaluate the closure of the current candle relative to the level to make a trading decision.
Example of Work
- Setup:
- Result:
---
# Input Parameters
- Profile back: Defines the lookback period for volume profiles (10–500, step 1).
- Max Profile: Sets the maximum number of profiles (10–300, step 5).
- Profiles Length: Specifies the length of profiles (10–100, step 1).
- Profiles Offset: Determines the offset for profiles (0–100, step 1).
- Profiles Width: Sets the width of profiles (1–10).
- Profiles Color: Chooses the color for profiles.
- Lvls Color: Chooses the color for levels.
- Lvl's sensitivity: Adjusts the sensitivity of levels (1–10).
- tolerance: Sets the tolerance level (0.000–0.003, step 0.001).
- tolerance ATR: Defines the ATR tolerance (1.0–4.0).
---
Falcon - Volume & Level Reaction
Индикатор на основе горизонтальных объемов помогает трейдерам выявлять ключевые уровни объемной проторговки, предоставляя четкие сигналы для принятия торговых решений.
Функции
– Определение и отображение пиковых уровней объемной проторговки.
– Сигналы на покупку (Long) и продажу (Short) на основе поведения цены.
– Анализ объема торгов до и после касания уровня.
– Оценка волатильности цены в период консолидации.
– Автоматическая подстройка под выбранный таймфрейм.
– Отображение локальных максимумов и минимумов.
Настройки
– Количество баров назад VRVP: определяет период для расчета горизонтальных объемов.
– Множитель ATR: коэффициент для вычисления волатильности.
– Множитель погрешности: допустимая погрешность касания уровня.
– Период расчета ATR: количество баров для расчета среднего ATR.
– Отображение Local HH/LL: включение/выключение отображения локальных максимумов и минимумов.
Версии
Данный скрипт – упрощенная версия нашего индикатора с закрытым доступом. Открытая версия доступна для BTC и ETH, только на дневном таймфрейме, без возможности изменения параметров
Volume ScoreVolume Score Indicator (VSCR)
The Volume Score Indicator (VSCR) is a powerful tool designed to enhance your trading analysis by evaluating volume activity relative to historical levels. This indicator provides valuable insights into volume trends, highlighting significant volume spikes and their implications for price movements.
Key Features:
1. Volume Analysis:
a.) Volume (RVol): Calculates the relative volume based on the 50-day simple
moving average.
b.) High Volume Conditions: Identifies conditions where volume is significantly higher
than historical levels, including:
b1.) Highest Volume in 1 Year (HV1Y): Volume exceeds the highest volume of
the year.
b2.) Highest Volume in 3 Months (HVQ): Volume exceeds the highest volume of
the past 3 months.
c.) Pocket Pivot Volume (PPV):
c1.) High Relative Volume: Volume is at least twice the 50-day moving average
volume.
c2.) Pocket Pivot Volume: Latest bar volume is higher than the highest down
volume bar of the last 10 days.
2.Volume Score Calculation:
a.) Computes a cumulative volume score (VSCR) based on the frequency and magnitude
of identified high-volume conditions over a user-defined look-back period (default:
90 days).
b.) Adds points to the volume score based on relative volume (RVol). For example, if
the current day's relative volume is 500% of the 50-day average volume, 5 points
will be added to the volume score.
Formula: Volume Score = Volume Score + (RVol / 100)
3. Customizable Plotting:
a.) High Volume Plotting (HV): Option to plot circles above bars when HV1Y or HVQ
conditions are met.
b.) Pocket Pivot Volume Plotting (PPV): Option to plot circles above bars when any of
the Pocket Pivot Volume conditions are met.
4.Interactive Table Display:
a.) Configurable table to display key volume metrics and scores.
b.) Customizable table layout (horizontal or vertical) and positioning (top, middle,
bottom; left, center, right).
c.) Dynamic Background Coloring: The table cells are color-coded to highlight
significant volume levels and scores:
c1.) Blue: Indicates a very high volume score or count, signaling exceptionally
strong volume activity (e.g., count >= 15, score >= 50).
c2.) Green: Represents a high but not extreme volume level, suggesting notable
volume activity (e.g., 10 <= count < 15, 40 <= score < 50).
c3.) Orange: Marks moderate volume activity, which is still above average but
less pronounced (e.g., 7 <= count < 10, 25 <= score < 40).
c4.) Red: Signifies relatively low volume activity, potentially indicating less
significant volume changes (e.g., count < 7, score < 25).
5.How to Use:
a.) Input Parameters:
a1.) Plot HV: Toggle to plot high volume i.e. HV1Y and HVQ conditions on the
chart. When enabled green plot will appear above the price bars on the
chart.
a2.) Plot PPV: Toggle to plot pocket pivot volume conditions on the chart. When
enabled orange plot will appear above the price bars on the chart.
a3.) Look Back Period: Define the period for looking back to calculate volume
conditions and scores (default: 90 days).
b.) Table Display:
b1.) Panel Options: Customize the table's position, layout, text size, and colors
to suit your preferences.
b2.) Volume Metrics: The table displays counts of high-volume events (HV1Y,
HVQ & PPV) and the cumulative volume score, color-coded based on
thresholds for easy interpretation.
c.) Practical Applications:
c1.) Volume Spike Detection: Quickly identify significant volume spikes that
may indicate institutional buying.
c2.) Historical Volume Context: Understand current volume activity in the
context of historical volume patterns.
c3.) Enhanced Decision Making: Use volume insights to make informed trading
decisions, particularly around areas of significant volume changes.
This indicator is an essential tool for traders looking to incorporate volume analysis into their trading strategy, providing clear and actionable insights into volume dynamics.
***Note***
Candlestick Exclusion: The indicator ignores any candles where the closing price is less than the opening price. All calculations and analysis are based on candles where the closing price is higher than the opening price.

Wicks Rejection PercentagesAnalyzing wick rejection percentages can provide insights into market sentiment and potential future price movements. For example, high wick rejection percentages at key support or resistance levels may indicate strong buying or selling interest and could influence trading decisions.

Volume Spectrum Candles"Volume Spectrum Candles" is a visually intuitive trading indicator that enhances candlestick charts by incorporating trading volume directly into the color of each candle.
Purpose and Utility:
This tool assigns a unique color gradient to candlesticks, which varies from light to dark based on the volume of trades executed. This feature allows traders to immediately recognize and differentiate periods of varying trading activity at a glance.
Target User:
It is specifically designed for traders who integrate volume analysis into their trading strategies, offering a seamless blend of visual cues and technical data.
Benefits:
By providing a visual representation of volume intensity, traders can more effectively identify key market movements, helping to determine optimal entry and exit points. The color gradation adds a layer of quick analysis, making it easier to spot trends in trading volume without the need for additional indicators.
Application and Versatility:
Whether used by day traders to capture short-term price movements or by long-term investors to gauge broader market sentiment, "Volume Spectrum Candles" serves as a valuable addition to any trading setup.

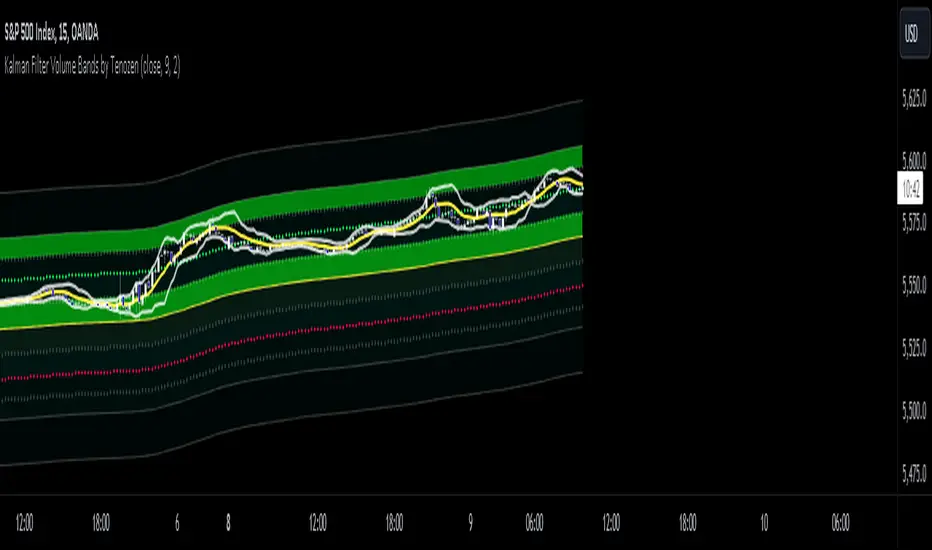
Kalman Filter Volume Bands by TenozenHello there! I am excited to introduce a new original indicator, the Kalman Filter Volume Bands. This indicator is calculated using the Kalman Filter, which is an adaptive-based smoothing quantitative tool. The Kalman Filter Volume Bands have two components that support the calculation, namely VWAP and VaR.
VWAP is used to determine the weight of the Kalman Filter Returns, but it doesn't have a significant impact on the calculation. On the other hand, VaR or Value at risk is calculated using the 99th percentile, which means that there is a 1% chance for the returns to exceed the 99th percentile level. After getting the VaR value, I manually adjust the bands based on the current market I'm trading on. I take the highest point (VaR*2) and the lowest point (-(VaR*2)) from the Kalman Filter, and then divide them into segments manually based on my preference.
This process results in 8 segments, where 2 segments near the Kalman Filter are further divided, making a total of 12 segments. These segments classify the current state of the price based on code-based coloring. The five states are very bullish, bullish, very bearish, bearish, and neutral.
I created this indicator to have an adaptive band that is not biased toward the volatility of the market. Most band-based indicators don't capture reversals that well, but the Kalman Filter Volume Bands can capture both trends and reversals. This makes it suitable for both trend-following and reversal trading approaches.
That's all for the explanation! Ciao!
Additional Reminder:
- Please use hourly timeframes or higher as lower timeframes are too noisy for reliable readings of this indicator.
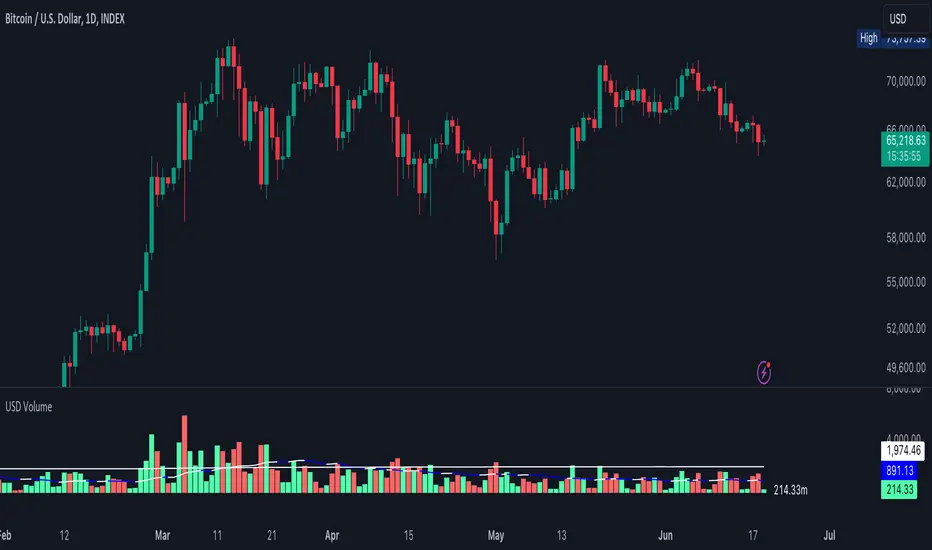
USD VolumeA volume tool but the candles represent Volume in USD Format which is usually
here are some examples of what the numbers represent on the right-hand side.
.01 = $10,000
.5 = $500,000
1 = $1,000,000
50 = $50,000,000
250 = $250,000,000
1000 = $1,000,000,000
The lower line is the "Average Volume" based on lifetime history. Anytime volume is below average, this likely denotes most people have capitulated or the markets have grown bored at these price ranges. A squeeze in volume primes the asset for a big move.
The upper line is the 3rd standard of Deviation from the average line. Anytime volume touches that line or goes higher, this denotes its a very big move relative to how the asset typically trades. If the volume stays above this range for an extended period of time, it would be wise to watch the chart closely and start taking profits off the table whether you're shorting or longing the asset.
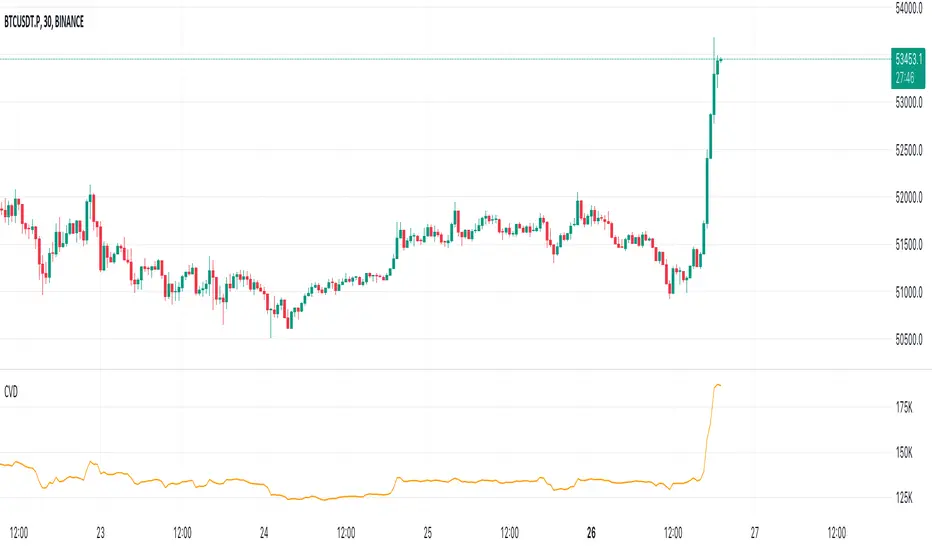
Cumulative Volume Delta (CVD)█ OVERVIEW
Cumulative Volume Delta (CVD) is a volume-based trading indicator that provides a visual representation of market buying and selling pressure by calculating the difference in traded volumes between the two sides. It uses intrabar information to obtain more precise volume delta information than methods using only the chart's timeframe.
Volume delta is the net difference between Buy Volume and Sell Volume. Positive volume delta indicates that buy volume is more than sell volume, and opposite. So Cumulative Volume Delta (CVD) is a running total/cumulation of volume delta values, where positive VD gets added to the sum and negative VD gets subtracted from the sum.
I found simple and fast solution how to calculate CVD, so made plain and concise code, here is CVD function :
cvd(_c, _o, _v) =>
var tcvd = 0.0, delta = 0.0
posV = 0.0, negV = 0.0
totUV = 0.0, totDV = 0.0
switch
_c > _o => posV += _v
_c < _o => negV -= _v
_c > nz(_c ) => posV += _v
_c < nz(_c ) => negV -= _v
nz(posV ) > 0 => posV += _v
nz(negV ) < 0 => negV -= _v
totUV += posV
totDV += negV
delta := totUV + totDV
cvd = tcvd + delta
tcvd += delta
cvd
where _c, _o, _v are close, open and volume of intrabar much lower timeframe.
Indicator uses intrabar information to obtain more precise volume delta information than methods using only the chart's timeframe.
Intrabar precision calculation depends on the chart's timeframe:
CVD is good to use together with open interest, volume and price change.
For example if CVD is rising and price makes good move up in short period and volume is rising and open interest makes good move up in short period and before was flat market it is show big chance to pump.
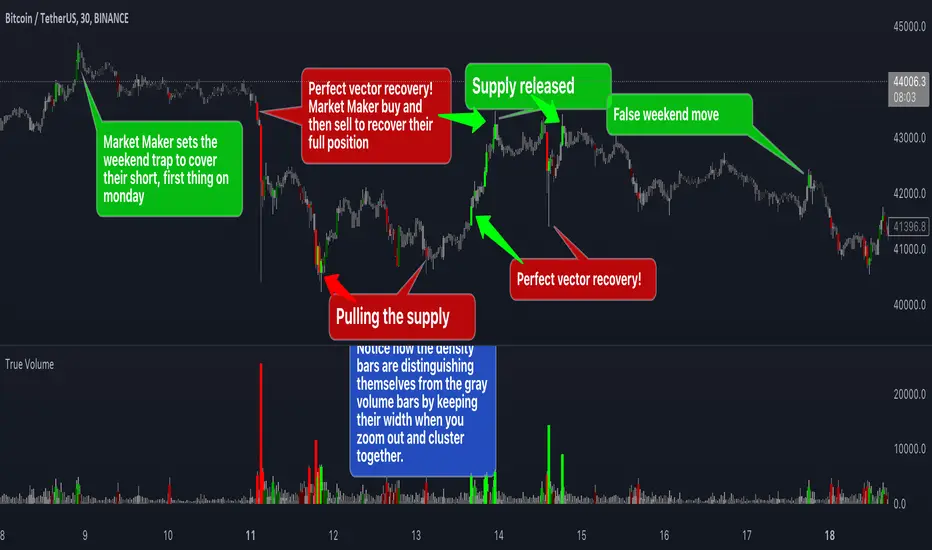
True VolumeThis indicator is designed to provide in-depth analysis of volume data from multiple sources and distinguish highly liquid candles by measuring the density of the volume. By focusing on the density and concentration of volume, rather than just the volume itself, it offers a more nuanced view of the market. This can be particularly beneficial in markets like cryptocurrencies, where understanding the role of market makers versus retail traders is crucial for strategic trading.
This is how it works:
Multiple Asset Integration:
Unlike standard volume indicators, True Volume allows the inclusion of up to four different assets (or the same asset from various exchanges) into its volume calculations. This feature provides a broader and more accurate total volume representation, essential in markets like cryptocurrencies where volume is dispersed across multiple exchanges.
Adjustable Time Anchors:
It offers various time anchor options, allowing traders to analyze volume data over different time periods or a specific amount of lookback candles. This flexibility helps in understanding volume trends over both short and long-term time frames.
Volume Density Analysis:
The core of this indicator is the innovative concept of Volume Density. It's calculated using a sigmoid function that normalizes the volume-to-price movement ratio in a unique way without needing a max cap or having the density column spike off the chart. This method helps in distinguishing between normal volume fluctuations and those that are unusually dense for the given price movement. This distinction is key in identifying potential market maker activities.
The Visuals:
The Volume Density is displayed in a unique way without compromising the original volume bars or cap the density. Infinite density can essentially be represented without having an infinitely large bar or caping out the density data. There's also two different color themes, optional bar color, and an option to flip the density bars up-side down for a different representation. Each of the original volume sources can be displayed separately as well. All colors as customizable as well for your own preference.
Price Volume Trend (PVT):
Included in this indicator is also the Price Volume Trend, which cumulatively measures the density delta, offering insights into the longer-term momentum of the market.
How do I trade it?
This indicator aims to give you insight into 'the other side of the trade', the Market Makers. When you buy, they provide liquidity by selling to you. That drives the Volume Density up.
Consider whether the market maker is currently long or short and might need to cover their position by wicking price back, or "adjust inventory". Especially towards the end of a market session.
Consider dense candles during market gaps or weekends to be market manipulation moves.
The density also goes up when stop losses are hit. If price makes a higher high or lower low, high density could indicate a liquidation event.
SaAy New Volume ComputationOverview of the Indicator
The "SaAy New Volume Computation" is a trading tool designed to give traders a clear understanding of market volume movements. It overlays on the main trading chart, providing insights into buying and selling pressures.
Key Features of the Indicator
Up and Down Volume Analysis
Buying Pressure (Up Volume) : This metric totals the trading volume on days when the market closes higher than it opens, indicating a bullish or positive market sentiment.
Selling Pressure (Down Volume) : Conversely, this measures the trading volume on days when the market closes lower than it opens, reflecting a bearish or negative sentiment.
Comparative Volume Analysis
Average Volume Comparison : The indicator also compares recent trading volume with the average volume over a set period. This comparison helps identify whether the current trading volume is unusually high or low compared to normal conditions.
Practical Use for Traders
Market Sentiment Understanding : By analyzing the up and down volumes, traders can get a sense of whether the market is dominated by buyers (bulls) or sellers (bears).
Volume Trend Identification: Comparing current trading volumes with the average volume can help traders spot trends or significant changes in market activity. For example, a higher than average volume on a day with rising prices might suggest strong buying interest and a possible continuation of the upward trend.
Conclusion
Overall, the "SaAy New Volume Computation" indicator is a valuable tool for traders. It simplifies the complex task of volume analysis, providing easy-to-understand metrics that indicate market trends and trader sentiment. This can help traders make more informed decisions and better understand the dynamics of the markets they are trading in.

Volume Profile PlusThis indicator provides a high-resolution and high-precision implementation of Volume Profile with flexible range settings. Its key features include:
1. Support for a high resolution of up to 2,500 rows.
2. Capability to examine lower timeframe bars (default 5,000 intra-bars) for enhanced precision.
3. Three range modes — "Visible Range", "Anchored Range", and "All Range".
4. Highlighting of Point of Control and Value Area.
5. Extensive customization options allowing users to configure dimensions, on-chart placements, and color schemes.
🔵 Settings
The settings screen, along with the explanations for each setting, is provided below:
🔵 High Resolution using Polyline
Inspired by @fikira, this indicator utilizes the newly introduced `polyline` type in PineScript to plot the volume profile. It employs a single polyline instance to represent the entire histogram. With each polyline instance supporting up to 10,000 points and each histogram row requiring 4 points, this indicator can accommodate 2500 rows, resulting in a significantly higher resolution compared to conventional volume profile indicators that use `line`s or `box`es to draw the histogram.
🔵 High Precision Data-binning using Lower Timeframe Data
Conventional volume profile indicators often face one or both of the following limitations:
1. They only consider volume within the chart's current timeframe.
2. They assign each bar's total volume to a single price bucket based on the bar's average price, rather than distributing volume across multiple price buckets.
As a result, when the number of bars in the chart is low, those indicators may provide imprecise results, making it difficult to accurately identify significant volume nodes and the point of control.
To address these limitations and enhance accuracy, this indicator examines data from lower timeframes and distributes the volume to fine-grained price buckets. It intelligently selects an appropriate lower timeframe to ensure precise output while complying with a maximum specified number of bars to maintain good performance.
🔵 Three Range Modes
This indicator offers users the flexibility to choose from three range modes:
1. Visible Range (Default Mode): In this mode, the volume profile calculation begins at the time of the left-most bar displayed in the current viewport. As the user scrolls through the viewport, the volume profile updates automatically.
2. Anchored Range: This mode allows the user to set the start time either by using the datetime input boxes or by dragging the anchor line on the chart.
3. All Range: In this mode, the volume profile calculation is based on all the historical bars available in the chart.

YD_Volume_Alert"YD_Volume_Alert" is a simple alert based on the increasing volume.
Although it is a simple indicator, strategies to determine accumulation and distribution can be developed using this indicator, which will also be published as well.
📌 Usage, Details and Alert
Using this indicator is simple.
You can enter two scales, "Increased Percentage 1 (%)" and "Increased Percentage 2 (%)", with default values set to 200% and 500%.
Signals are displayed in green and red triangles at the bottom of the bar, also printed with the text "Increased Volume" and "Hugely increased Volume".
Alerts are provided as a combination of the chart's symbol and the set percentage. For example,
"BINANCE:BTCUSDT.P 's Volume : 200% increased."
===========================================================
"YD_Volume_Alert" 는 거래량 증가에 따른 얼러트를 제공하는 간단한 지표입니다.
간단한 지표이지만 위 지표를 이용하여 매집과 매도의 타이밍으로 이용하는 전략 또한 개발할 수 있으며, 이 역시도 퍼블리시 할 예정입니다.
📌 사용 예시와 알림 설정
지표를 사용하는 방법은 간단합니다.
"Increased Percentage 1 (%)" 과 "Increased Percentage 2 (%)" 두 가지의 배율을 입력할 수 있으며, 기본값은 200%와 500%로 설정되어 있습니다.
시그널은 바 하단에 초록색, 빨간색 삼각형으로 각각 표시되며, "Increased Volume"과 "Hugely increased Volume"이라는 텍스트가 함께 출력됩니다.
얼러트는 자신이 설정한 차트의 심볼과 설정한 퍼센티지의 조합으로 제공되며 예를 들면 다음과 같습니다.
"BINANCE:BTCUSDT.P 's Volume : 200% increased."

improved volumeIt is an indicator that displays the trading volume.
Red-colored candle bars indicate a decrease in trading volume.
Green-colored candle bars indicate an increase in trading volume.
The transparent yellow cloud above the volume bars represents the 21-bar moving average volume, which shows the average volume over the specified period. (You can change the number of bars and the type of moving average from the indicator settings.)
This allows for easier comparison between the current trading volume and the average volume.
In the price scale section, there are 4 target levels. They represent the following in ascending order: Average volume, Average volume multiplied by 2, Average volume multiplied by 3, Average volume multiplied by 4.
Additionally, you can use the alarm feature based on these average volume levels.

Volume and vPOC InsightsThe vPOC or volume point of control shows where most of the volume was traded. This is important because this is where the institutions and market makers have opened their positions, and these are the ones that move the markets!
This indicator is designed to cut through the volume noise, and enable the hiding of lower volume data.
The main setting allows you to define a lookback, and obscure the candles whose volume is less than x % of the highest volume in this lookback.
Of the remaining candles, their vPOC will be displayed. There are extra settings to extend naked vPOCs, as well as the highs and lows of these high volume candles, plus an EMA based on the vPOC price levels.
I must credit quantifytools @quantifytools who allowed me to utilize his code, for finding vPOCs using lower timeframe candles - there are comments in the code also. It works perfectly so why reinvent the wheel?
