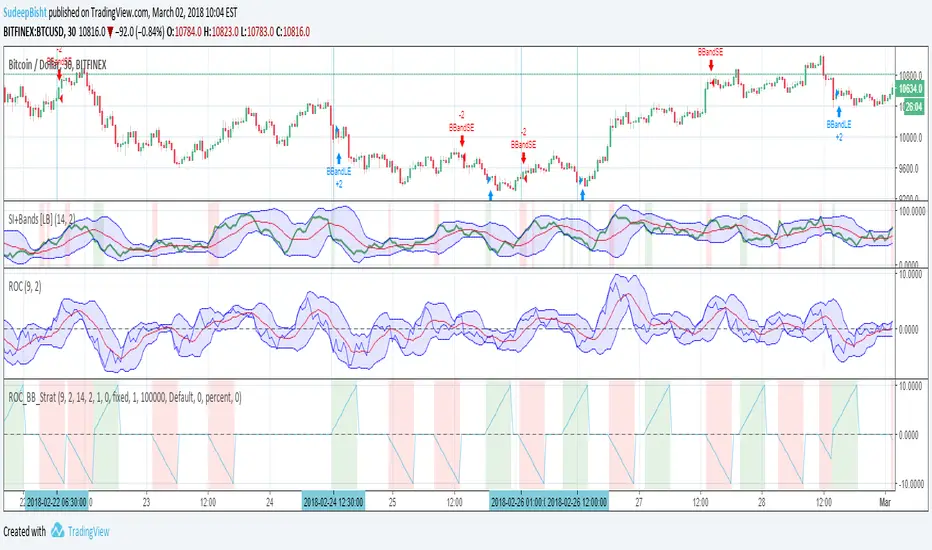
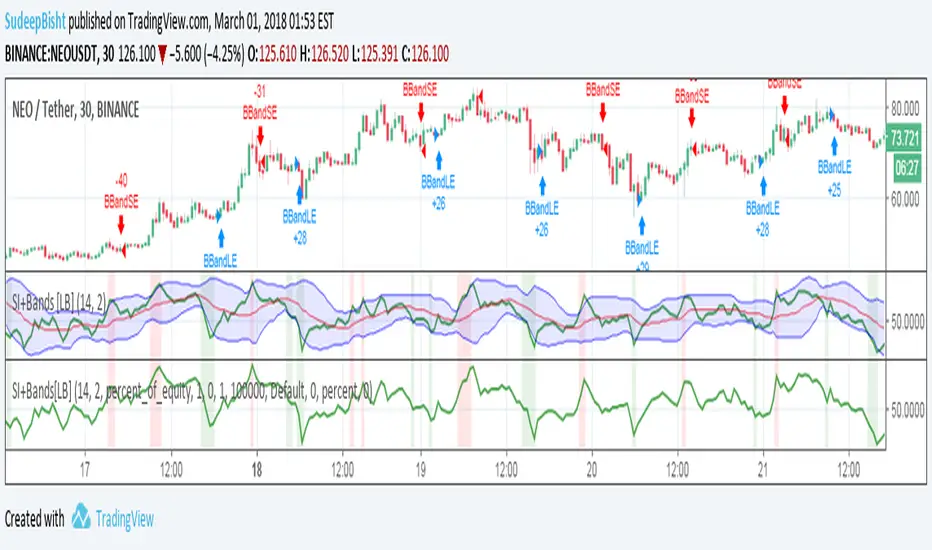
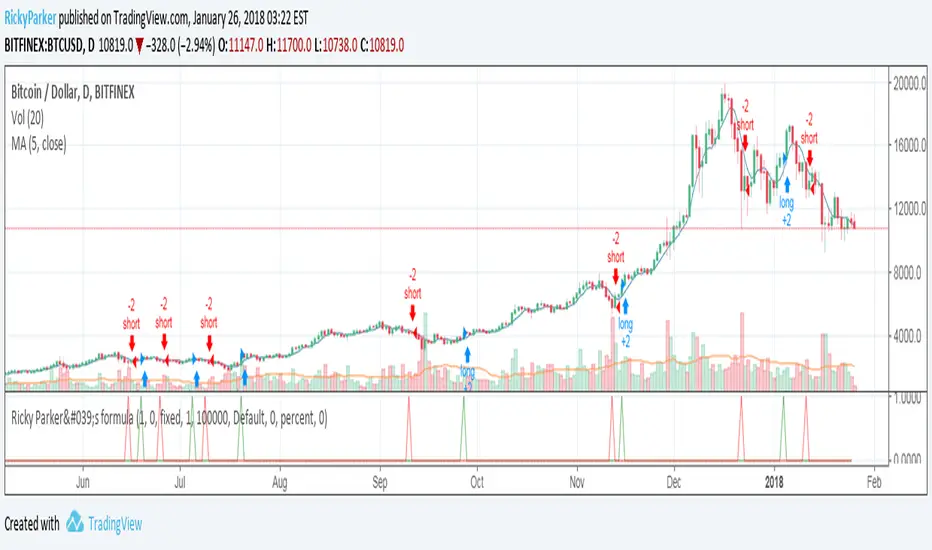
SB_Variable_Resistance Version 1.0It is a simple test strategy.
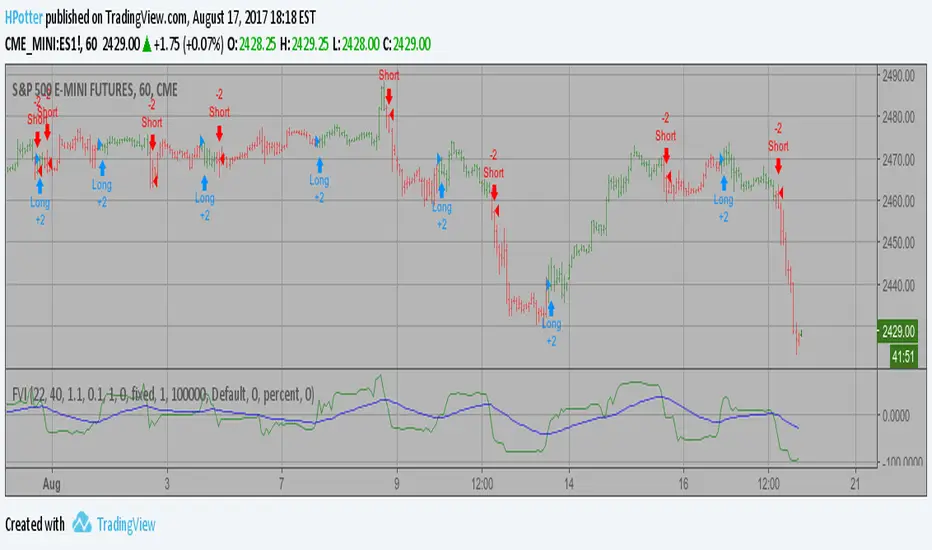
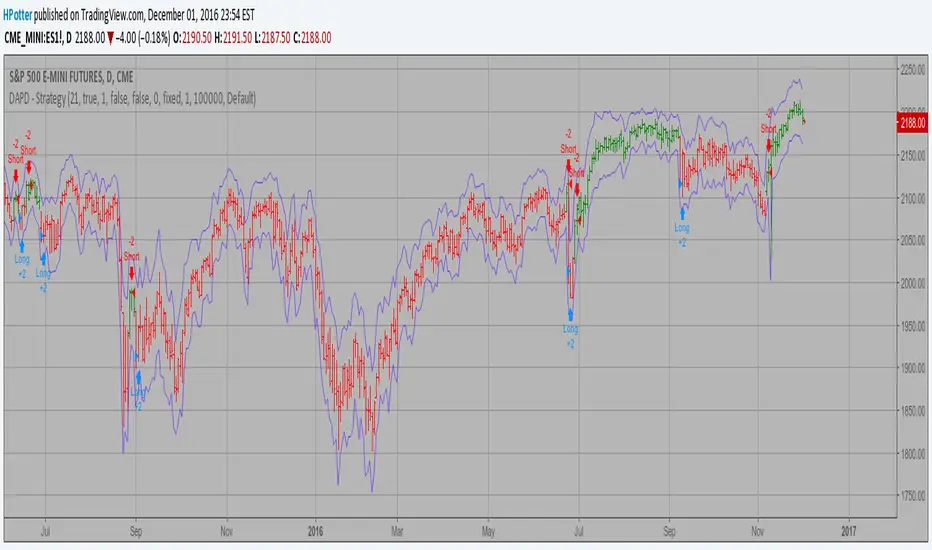
The strategy involves variable resistance.
If the price closes above the resistance a long order is placed and when price closes below the resistance a short order is placed.
Comment the perfect combination of indicators for it and will try to incorporate those indicators into it in the next version.
Message if you think of any modifications/ enhancements/ any opportunities. :)
Donations/Tips... :) -
BTC: 1BjswGcRR6c23pka7qh5t5k56j46cuyyy2
ETH: 0x64fed71c9d6c931639c7ba4671aeb6b05e6b3781
LTC: LKT2ykQ8QSzzfTDB6Tnsf12xwYPjgq95h4
Strategi Pine Script®