Long Trend Linelong trend lines How to Use:
Open TradingView and go to the chart you want to add the trendline to.
In the top menu, click on Pine Editor.
Copy and paste the script into the editor.
Click Add to Chart.
This will display a long trend line between your specified points.
Feel free to modify this script for your needs, and let me know if you'd like more advanced features!
Garis-Garis Tren

[GrandAlgo] ATR Trend MatrixThe ATR Trend Matrix is a dynamic trendline indicator designed to help traders visualize market structure using ATR-based trend projections. This tool adapts to price action and highlights potential support and resistance zones based on Average True Range (ATR) calculations.
Key Features
ATR-Based Trendlines – Calculates and plots dynamic trendlines using an adjustable ATR factor.
Multi-Level Matrix System – Provides up to four matrix levels, each customizable with different ATR multipliers.
Swing High & Low Detection – Automatically detects market pivots to serve as anchor points for trendlines.
Adjustable Trend Length – Fine-tune the sensitivity of trendlines using the Swing Length and Trend-Line Length Multiplier.
Auto-Adjustment Mode – When enabled, trendlines update dynamically as ATR evolves.
Buy & Sell Signals – Marks potential trade setups when price crosses below or above Matrix Level 1.
How It Works
Detects Swing Points – Identifies key highs and lows in the market using the length setting.
Plots ATR-Based Trendlines – Calculates trendlines using ATR with user-defined multipliers for four matrix levels.
Adjusts Dynamically – If Auto Adjust is enabled, trendlines shift with ATR movements.
Identifies Trade Signals – Highlights potential buy/sell zones when price interacts with Matrix Level 1 trendlines.
Manages Active Trendlines – Automatically updates and removes trendlines based on price interaction.
User Settings
General Settings
ATR Factor – Controls the ATR multiplier for trendline calculation.
Swing Length – Defines the number of bars for swing high/low detection.
Trend-Line Length Multiplier – Adjusts the extension length of trendlines.
Auto Adjust Trendlines – Enables real-time adjustment of trendlines as ATR changes.
Matrix Settings
Matrix Level 1-4 – Enable or disable individual trendline levels.
Matrix Factors – Customize the ATR multipliers for each matrix level.
Trading Applications
Trend Confirmation – Use the primary trendline and matrix levels to gauge trend strength.
Support & Resistance Zones – ATR-based trendlines can act as dynamic support/resistance.
Breakout & Rejection Signals – Identify potential breakouts or reversals when price interacts with matrix levels.
Volatility-Based Trading – ATR helps adjust trendlines based on market volatility.
The ATR Trend Matrix is a powerful tool for traders who want a dynamic, adaptive trendline system that reacts to market structure and volatility. With customizable settings, multi-level ATR projections, and trade signal detection, this indicator provides a comprehensive approach to price action analysis.

MEMEQUANTMEMEQUANT
This script is a comprehensive and specialized tool designed for tracking trends and money flow within meme coins and DEX tokens. By combining various features such as trend lines, Fibonacci levels, and category-based indices, it helps traders make informed decisions in highly volatile markets.
Key Features:
1. Category-Based Indices:
• Tracks the performance of token categories like:
• AI Agent Tokens
• AI Tokens
• Animal Tokens
• Murad Picks
• Each category consists of leader tokens, which are selected based on their higher market cap and trading volume. These tokens act as benchmarks for their respective categories.
• Visualizes category indices in a line chart to identify trends and compare money flow between categories.
2. Fibonacci Correction Zones:
• Highlights key retracement levels (e.g., 60%, 70%, 80%).
• These levels are crucial for identifying potential reversal zones, commonly observed in meme coin trading patterns.
• Fully customizable to match individual trading strategies.
3. Trend Lines:
• Automatically detects major support and resistance levels.
• Separates long-term and short-term trend lines, allowing traders to focus on significant price movements.
4. Enhanced Info Table:
• Provides real-time insights, including:
• % Distance from All-Time High (ATH)
• Current Trading Volume
• 50-bar Average Volume
• Volume Change Percentage
• Displays information in an easy-to-read table on the chart.
5. Customizable Settings:
• Users can adjust transparency, colors, and ranges for Fibonacci zones, trend lines, and the table.
• Enables or disables individual features (e.g., Fibonacci, trend lines, table) based on preferences.
How It Works:
1. Tracking Money Flow Across Categories:
• The script calculates the market cap to volume ratio for each category of tokens to help identify the dominant trend.
• A higher ratio indicates greater liquidity and stability, while a lower ratio suggests higher volatility or price manipulation.
2. Identifying Retracement Patterns:
• Leverages common retracement behaviors (e.g., 70% correction levels) observed in meme coins to detect potential reversal zones.
• Combines this with trend line analysis for additional confirmation.
3. Leader Tokens as Indicators:
• Each category is represented by its leader tokens, which have historically higher liquidity and market cap. This allows the script to accurately reflect the overall trend in each category.
When to Use:
• Trend Analysis: To identify which category (e.g., AI Tokens or Animal Tokens) is leading the market.
• Reversal Zones: To spot potential support or resistance levels using Fibonacci zones.
• Money Flow: To understand how capital is moving across different token categories in real time.
Who Is This For?
This script is tailored for:
• Traders specializing in meme coins and DEX tokens.
• Those looking for an edge in trend-based trading by analyzing market cap, volume, and retracement levels.
• Anyone aiming to track money flow dynamics between different token categories.
Future Updates:
This is the initial version of the script. Future updates may include:
• Support for additional token categories and DEX data.
• More advanced pattern recognition and alerts for volume and price anomalies.
• Enhanced visualization for historical data trends.
With this tool, traders can combine money flow analysis with the 60-70% retracement strategy, turning it into a powerful assistant for navigating the fast-paced world of meme coins and DEX tokens.
This script is designed to provide meaningful insights and practical utility for traders, adhering to TradingView’s standards for originality, clarity, and user value.

Market StructureThis is an advanced, non-repainting Market Structure indicator that provides a robust framework for understanding market dynamics across any timeframe and instrument.
Key Features:
- Non-repainting market structure detection using swing highs/lows
- Clear identification of internal and general market structure levels
- Breakout threshold system for structure adjustments
- Integrated multi-timeframe compatibility
- Rich selection of 30+ moving average types, from basic to advanced adaptive variants
What Makes It Different:
Unlike most market structure indicators that repaint or modify past signals, this implementation uses a fixed-length lookback period to identify genuine swing points.
This means once a structure level or pivot is identified, it stays permanent - providing reliable signals for analysis and trading decisions.
The indicator combines two layers of market structure:
1. Internal Structure (lighter lines) - More sensitive to local price action
2. General Structure (darker lines) - Shows broader market context
Technical Details:
- Uses advanced pivot detection algorithm with customizable swing size
- Implements consecutive break counting for structure adjustments
- Supports both close and high/low price levels for breakout detection
- Includes offset option for better visual alignment
- Each structure break is validated against multiple conditions to prevent false signals
Offset on:
Offset off:
Moving Averages Library:
Includes comprehensive selection of moving averages, from traditional to advanced adaptive types:
- Basic: SMA, EMA, WMA, VWMA
- Advanced: KAMA, ALMA, VIDYA, FRAMA
- Specialized: Hull MA, Ehlers Filter Series
- Adaptive: JMA, RPMA, and many more
Perfect for:
- Price action analysis
- Trend direction confirmation
- Support/resistance identification
- Market structure trading strategies
- Multiple timeframe analysis
This open-source tool is designed to help traders better understand market dynamics and make more informed trading decisions. Feel free to use, modify, and enhance it for your trading needs.

Linear Regression Channel [TradingFinder] Existing Trend Line🔵 Introduction
The Linear Regression Channel indicator is one of the technical analysis tool, widely used to identify support, resistance, and analyze upward and downward trends.
The Linear Regression Channel comprises five main components : the midline, representing the linear regression line, and the support and resistance lines, which are calculated based on the distance from the midline using either standard deviation or ATR.
This indicator leverages linear regression to forecast price changes based on historical data and encapsulates price movements within a price channel.
The upper and lower lines of the channel, which define resistance and support levels, assist traders in pinpointing entry and exit points, ultimately aiding better trading decisions.
When prices approach these channel lines, the likelihood of interaction with support or resistance levels increases, and breaking through these lines may signal a price reversal or continuation.
Due to its precision in identifying price trends, analyzing trend reversals, and determining key price levels, the Linear Regression Channel indicator is widely regarded as a reliable tool across financial markets such as Forex, stocks, and cryptocurrencies.
🔵 How to Use
🟣 Identifying Entry Signals
One of the primary uses of this indicator is recognizing buy signals. The lower channel line acts as a support level, and when the price nears this line, the likelihood of an upward reversal increases.
In an uptrend : When the price approaches the lower channel line and signs of upward reversal (e.g., reversal candlesticks or high trading volume) are observed, it is considered a buy signal.
In a downtrend : If the price breaks the lower channel line and subsequently re-enters the channel, it may signal a trend change, offering a buying opportunity.
🟣 Identifying Exit Signals
The Linear Regression Channel is also used to identify sell signals. The upper channel line generally acts as a resistance level, and when the price approaches this line, the likelihood of a price decrease increases.
In an uptrend : Approaching the upper channel line and observing weakness in the uptrend (e.g., declining volume or reversal patterns) indicates a sell signal.
In a downtrend : When the price reaches the upper channel line and reverses downward, this is considered a signal to exit trades.
🟣 Analyzing Channel Breakouts
The Linear Regression Channel allows traders to identify price breakouts as strong signals of potential trend changes.
Breaking the upper channel line : Indicates buyer strength and the likelihood of a continued uptrend, often accompanied by increased trading volume.
Breaking the lower channel line : Suggests seller dominance and the possibility of a continued downtrend, providing a strong sell signal.
🟣 Mean Reversion Analysis
A key concept in using the Linear Regression Channel is the tendency for prices to revert to the midline of the channel, which acts as a dynamic moving average, reflecting the price's equilibrium over time.
In uptrends : Significant deviations from the midline increase the likelihood of a price retracement toward the midline.
In downtrends : When prices deviate considerably from the midline, a return toward the midline can be used to identify potential reversal points.
🔵 Settings
🟣 Time Frame
The time frame setting enables users to view higher time frame data on a lower time frame chart. This feature is especially useful for traders employing multi-time frame analysis.
🟣 Regression Type
Standard : Utilizes classical linear regression to draw the midline and channel lines.
Advanced : Produces similar results to the standard method but may provide slightly different alignment on the chart.
🟣 Scaling Type
Standard Deviation : Suitable for markets with stable volatility.
ATR (Average True Range) : Ideal for markets with higher volatility.
🟣 Scaling Coefficients
Larger coefficients create broader channels for broader trend analysis.
Smaller coefficients produce tighter channels for precision analysis.
🟣 Channel Extension
None : No extension.
Left: Extends lines to the left to analyze historical trends.
Right : Extends lines to the right for future predictions.
Both : Extends lines in both directions.
🔵 Conclusion
The Linear Regression Channel indicator is a versatile and powerful tool in technical analysis, providing traders with support, resistance, and midline insights to better understand price behavior. Its advanced settings, including time frame selection, regression type, scaling options, and customizable coefficients, allow for tailored and precise analysis.
One of its standout advantages is its ability to support multi-time frame analysis, enabling traders to view higher time frame data within a lower time frame context. The option to use scaling methods like ATR or standard deviation further enhances its adaptability to markets with varying volatility.
Designed to identify entry and exit signals, analyze mean reversion, and assess channel breakouts, this indicator is suitable for a wide range of markets, including Forex, stocks, and cryptocurrencies. By incorporating this tool into your trading strategy, you can make more informed decisions and improve the accuracy of your market predictions.

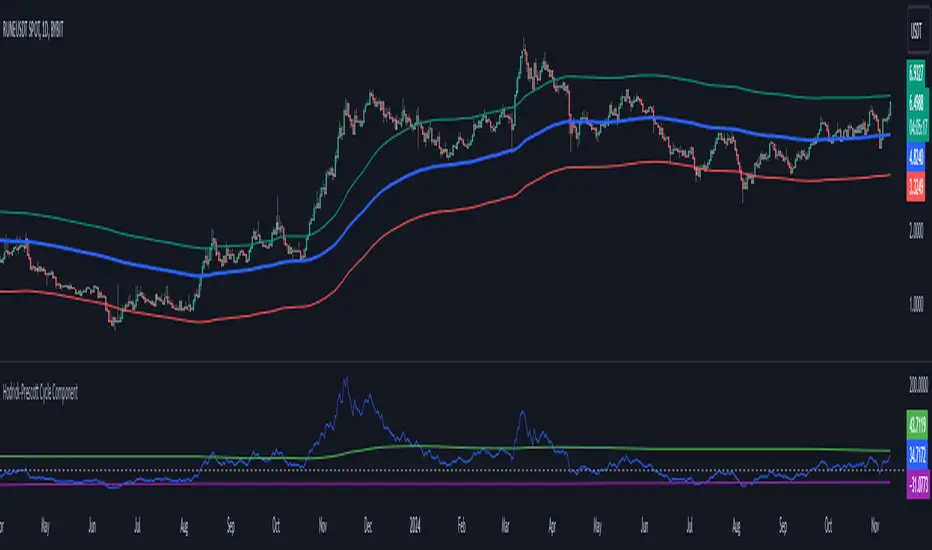
Hodrick-Prescott Cycle Component (YavuzAkbay)The Hodrick-Prescott Cycle Component indicator in Pine Script™ is an advanced tool that helps traders isolate and analyze the cyclical deviations in asset prices from their underlying trend. This script calculates the cycle component of the price series using the Hodrick-Prescott (HP) filter, allowing traders to observe and interpret the short-term price movements around the long-term trend. By providing two views—Percentage and Price Difference—this indicator gives flexibility in how these cyclical movements are visualized and interpreted.
What This Script Does
This indicator focuses exclusively on the cycle component of the price, which is the deviation of the current price from the long-term trend calculated by the HP filter. This deviation (or "cycle") is what traders analyze for mean-reversion opportunities and overbought/oversold conditions. The script allows users to see this deviation in two ways:
Percentage Difference: Shows the deviation as a percentage of the trend, giving a normalized view of the price’s distance from its trend component.
Price Difference: Shows the deviation in absolute price terms, reflecting how many price units the price is above or below the trend.
How It Works
Trend Component Calculation with the HP Filter: Using the HP filter, the script isolates the trend component of the price. The smoothness of this trend is controlled by the smoothness parameter (λ), which can be adjusted by the user. A higher λ value results in a smoother trend, while a lower λ value makes it more responsive to short-term changes.
Cycle Component Calculation: Percentage Deviation (cycle_pct) calculated as the difference between the current price and the trend, divided by the trend, and then multiplied by 100. This metric shows how far the price deviates from the trend in relative terms. Price Difference (cycle_price) simply the difference between the current price and the trend component, displaying the deviation in absolute price units.
Conditional Plotting: The user can choose to view the cycle component as either a percentage or a price difference by selecting the Display Mode input. The indicator will plot the chosen mode in a separate pane, helping traders focus on the preferred measure of deviation.
How to Use This Indicator
Identify Overbought/Oversold Conditions: When the cycle component deviates significantly from the zero line (shown with a dashed horizontal line), it may indicate overbought or oversold conditions. For instance, a high positive cycle component suggests the price may be overbought relative to the trend, while a large negative cycle suggests potential oversold conditions.
Mean-Reversion Strategy: In mean-reverting markets, traders can use this indicator to spot potential reversal points. For example, if the cycle component shows an extreme deviation from zero, it could signal that the price is likely to revert to the trend. This can help traders with entry and exit points when the asset is expected to correct back toward its trend.
Trend Strength and Cycle Analysis: By comparing the magnitude and duration of deviations, traders can gauge the strength of cycles and assess if a new trend might be forming. If the cycle component remains consistently positive or negative, it may indicate a persistent market bias, even as prices fluctuate around the trend.
Percentage vs. Price Difference Views: Use the Percentage Difference mode to standardize deviations and compare across assets or different timeframes. This is especially helpful when analyzing assets with varying price levels. Use the Price Difference mode when an absolute deviation (price units) is more intuitive for spotting overbought/oversold levels based on the asset’s actual price.
Using with Hodrick-Prescott: You can also use Hodrick-Prescott, another indicator that I have adapted to the Tradingview platform, to see the trend on the chart, and you can also use this indicator to see how far the price is deviating from the trend. This gives you a multifaceted perspective on your trades.
Practical Tips for Traders
Set the Smoothness Parameter (λ): Adjust the λ parameter to match your trading timeframe and asset characteristics. Lower values make the trend more sensitive, which might suit short-term trading, while higher values smooth out the trend for long-term analysis.
Cycle Component as Confirmation: Combine this indicator with other momentum or trend indicators for confirmation of overbought/oversold signals. For example, use the cycle component with RSI or MACD to validate the likelihood of mean-reversion.
Observe Divergences: Divergences between price movements and the cycle component can indicate potential reversals. If the price hits a new high, but the cycle component shows a smaller deviation than previous highs, it could signal a weakening trend.
Stochastic Trendlines with Breakouts [Jamshid] - EnhancedStochastic Trendlines with Breakouts - Enhanced Version
This advanced Stochastic Trendlines with Breakouts script combines several powerful features to provide enhanced breakout detection based on the Stochastic Oscillator and additional confirmation signals. This script is designed to help traders identify key trend reversals, breakout points, and pivot levels with more accuracy by integrating advanced filters such as RSI confirmation, moving average trend filtering, volatility filtering, divergence detection, and multi-timeframe analysis.
Key Features:
Stochastic Oscillator-Based Breakouts:
Automatically detects breakouts based on the smoothed Stochastic Oscillator values (%K and %D), providing insights into overbought and oversold conditions.
Customizable overbought and oversold levels, with a mid-level (50) line for additional reference.
Trendlines on Pivot Points:
Automatically plots dynamic trendlines based on pivot highs and lows of the smoothed Stochastic %K, helping to visualize potential reversal points.
RSI Confirmation (Optional):
Filters breakout signals using the Relative Strength Index (RSI) to confirm breakouts only when the RSI is below 50 for downtrend breakouts and above 50 for uptrend breakouts.
Visual confirmation with a green "RSI Conf." label displayed on the chart when the RSI condition is met.
Moving Average Filter (Optional):
Confirms breakout signals in the direction of a user-defined Moving Average (MA) to trade in the overall market trend direction.
MA length is fully customizable.
Stochastic Divergence Filter (Optional):
Detects bullish or bearish divergence between the price and Stochastic Oscillator values, adding an extra layer of confirmation.
Multi-Timeframe Confirmation (Optional):
Confirms breakouts by checking the Stochastic %K and %D values from a higher timeframe. This helps in avoiding false signals by aligning with the broader market trend.
The higher timeframe can be customized to any timeframe (e.g., daily, weekly, etc.).
Volatility Filter (Optional):
Uses the ATR (Average True Range) to filter out breakouts during periods of low volatility, ensuring signals are only triggered when there is sufficient price movement.
ATR length and multiplier are fully customizable.
Custom Alerts:
Alerts are available for new trendline detections (both pivot high and pivot low) and for confirmed breakout signals. These alerts help traders stay informed in real-time without needing to monitor the chart continuously.
How to Use:
Customize the Stochastic Oscillator settings, such as %K smoothing and %D line parameters, to fit your trading strategy.
Enable or disable additional filtering features (RSI, MA, divergence, MTF, volatility) as needed.
Set up alerts for specific breakout conditions directly in TradingView to stay notified when breakout signals are triggered.
This script is designed for traders who are looking for precision breakout signals with added layers of confirmation to avoid false breakouts and enhance trading accuracy.

Dynamic Touch Trendlines [QuantVue]The Dynamic Touch Trendlines (DTT) indicator automatically draws and manages trendlines on your chart, helping traders identify key support and resistance levels.
What sets the DTT indicator apart from other trendline indicators is its ability to let traders customize the number of touches required to validate a trendline. This flexibility allows you to fine-tune the indicator for different markets or trading styles, ensuring only strong trendlines with the specified number of touches are considered valid.
This indicator features both uptrend lines (drawn from pivot lows) and downtrend lines (drawn from pivot highs), making it suitable for detecting bullish and bearish trends.
An uptrend line connects three (default setting) or more significant lows, showing where price has historically found support. Traders often look for price to bounce off this line during pullbacks in an uptrend.
When price breaks below an uptrend line, it suggests a weakening of the bullish trend. This could mean that buyers are losing strength, and the market may be transitioning into a bearish phase, providing a potential opportunity for traders to enter short positions or exit long positions.
Conversely, a downtrend line connects three (default setting) or more significant highs, indicating potential resistance in a downtrend. Price action below this line can signal continued bearish momentum.
When price breaks above a downtrend line, it indicates a potential reversal of the bearish trend. This can signal the end of selling pressure and the beginning of a new bullish phase, offering traders a potential opportunity to enter long positions.
Key settings:
Minimum Touches: This sets the number of price touches required to validate a trendline. Increasing the minimum touches filters out weaker trends, ensuring that only more reliable trendlines are drawn.
Buffer: The buffer is used to account for minor price overshoots or near misses relative to the trendline. It creates a margin around the trendline, allowing price to come close to the line—whether it overshoots slightly or falls just short—and still count as a valid touch. This helps ensure that small price fluctuations or market noise don’t prevent valid trendline touches from being recognized, making the trendlines more reliable.
Trendline Break Source: Allows traders to define how a trendline is considered broken—either based on the close of the price bar or the wicks (highs and lows) of the price action.
The DTT indicator also features alerts whenever a new trendline is detected or an existing trendline is broken!
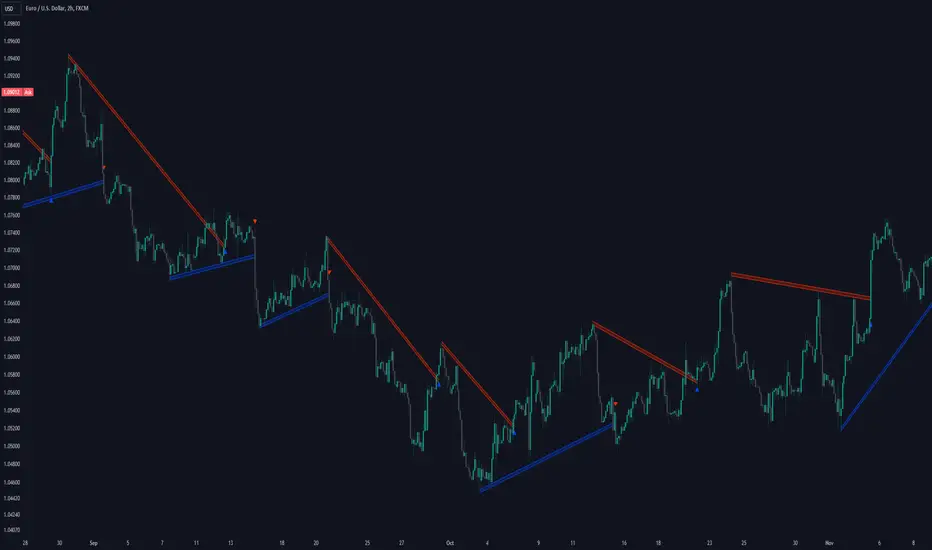
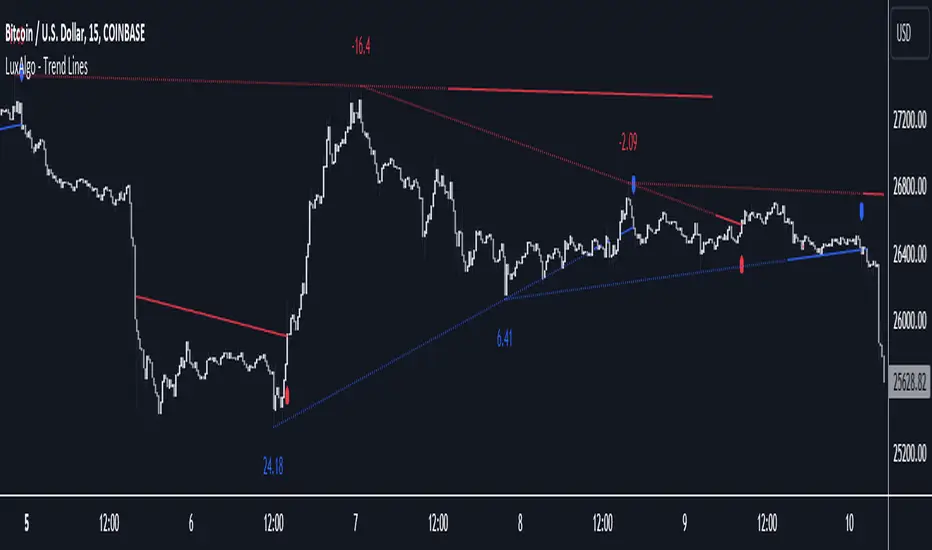
Trend LinesThis script, titled "Trend Lines," is designed to detect and plot significant trend lines on a TradingView chart, based on pivot points. It highlights both uptrend and downtrend lines using different colors and allows customization of line styles, including color and thickness. Here's a breakdown of how the script works:
Inputs
Left Bars (lb) and Right Bars (rb): These inputs determine the number of bars to the left and right of a pivot point used to identify significant highs and lows.
Show Pivot Points: A boolean input to display markers at detected pivot points on the chart.
Show Old Line as Dashed: A boolean input to display older trend lines as dashed for visual distinction.
Uptrend Line Color (ucolor) and Downtrend Line Color (dcolor): Color inputs to customize the appearance of uptrend and downtrend lines.
Uptrend Line Thickness (uthickness) and Downtrend Line Thickness (dthickness): Inputs to adjust the thickness of the trend lines.
Calculations
Pivot Highs and Lows: The script calculates potential pivot highs and lows by looking at lb bars to the left and rb bars to the right. If a bar's high is the highest (or low is the lowest) within this window, it is considered a pivot point.
Trend Lines: The script connects the most recent and previous pivot highs to form downtrend lines, and the most recent and previous pivot lows to form uptrend lines. These lines are drawn with the specified color and thickness.
Angles: The angle of each trend line is calculated to determine whether the trend is strengthening or weakening. If the trend changes significantly, the line's extension is adjusted accordingly.
Plotting
Pivot Point Markers: If Show Pivot Points is enabled, markers labeled "H" for highs and "L" for lows are plotted at the pivot points.
Trend Lines: The script draws lines between pivot points, coloring them according to the trend direction (uptrend or downtrend). If Show Old Line as Dashed is enabled, the script sets older lines to a dashed style to indicate they are no longer the most recent trend lines.
This script is useful for traders who want to visually identify key support and resistance levels based on historical price action, helping them to make more informed trading decisions. The customization options allow traders to tailor the appearance of the trend lines to suit their personal preferences or charting style.

Price Action Toolkit Lite [UAlgo]The Price Action Toolkit Lite is a comprehensive indicator designed to enhance your chart analysis with advanced price action tools. This powerful toolkit combines multiple technical analysis concepts to provide traders with a clear visualization of market structure, liquidity levels, order blocks, and trend lines. By integrating these elements, the indicator aims to offer a holistic view of price action, helping traders identify potential entry and exit points, as well as key levels of interest in the market.
🔶 Key Features
Market Structure Analysis: The indicator includes a ZigZag feature to highlight significant market highs and lows, aiding in the visualization of market structure changes and trends.
Liquidity Sweeps Detection: It identifies and displays liquidity sweeps, which are crucial for recognizing potential market reversals and areas of interest where significant price action is likely to occur.
Order Blocks: Automatically detects and draws order blocks, highlighting areas of institutional buying and selling pressure, which can serve as key support and resistance levels.
Trend Lines: The toolkit can draw and extend trend lines based on pivot points, providing a clear view of prevailing market trends and potential breakout points.
Customizable Settings: Users can adjust various settings, including the length of the ZigZag, liquidity detection sensitivity, the number of order blocks to display, and trend line detection parameters, allowing for a tailored analysis experience.
🔶 Disclaimer
The "Price Action Toolkit Lite " is intended for educational and informational purposes only.
It is not financial advice and should not be construed as such. Trading in financial markets involves substantial risk, including the risk of loss.
Past performance is not indicative of future results.
🔷 Similar Scripts

Johnny's Trend Lines, Supports and ResistancesInspired and based on ismailcarlik's Trend Lines, Supports and Resistances.
Additions include an overall upgrade to Pinescript v5, changes in the way resistance and support levels are calculated, improved visual queues, and additional customization options.
This indicator is meticulously crafted to provide traders with visual tools for identifying trend lines, support, and resistance levels, enhancing the decision-making process in trading activities.
Features and Functionality
Trend Lines: The indicator allows users to enable or disable trend lines, adjust the number of points to check for establishing a trend, and set parameters for trend validation, including the maximum violation and exceptions for the last bars.
Support and Resistance: It offers tools to identify and visualize key support and resistance levels based on recent pivot points. This includes adjustable parameters for the maximum violations allowed and the exclusion of recent bars from the analysis.
Pivot Points: Users can define the pivot length for calculating highs and lows, which helps in marking significant pivot points that are instrumental in trend analysis.
Alerts and Notifications: The indicator is equipped with customizable alerts for trend line breaches and pivot point formations, which can be set to trigger at different frequencies based on user preference.
How It Works
Input Flexibility: Users can adjust various settings like the length of trend lines and pivot points, enabling or disabling specific features like marking pivots, and managing alert settings directly from the indicator’s input panel.
Dynamic Analysis: By analyzing the price action relative to the calculated trend lines and pivot points, the indicator dynamically identifies potential trend reversals, continuations, and significant price levels.
Visualization: It plots trend lines and marks support and resistance levels directly on the chart, with options to extend these lines and add labels for better clarity. Violated trend lines can be visually differentiated by changing their style and width.
Practical Application
Trend Line Strategy: Traders can use the trend lines to determine the strength of the current market trend and to spot potential reversal points.
Support and Resistance Strategy: By marking where the price has historically faced resistance or found support, traders can plan entry and exit points, set stop-loss orders, or identify breakout opportunities.
Pivot Points Strategy: Pivot points serve as vital indicators for intraday trading or long-term trend analysis, providing insights into potential support and resistance levels.
Customization and Alerts
Custom Alerts: Traders can set alerts for when the price crosses trend lines or when new support or resistance levels are formed, helping them stay informed of critical market movements without having to continuously monitor the charts.
Visual Customization: Users can personalize the appearance of trend lines and labels, choosing from a variety of colors and styles to match their chart setup or preferences.
"Johnny's Trend Lines, Supports and Resistances" is an essential tool for traders who rely on technical analysis, offering detailed insights and real-time updates on market conditions, trend strength, and potential price barriers.

Price and Volume Breakout Buy Strategy [TradeDots]The "Price and Volume Breakout Buy Strategy" is a trading strategy designed to identify buying opportunities by detecting concurrent price and volume breakouts over a specified range of candlesticks.
This strategy is optimized for assets demonstrating high volatility and significant momentum spikes.
HOW IT WORKS
The strategy first takes the specific number of candlesticks as the examination window for both price and volume.
These values are used as benchmarks to identify breakout conditions.
A trade is initiated when both the closing price and the trading volume surpass the maximum values observed within the predetermined window.
Price must be above a designated moving average, serving as the trend indicator, ensuring that all trades align with the prevailing market trend.
APPLICATION
This strategy is particularly effective for highly volatile assets such as Bitcoin and Ethereum, capitalizing on the cues from sudden price and volume breakouts indicative of significant market movement, often driven by market smart money traders.
However, for broader markets like the S&P 500, this strategy may be less effective due to less pronounced volume and price shifts compared to the cryptocurrency markets.
DEFAULT SETUP
Commission: 0.01%
Initial Capital: $10,000
Equity per Trade: 70%
Backtest result sometimes gives fewer than 100 trades under certain higher timeframes, as most trades tend to have a long holding period. Entry conditions are also more stringent, which, combined with the relatively brief history of cryptocurrencies, results in fewer trades on longer timeframes.
Users are advised to adjust and personalize this trading strategy to better match their individual trading preferences and style.
RISK DISCLAIMER
Trading entails substantial risk, and most day traders incur losses. All content, tools, scripts, articles, and education provided by TradeDots serve purely informational and educational purposes. Past performances are not definitive predictors of future results.
Bull Bear Trend IndicatorIntroduction: Origin of the Swing Point Indicator
In the quest for a reliable indicator that accurately predicts trend directions and identifies valid highs and lows, the genesis of the Swing Point Indicator emerged. Faced with the challenge of finding a tool that provided comprehensive market analysis and actionable insights, the need for a novel solution became evident. Combining insights gleaned from market analysis and innovative algorithmic approaches, the Swing Point Indicator was born.
Enhanced Feature: Highs and Lows Labeling in Trend Direction
In addition to its core functionalities, the Swing Point Indicator incorporates an advanced feature that enhances the visualization of trend direction. This feature provides further clarity by selectively labeling highs and lows based on the prevailing trend, reinforcing the identification of higher highs and lower lows in uptrends and downtrends, respectively. Overlapping labels on highs and lows signify a potential trend change, providing traders with valuable insight into market reversals.
Detailed Description:
1. Uptrend Labeling:
- Higher Highs (Green Label with Price): In an uptrend, where higher highs are observed, the indicator labels these points with vibrant green color and includes the corresponding price value. This visually highlights the significance of higher highs as pivotal points in the upward trajectory of prices.
- Higher Lows (Red Marker without Text or Diamond): To complement the identification of higher highs, higher lows are marked with a distinct red marker or diamond, devoid of any accompanying text. While these points are crucial in delineating the ascending trend, their emphasis lies in their role as support levels, providing a foundation for upward price movements.
2. Downtrend Labeling:
- Lower Lows (Red Label with Price): Conversely, in a downtrend characterized by lower lows, the indicator labels these points with conspicuous red color, accompanied by the corresponding price value. Lower lows signify critical levels of downward price momentum, acting as indicators of potential bearish continuation.
- Lower Highs (Green Marker without Text or Diamond): Lower highs, indicative of downward retracements in a downtrend, are marked by distinctive green markers or diamonds without accompanying text. While these points denote temporary pauses or pullbacks in the bearish trend, their emphasis lies in their role as resistance levels, impeding upward price movements.
Functionality and Utility:
- Customizable Lookback Candle Count: Traders have the option to adjust the lookback candle count, which is set by default at 108 candles in the settings. This flexibility allows traders to tailor the indicator to their specific trading preferences and timeframes.
- Equal Highs or Lows Option: When enabled, the Swing Point Indicator can identify equal highs or equal lows, providing traders with additional insight into market dynamics.
- Formation Confirmation: A new higher high along with its higher low or a new lower low along with its lower high is confirmed after two candles have closed following the swing point candle. This ensures the reliability of the identified trend direction.
Conclusion:
The incorporation of selective labeling for highs and lows based on trend direction, alongside the introduction of customizable settings and formation confirmation criteria, enhances the effectiveness of the Swing Point Indicator. This feature-rich tool empowers traders with a nuanced understanding of market dynamics, highlighting critical price levels and trend reversals. By offering enhanced visualization, customizable options, and confirmation criteria, the Swing Point Indicator equips traders with the confidence and precision needed to navigate the markets successfully, contributing to more informed and profitable trading strategies.

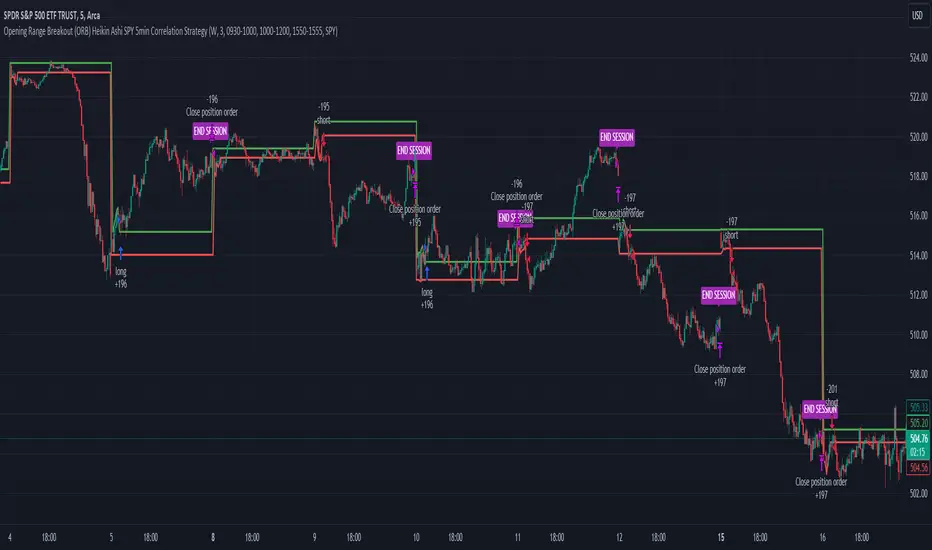
ORB Heikin Ashi SPY 5min Correlation StrategyOverview:
The ORB (Opening Range Breakout) strategy combined with Heikin Ashi candles and Relative Volume (RVOL) indicator aims to capitalize on significant price movements that occur shortly after the market opens. This strategy identifies breakouts above or below the opening range, using Heikin Ashi candles for smoother price visualization and RVOL to gauge the strength of the breakout.
Components:
Opening Range Breakout (ORB): The strategy starts by defining the opening range, typically the first few minutes of the trading session. It then identifies breakouts above the high or below the low of this range as potential entry points.
Heikin Ashi Candles: Heikin Ashi candles are used to provide a smoother representation of price movements compared to traditional candlesticks. By averaging open, close, high, and low prices of the previous candle, Heikin Ashi candles reduce noise and highlight trends more effectively.
Relative Volume (RVOL): RVOL compares the current volume of a stock to its average volume over a specified period. It helps traders identify abnormal trading activity, which can signal potential price movements.
Candle for correlation : In this case we are using SPY candles. It can also use different asset
Strategy Execution:
Initialization: The strategy initializes by setting up variables and parameters, including the ORB period, session timings, and Heikin Ashi candle settings.
ORB Calculation: It calculates the opening range by identifying the high and low prices during the specified session time. These values serve as the initial reference points for potential breakouts. For this we are looking for the first 30 min of the US opening session.
After that we are going to use the next 2 hours to check for breakout opportunities.
Heikin Ashi Transformation: Optionally, the strategy transforms traditional candlestick data into Heikin Ashi format for smoother visualization and trend identification.
Breakout Identification: It continuously monitors price movements within the session and checks if the current high breaches the ORB high or if the current low breaches the ORB low. These events trigger potential long or short entry signals, respectively.
RVOL Analysis: Simultaneously, the strategy evaluates the relative volume of the asset to gauge the strength of the breakout. A surge in volume accompanying the breakout confirms the validity of the signal. In this case we are looking for at least a 1 value of the division between currentVolume and pastVolume
Entry and Exit Conditions: When a breakout occurs and is confirmed by RVOL and is within our session time, the strategy enters a long or short position accordingly. It does not have a stop loss or a takie profit level, instead it will always exit at the end of the trading session, 5 minutes before
Position Sizing and Commissions: For the purpose of this backtest, the strategy allocated 10% of the capital for each trade and assumes a trading commission of 0.01$ per share ( twice the IBKR broker values)
Session End: At the end of the trading session, the strategy closes all open positions to avoid overnight exposure.
Conclusion:
The combination of ORB breakout strategy, Heikin Ashi candles, and RVOL provides traders with a robust framework for identifying and capitalizing on early trends in the market. By leveraging these technical indicators together, traders can make more informed decisions and improve the overall performance of their trading strategies. However, like any trading strategy, it's essential to backtest thoroughly and adapt the strategy to different market conditions to ensure its effectiveness over time.
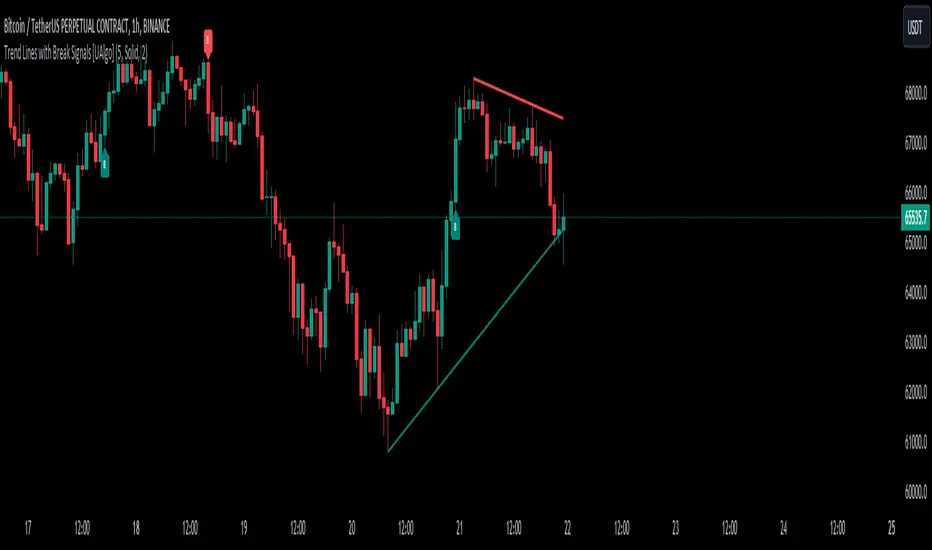
Trend Lines with Break Signals [UAlgo]🔶 Description:
The "Trend Lines with Breaks " indicator is designed to identify and visualize trend lines on a price chart, allowing traders to observe potential trend reversals or continuations. This script implements a method to draw trend lines based on pivot points (highs and lows) within a specified sensitivity range. It also provides an option to display breaks in these trend lines, aiding traders in recognizing significant market movements.
🔶 Key Features:
Trend Line Sensitivity Adjustment: Users can adjust the sensitivity of the trend lines using the "Trend Line Sensitivity" parameter, allowing customization based on market conditions and preferences.
Visualization of Trend Lines: The indicator visually represents trend lines on the chart, distinguishing between upward and downward trends. Users can customize the appearance of these trend lines, including color, style, and width.
Detection of Trend Line Breaks: Trend line breaks are identified by comparing the current price with the slope of the trend line. If the price breaks below (for bullish trend lines) or above (for bearish trend lines) the slope of the trend line, indicating a potential reversal, a "B" label is displayed on the chart. Trend line breaks are only displayed if the "showBreaks" parameter is enabled.
Before Bearish Trend Line Break :
If the price "Close" value closes above the trend line :
Before Bullish Trend Line Break :
If the price "Close" value closes below the trend line :
🔶 Disclaimer:
Not Financial Advice: This indicator is intended for educational and informational purposes only. It does not constitute financial advice or recommendations to buy, sell, or hold any financial instruments.
Use at Own Risk: Trading involves substantial risk of loss and is not suitable for all investors. Users of this indicator should exercise caution and conduct their own research and analysis before making any trading decisions.
Performance Not Guaranteed: Past performance is not indicative of future results. While the indicator aims to assist traders in analyzing market trends, there is no guarantee of accuracy or success in trading operations.
Ghost Tangent Crossings [ChartPrime]Ghost Tangent Crossings (ChartPrime) is a revolutionary way to visualize pivot points and zig-zag patterns that utilizes ellipses. This indicator makes sure that each pivot is plotted from high to low, ensuring a correct zig-zag wave pattern. Before a zig-zag is confirmed Ghost Tangent Crossings (ChartPrime) plots an estimate of the next valid move allowing you to plan well ahead of time. Once it is confirmed, the indicator will fill in the plot with a solid color and print a break label.
Unlike other zig-zag or pivot point indicators, Ghost Tangent Crossings (ChartPrime) only has a pivot lookforward input. This is because the lookback is automatically adjusted based on the last known zig-zag. This allows the indicator to dynamically look for the most recent valid market movement. The equipoint is calculated as the point along the ellipse with an equal change in price on either side. From this point we plot a line with the slope at that location and when the price breaks this level a break label is plotted. Alternatively you can plot this point as a horizontal line. This area works as support and resistance for the market as its the point where the balance in movement is found. We feel that this is a simple and elegant solution to connected zig-zag patterns that utilizes a novel method of visualization that many traders will find useful. With its simple controls and intuitive style, we believe that Ghost Tangent Crossings (ChartPrime) will find a home on most traders charts.
To use Ghost Tangent Crossings (ChartPrime) simply add it to your chart and adjust the lookforward to your taste. From there you can adjust the color of the zig-zags and enable or disable any of the visual features. We have included both wick and body pivot types to accommodate most trading style. From there, you are all done and ready to trade!
Enjoy

TrendLine Toolkit w/ Breaks (Real-Time)The TrendLine Toolkit script introduces an innovating capability by extending the conventional use of trendlines beyond price action to include oscillators and other technical indicators. This tool allows traders to automatically detect and display trendlines on any TradingView built-in oscillator or community-built script, offering a versatile approach to trend analysis. With breakout detection and real-time alerts, this script enhances the way traders interpret trends in various indicators.
🔲 Methodology
Trendlines are a fundamental tool in technical analysis used to identify and visualize the direction and strength of a price trend. They are drawn by connecting two or more significant points on a price chart, typically the highs or lows of consecutive price movements (pivots).
Drawing Trendlines:
Uptrend Line - Connects a series of higher lows. It signals an upward price trend.
Downtrend Line - Connects a series of lower highs. It indicates a downward price trend.
Support and Resistance:
Support Line - A trendline drawn under rising prices, indicating a level where buying interest is historically strong.
Resistance Line - A trendline drawn above falling prices, showing a level where selling interest historically prevails.
Identification of Trends:
Uptrend - Prices making higher highs and higher lows.
Downtrend - Prices making lower highs and lower lows.
Sideways (or Range-bound) - Prices moving within a horizontal range.
A trendline helps confirm the existence and direction of a trend, providing guidance in aligning with the prevailing market sentiment. Additionally, they are usually paired with breakout analysis, a breakout occurs when the price breaches a trendline. This signals a potential change in trend direction or an acceleration of the existing trend.
The script adapts this methodology to oscillators and other indicators. Instead of relying on price pivots, which can only be detected in retrospect, the script utilizes a trailing stop on the oscillator to identify potential swings in real-time, you may find more info about it here (SuperTrend toolkit) . We detect swings or pivots simply by testing for crosses between the indicator and its trailing stop.
type oscillator
float o = Oscillator Value
float s = Trailing Stop Value
oscillator osc = oscillator.new()
bool l = ta.crossunder(osc.o, osc.s) => Utilized as a formed high
bool h = ta.crossover (osc.o, osc.s) => Utilized as a formed low
This approach enables the algorithm to detect trendlines between consecutive pivot highs or lows on the oscillator itself, providing a dynamic and immediate representation of trend dynamics.
🔲 Breakout Detection
The script goes beyond trendline creation by incorporating breakout detection directly within the oscillator. After identifying a trendline, the algorithm continuously monitors the oscillator for potential breakouts, signaling shifts in market sentiment.
🔲 Setup Guide
A simple example on one of my public scripts, Z-Score Heikin-Ashi Transformed
🔲 Settings
Source - Choose an oscillator source of which to base the Toolkit on.
Zeroing - The Mid-Line value of the oscillator, for example RSI & MFI use 50.
Sensitivity - Calibrates the Sensitivity of which TrendLines are detected, higher values result in more detections.
🔲 Alerts
Bearish TrendLine
Bullish TrendLine
Bearish Breakout
Bullish Breakout
As well as the option to trigger 'any alert' call.
By integrating trendline analysis into oscillators, this Toolkit enhances the capabilities of technical analysis, bringing a dynamic and comprehensive approach to identifying trends, support/resistance levels, and breakout signals across various indicators.

Liquidity Trendline With Signals [BigBeluga]The Liquidity Trendline is an indicator designed to identify potential breakouts by utilizing pivot points. These pivotal moments can trigger significant market reactions, either by breaking out or by serving as breakout and retest signals.
🔶 FEATURES
The indicator contains the following features:
Period of the calculation
Padding (spacing between the 2 lines)
Signal for breakouts
🔶 USAGE
As shown in the example, breakouts can be powerful points to see reversions in the market and can lead to a lot of volatility in the market.
When a trendline is broken, a signal will be plotted; the user can disable/enable those signals.
A trendline is formed when 2 consecutive pivot points are found, each of them lower or higher than the previous one. this is the anchor point for our trend line that we will use to spot rejection or breakouts
The delay in the creation of those trend lines will be the period input used to find the pivot point on the chart.
Another good example is using these trendlines as simple retests.
Prices bouncing on top of them will suggest a possible continuation of the current trend.
We can filter out stronger breakouts by looking at how many times the price has rejected the trendline, more rejections will result in more liquidity once the price breaks it.
Signals are plotted on the chart for every breakout that happens.
Another good utility is simply using them as retest once the price breaks those levels and holding above/below them, indicating a possible support or resistance area used for confluence
Here is another good example of how we can correctly spot price deviating from our trendline and spotting powerful continuation in price.
As said before we can filter out bad and good breakouts simply by looking at how many times rejected from those levels.
More rejection will result in a stronger reaction
🔶 CONCLUSION
This script is as simple as that and can be used in a few ways to spot reversals, price continuation, or even sentiment in price (bullish or bearish).
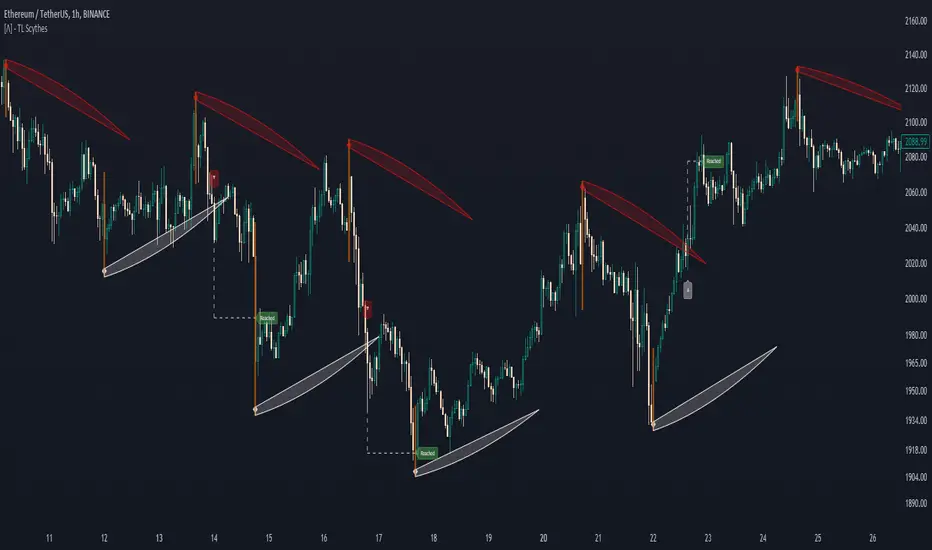
TrendLine ScythesTrendline Scythes is a script designed to automatically detect and draw special curved trendlines, resembling scythes or blades, based on pivotal points in price action. These trendlines adapt to the volatility of the market, providing a unique perspective on trend dynamics.
🔲 Methodology
Traditional trendlines connect consecutive pivot points on a price chart, providing a linear representation of trend direction. However, this script employs a distinctive methodology by automatically detecting price pivots and then calculating special curved trendlines based on the Average True Range (ATR) of the price. This introduces a curvature to the trendlines, resembling scythes, offering a unique way to interpret market trends.
🔲 Auto Breakout and Target Detection
Trendline Scythes includes features for automatic breakout detection, signaling potential trend changes. Additionally, the script assists in target detection, helping traders set realistic and data-driven profit-taking levels based on market volatility and user adjustment.
🔲 Utility
Trend Confirmation - Use Trendline Scythes to confirm existing trends by observing how price interacts with the curved trendlines.
Breakout Signals - Auto-detection of breakouts adds a proactive element to your trading strategy, helping you stay ahead of potential trend reversals.
Target Setting - Utilize the script to set profit-taking targets based on volatility, aligning with the current market conditions.
🔲 Settings
Pivot Length - Swing detection length
Scythe Length - Adjusts the length of the scythes blade
Sensitivity - Controls how restrained the target calculation is, higher values will result in tighter targets.
🔲 Alerts
Breakout
Breakdown
Target Reached
Target Invalidated
As well as the option to trigger 'any alert' call.
Trendline Scythes is a versatile tool combining the benefits of traditional trendlines with the dynamic adaptability of curved lines for a unique approach to trend analysis.
Trend Lines [LuxAlgo]Our new "Trend Lines" indicator detects and highlights relevant trendlines on the user chart while keeping it free of as much clutter as possible.
The indicator is thought for real-time usage and includes several filters as well as the ability to estimate trendline angles.
🔶 USAGE
Trendlines can act as support/resistance, with a higher number of tests indicating a more significant support/resistance role.
A broken TrendLine can be indicative of a potential trend reversal. The script highlights breaks with a label.
Users can additionally filter trendlines, only showing trendlines whose angles fall within a user set range:
This allows for the removal of potential clutter from the chart but also helps keep steeper or more horizontal trendlines.
🔶 DETAILS
When a swing (pivot point) is found, a Trendline is drawn when certain conditions are fulfilled.
An essential condition is that a Bearish Trendline (red) always occurs on a lower high, while a Bullish Trendline (blue) occurs on a higher low.
Our implementation will first show an initial dotted-styled TrendLine on confirmation, after which a solid-styled secondary TrendLine will develop. The latter will be used for the real-time detection of breaks at that line:
Furthermore, the script allows you to add more conditions:
🔹 Length (Swings)
A swing develops when a high/low is the highest/lowest against x highs/lows on the left AND right of that bar. x can be set by "Length" in settings.
The following images clarify this. The script confirms a swing where the yellow flag is shown; the high (here visualized with a purple label) is the highest point against x bars left and right of that point.
At that moment, this swing is checked against the previous swing. If all conditions are fulfilled, an initial TrendLine is drawn on confirmation.
After that point, a secondary thicker solid line is seen which keeps progressing bar after bar, until:
• a new TrendLine is formed
• the TrendLine is broken
🔹 Breaks between Swings
Once there is confirmation that a TrendLine can be drawn, the script allows you to filter for breakthroughs on that line. This can be set with "Check breaks between"
Disabled : the initial TrendLine is allowed to be pierced:
Check breaks between point A - point B : no breaks are allowed between both Swing points:
Point A - Current bar : no breaks are allowed between the first Swing point and the point of confirmation ('current' bar):
🔹 TrendLine breaks
As mentioned, the secondary TrendLine (solid line) progresses bar after bar until a new TrendLine is formed or the TrendLine is broken. When a TrendLine is broken, the TrendLine stops progressing, but if there isn't a new TrendLine and price return back, the TrendLine will re-appear, potentially giving several signals when the TrendLine is broken again.
Minimal bars allow you to regulate the amount of signals when the TrendLine is broken.
-> The secondary TrendLine must be uninterrupted for at least x bars before a potential break can be considered.
The following example shows 1 signal against 3 by adjusting this setting from 2 to 5:
🔹 Angles
Angles should normally be calculated when the units of the X and Y axis are the same. However, on our charts, the unit of the X-axis is bar_index (bars), and on the Y-axis the unit is price (¥, €, £, $,...).
It is not easy to normalize and create reasonably valid angles. Often certain angle calculations can differ through price changes or volatility.
Our calculate_slope() function tries to make corresponding angles through all bars.
We do this by calculating the difference between the highest/lowest price values in a certain bar range. The bar range is our X-axis, and the price difference is our Y-axis.
Zooming in/out will not change the amount of bars or the price. Since it does change our view on the chart, and thereby how we see the angles, we have included a setting where you can personalize the ratio between X and Y-axis (Angles -> Ratio X-Y axis).
Settings: Angles - Ratio X-Y axis:
🔶 SETTINGS
🔹 Swings
Length: Lookback period for the detection of swing points.
🔹 Trendline validation
Check breaks between :
Disabled : the initial TrendLine is allowed to be pierced
Check breaks between point A - point B : no breaks are allowed between both Swing points
Point A - Current bar : no breaks are allowed between the first Swing point and the point of confirmation ('current' bar)
Source (breaks) : Source which invalidates TrendLine, default: close
🔹 TrendLine breaks
Minimal bars : The secondary TrendLine must be uninterrupted for at least x bars before a potential break can be considered.
🔹 Angles
Show : Toggle labels.
Ratio X-Y axis : Every user has his preferences regarding zoom, chart layout,...
If the shown angles are not according to your expectations, you can adjust this number.
Only TrendLine between : Only allow TrendLines between the minimum and maximum degrees. Set only the minimal and maximum values above 0.
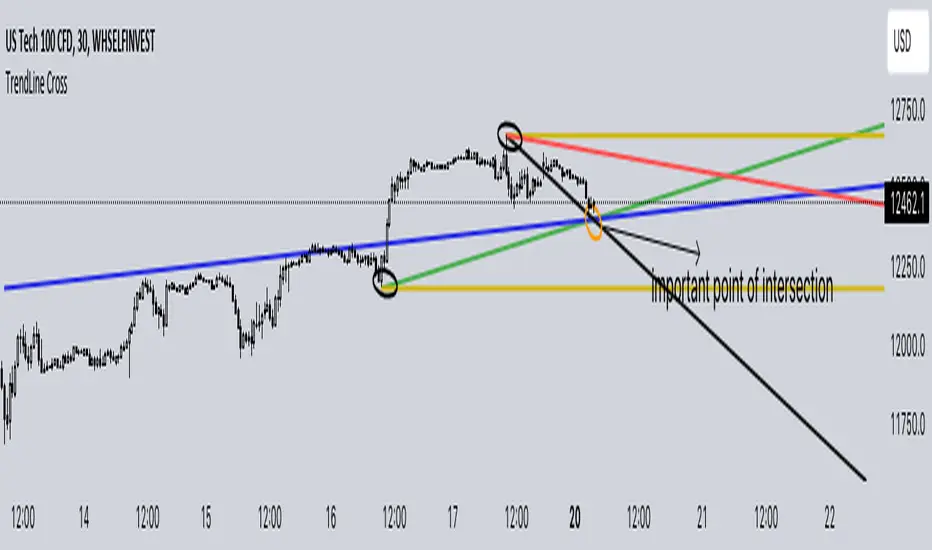
TrendLine CrossThis indicator "TrendLine Cross", is designed to plot trend lines so you can spot potential trend reversal points on the charts. The main function is to draw several lines on the chart and identify the crossings between these lines, which can be significant indicators for trading. The lines are based on different periods which can be changed in the settings tabs.
Let's see the characteristics of the trend lines:
_Low Line Color(Green Line): This line connects the lowest point of low prices in the "low_time" period with the lowest point of low prices in the "high_time" period. Indicates a possible short-term support level on the chart.
_Liquidity Up Line Color (Golden Line): This line connects the lowest point of low prices in the "low_time" period with the highest point of low prices in the same period. It represents a liquidity zone and an important resistance in the chart.
_Lower Line Color (Blue Line): This horizontal line connects the lowest point of low prices in the "LowerLine_period" with the lowest point of low prices in the "high_time" period. Indicates a possible long-term support level.
_Upper Line Colorr: This line represents a connection between the highest points of the "high_time" period and the lowest point of the "LowerLine_period". Indicates a possible long-term resistance level.
_Up Line Color (Red Line): This line connects the highest point of high prices in the "high_time" period with the highest point of high prices in the "LowerLine_period". It represents a possible long-term resistance level.
_Liquidity Down Line Color(Golden Line): This line connects the highest point of high prices in the "high_time" period with the highest point of low prices in the "low_time" period. It represents a liquidity point and an important support zone.
The indicator becomes particularly interesting when the lines make crossings. These crossovers could suggest a potential trend change in the market. For example:
Change from Bearish to Bullish: If the "long-term" line (black) crosses the "short- or long-term" line (green or blue) from top to bottom, it could indicate a shift from a bearish to a bullish market , suggesting the opportunity for long positions.
_Changing from Bullish to Bearish: If the "long-term" line (blue) crosses the "short-term" line (red or black) from bottom to top, it could indicate a shift from a bullish to a bearish market, suggesting the opportunity for short positions.
Generally speaking, crossings between these lines can be key points of interest for traders, as they can signal significant changes in price direction.
Trendline Breakouts With Targets [ChartPrime]The Trendline Breakouts With Targets indicator is meticulously crafted to improve trading decision-making by pinpointing trendline breakouts and breakdowns through pivot point analysis.
Here's a comprehensive look at its primary functionalities:
Upon the occurrence of a breakout or breakdown, a signal is meticulously assessed against a false signal condition/filter, after which the indicator promptly generates a trading signal. Additionally, it conducts precise calculations to determine potential target levels and then exhibits them graphically on the price chart.
🔷 Key Features:
🔸 Trendline Drawing: The indicator automatically plots trendlines based on significant pivot points and wick data, visually representing the prevailing trend.
🔸 Breakout and Breakdown Signals : It triggers trading signals when a breakout (price moves above the trendline) or a breakdown (price moves below the trendline) is detected, helping traders identify potential entry points.
🔸 False Breakout/ Breakdown Filter ✔️: To enhance accuracy, the indicator incorporates a filter to reduce false breakout and breakdown signals, helping traders avoid premature entries.
🔸 Target Calculation: The indicator performs target-level calculations, a critical aspect of trade management.
These calculated target levels are visually displayed on the price chart, helping traders set precise profit targets and make well-informed trading decisions.
🔸 Color-Change Labels: The indicator features label color changes to provide quick visual cues. Labels are initially displayed in orange. When a take profit (TP) level is reached, the label changes to green, indicating a successful trade. Conversely, if a stop-loss (SL) level is hit, the label turns red, signaling a losing trade.
🔸 Settings :
This indicator combines technical analysis, trendline identification, breakout/breakdown signals, and risk management tools to assist traders in making more informed and efficient trading decisions. It can be a valuable addition to any trader's toolkit, helping them identify potential trade opportunities and manage risk effectively.

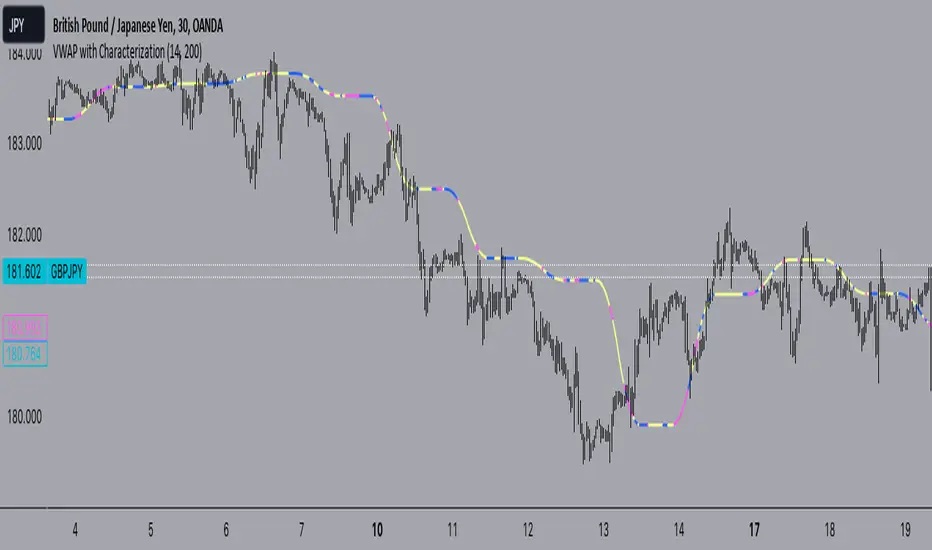
VWAP with CharacterizationThis indicator is a visual representation of the VWAP (Volume Weighted Average Price), it calculates the weighted average price based on trading volume. Essentially, it provides a measure of the average price at which an asset has traded during a given period, but with a particular focus on trading volume. In our case, the indicator calculates the VWAP for the current trading symbol, using a predefined simple moving average (SMA) with a period of 14. This volume-weighted moving average offers a clearer view of the behavior of the VWAP and, of consequence of market dynamics.
One of the distinctive features of this indicator is its ability to provide a more "linear" representation of the data. This means that the data is "smoothed" to remove noise, allowing you to more easily identify the direction of the market trend. This smoother representation is especially useful because the financial market can be subject to significant fluctuations and volatility, and this indicator can help get a more stable view of the trend.
The indicator also offers a visualization of the market trend in a very intuitive way. Using an evaluation of the highs and lows of the last 10 days, determine whether the market is in an uptrend, downtrend, or no trend at all. To make this evaluation even clearer and more immediate, the indicator line is colored dynamically. When the trend is bullish, the line is blue, while in case of a bearish trend, it takes on a distinctive color, such as pink. If the trend is not defined, the line will be colored differently, for example light yellow. This coloration gives traders an immediate visual indication of the prevailing trend, allowing them to make more informed decisions regarding trading operations.
One potential strategy involves watching candles when they cross the VWAP line strongly. If, for example, a candlestick breaks above the VWAP line, we may look for retest areas near key support levels to gauge a potential long entry. In other words, we would consider that the price may have the potential to rise further after breaking above the VWAP line, and we would look to enter a long position to take advantage of this opportunity.
On the other hand, if a candlestick crosses below the VWAP line, we might consider looking for retest areas near the VWAP line itself, which now serves as potential resistance. This could indicate a possible short entry opportunity, as the price may struggle to break above the resistance represented by the VWAP line after breaking it down. In this case, we would look to take advantage of the expected continuation of the downtrend.
In both cases, the idea is to exploit significant movements across the VWAP line as signals of potential reversal or continuation of the trend. This strategy can help identify key entry points based on price behavior relative to the VWAP line.