WN 5-20-50 SMA Setup (Discrete Lines = SL TP) Multiple Entries Pretty Simple Script as I got this idea from a YouTuber that showed us how to use AI to make TradingView Indicators.
When the 5 day Simple Moving Average Goes Above the 20 day Simple Moving Average it issues a BUY Signal when the Trend itself is over the 50 day Simple Moving Average.
When the 5 day Simple Moving Average Goes Below the 20 day Simple Moving Average it issues a SELL Signal when the Trend itself is under the 50 day Simple Moving Average.
The Green Cloud Represents price over the 50 day Simple Moving Average. BUY signals will only show up in the green cloud.
The Red Cloud Represents price under the 50 day Simple Moving Average. SELL signals will only show up in the green cloud.
The lines represent Stop Loss and two Take Profit Levels. Take Profit 1 is 1.5x the stop loss and Take Profit 2 is 3x the Stop Loss.
This version of the Script has multiple Trend signals for entries so you can scale into a trade when the Trend is being aggressive.
Stoploss

TP & SL Indicator [TheScalpingAnt]
Overview
TP & SL Levels Clean is a precision trade-management tool designed to instantly plot professional-grade Take Profit and Stop Loss levels directly on your chart. Whether you are scalping, swing trading, or managing high-risk execution, this indicator removes guesswork by automatically calculating your SL and up to three configurable TP targets, displaying them with clean price labels on the right side of the chart.
This tool is built for traders who demand clarity, discipline, and execution accuracy.
Core Concepts
This indicator is designed around three key trading principles:
• Risk Management First
A clearly defined Stop Loss is essential in every professional trading strategy. The indicator ensures your SL is always visible and precise.
• Structured Profit Taking
Instead of randomly exiting trades, the tool delivers predefined TP targets to support scaling out and disciplined exits.
• Clean Visual Execution
Levels are displayed with bold lines and price tags, ensuring immediate readability without cluttering the chart.
LONG and SHORT trading directions are fully supported, ensuring it fits any trading style and asset class.
Key Features
• Automatically plots:
o Entry price level
o Stop Loss level
o TP1 (mandatory)
o TP2 (optional)
o TP3 (optional)
• Works for:
o LONG & SHORT positions
• Adjustable percentages for:
o SL %
o TP1 %
o TP2 %
o TP3 %
• Toggle ON/OFF visibility for TP2 & TP3
• Clean professional design
• Smart decimal precision based on instrument price
• Stable drawing logic using only the latest bar (no historical clutter)
• Precise price labels aligned on the right side of the chart
• Customizable line width
• Lightweight, fast, and optimized for performance
Customization & Flexibility
The indicator allows full personalization to match your trading strategy:
• Manually set Entry Price or let the indicator auto-detect from current price
• Choose Trade Direction: LONG or SHORT
• Define your exact:
o Stop Loss %
o Take Profit % levels
• Enable or disable TP2 and TP3 depending on your strategy
• Adjust line thickness
• Automatically adjusts price label decimal formatting for Forex, Crypto, Indices, and Stocks
This gives you total flexibility to adapt the tool to scalping, day trading, swing trading, or long-term positioning.
How to Use
1. Apply the indicator to your chart
2. Set:
o Entry Price (or leave 0 for automatic detection)
o Trade Direction (LONG / SHORT)
3. Define SL %, TP1 %, and optionally TP2 & TP3 %
4. Enable TP2 / TP3 toggles if needed
5. The indicator instantly plots:
o Entry line
o Stop Loss line
o Take Profit levels
6. Trade with visual confidence knowing your execution levels are clearly defined
Example Use Case
A trader plans a LONG position at 1.20000.
They configure:
• SL = -1.20%
• TP1 = +0.90%
• TP2 = +0.90% (optional)
• TP3 = +0.90% (optional)
The indicator immediately displays:
• Entry Reference Level
• Stop Loss Zone
• Profit Targets
This gives the trader an instant, structured trading framework without manual calculations, improving discipline and execution speed.
Settings Breakdown
Inputs:
• Entry Price (0 = auto)
• Trade Direction (LONG / SHORT)
• Stop Loss %
• TP1 %
• TP2 %
• TP3 %
• Toggle ON / OFF TP2
• Toggle ON / OFF TP3
• Line Width
• Built-in intelligent decimal formatting
Visuals:
• Bold colored levels
• Clear labels with precise price values
• Transparent clean UI
• Optimal spacing for visibility
Conclusion
TP & SL Levels Clean is built for serious traders who understand that consistent profitability comes from structured execution, not emotions. By combining clarity, flexibility, and professional visualization, this indicator helps you manage trades with precision and confidence.
If you are looking to simplify your workflow, improve discipline, and present professional execution management on your charts, this tool is for you.
Disclaimer
This indicator does not provide financial advice or guaranteed profits. It is a technical tool designed to support trade planning and execution. Trading involves risk, and users should always conduct their own analysis and manage risk responsibly

ATR Risk EngineATR Risk Engine is a precision trade-management indicator designed to standardize risk using Average True Range (ATR) rather than arbitrary price levels.
It defines stop-loss and take-profit levels based on current market volatility, allowing traders to maintain consistent risk behavior across different symbols, timeframes, and market conditions.
This is not a signal indicator.
It is a risk framework built to integrate seamlessly with existing strategies.
Key Features
ATR-based Stop Loss and Take Profit levels
Risk based position sizing using account size, risk per trade, and stop distance
Customizable ATR multipliers
Long / Short trade mode toggle
Risk distance displayed in:
- Dollar value
- Percentage
- Price distance
- Clean on-chart visualization with status-line readouts
Fully protected, invite-only script
Why Use ATR-Based Risk?
Fixed-price stops ignore volatility.
ATR Risk Engine dynamically adjusts risk to current market conditions, helping traders avoid stops that are too tight in high volatility or too loose in low volatility.
The result is proportional, repeatable risk management, regardless of the instrument traded.
Intended Use
Trade planning and execution
Risk normalization across markets
Consistent stop and target placement
Works with discretionary or systematic strategies
Who This Is For
✔ Traders who already have defined entries
✔ Traders focused on process and discipline
✔ Active day traders and swing traders
✖ Not a buy/sell signal
✖ Not a standalone strategy
✖ Not designed for automated “set and forget” trading
Disclaimer
This indicator is provided for educational and informational purposes only.
It does not constitute financial advice and does not guarantee performance.
Trading involves risk.
Display Examples
Stop Loss / Take Profit price levels with position size (status line)
Risk distance shown in dollar terms ($)
Risk distance shown as percentage (%)

Options SL/TP Price Projection Sim + Day Trading/Scalping Toolwww.tradingview.com
📌 What this indicator does
This indicator projects what your option contract will be worth when the stock reaches your Stop Loss or Take Profit — before price gets there.
Instead of guessing:
“How much will this option be worth if price hits my stop?”
“Is this move actually worth the risk in option dollars?”
You get instant, realistic option price estimates at your exact stock levels.
⚙️ How it works (simple but powerful)
The script uses a local delta + gamma approximation to estimate option price changes:
Delta → linear price sensitivity
Gamma → curvature for fast moves
Optional execution friction → realistic fills
Automatic Call / Put detection via delta sign
Enforced $0.01 minimum option price (real market behavior)
This is not a slow academic options model — it’s a trader-grade approximation designed for speed and clarity.
🚀 Designed specifically for DAY TRADING
This tool is optimized for:
Options scalping
Momentum trades
Breakouts & flushes
0DTE / weekly options
Holding times ~3–15 minutes
Why it excels here:
Delta + gamma dominate option pricing on fast moves
IV and theta usually don’t have time to fully reprice
You get actionable numbers, not theoretical noise
This is exactly the environment most option day traders operate in.
🧠 Key Features
✅ Projects option price at BOTH SL and TP
✅ Works for calls & puts automatically
✅ Enter any two stock levels — script assigns SL/TP correctly
✅ Clean, black HUD table (no clutter, no moving drawings)
✅ Non-draggable, stable price levels
✅ Minimal inputs — no overengineering
✅ Built for speed under pressure
🎯 Why this is effective
Most traders manage risk in stock points , but trade options .
This indicator bridges that gap.
It lets you:
Judge true risk/reward in option dollars
Avoid “looks good on the chart, bad on the premium”
Compare setups objectively
Size trades more intelligently
Make faster, more confident decisions
It’s especially useful when spreads, gamma, and fast tape make intuition unreliable.
🧼 Philosophy: Clean > Complicated
This script intentionally avoids:
Full Black-Scholes modeling
IV forecasting
Overloaded settings
Visual clutter
Instead, it focuses on what matters for day traders:
“If price gets here quickly, what should my option be worth?”
⚠️ Important Notes
Best accuracy for fast, clean moves
Not intended for multi-hour holds or swing trading
Assumes relatively stable IV over short horizons
Execution friction is configurable to match real fills
Used correctly, this becomes a powerful decision-support tool, not a prediction engine.
✅ Who this indicator is for
Options day traders
Scalpers
Momentum traders
Anyone trading options off stock price levels
If you trade options intraday and manage risk using stock levels, this tool was built exactly for you.

Alpha Net Stop Loss & Take Profit % 🔒 Invite-only Script: Alpha Net SL/TP %
An automated system that plots fixed-percentage Stop Loss and Take Profit zones using EMA 5/32 cross signals. It captures entries, plots TP/SL zones with colored fills, and tracks trade state.
📌 Features:
- EMA 5/32 cross-based entry signals.
- Auto-reset on SL/TP hit.
- Alerts for entry/exit.
- Clean zone visuals.
The code is protected to preserve proprietary logic. Please contact the author to request access.

Trading Module [BackQuant]Trading Module
A modular overlay that lets you combine three core components, a Trend Model, an Impulse Model, and an optional Stop Loss framework, then layer in a multi-symbol RSI screener plus a full price action toolkit (market structure, FVGs, order blocks, volumetric S/R). Built for discretionary execution and study, not for blind automation.
────────────────────────────────────────────────────────────
What this script is
This indicator is designed like a “module picker”. Instead of forcing one opinionated system, it gives you selectable models that can be combined into a workflow:
1) Trend Model , answers “what side is the market biased to?”
2) Impulse Model , answers “is there currently expansion, pressure, or a momentum event worth paying attention to?”
3) Stop Loss Layer , answers “where are reasonable invalidation zones if I’m managing risk manually?”
4) RSI Screener , answers “what are my watchlist assets doing right now, on multiple timeframes, in one place?”
5) Price Action Concepts , answers “what structure levels, imbalances, institutional zones, and volume-based levels matter?”
You can run it as a lightweight overlay (trend + impulse only), or turn on the heavier price action stack when you want deeper context.
────────────────────────────────────────────────────────────
How to use it, the intended workflow
Step 1, pick your Trend Model
The trend model is your baseline directional filter. It is meant to reduce “random trading” by keeping you aligned with the dominant structure or momentum bias.
Trend Models (examples)
Typical usage:
- If the trend model reads bullish, you focus on long setups and avoid shorting into strength.
- If the trend model reads bearish, you focus on short setups and avoid catching bottoms.
- If the trend model is neutral or mixed, you reduce size or wait for confirmation.
What you can expect from the options (without exposing internal weighting or thresholds):
- Universal Trend+ , a composite trend regime model that blends multiple families of trend evidence. It is designed to be more robust than a single indicator and reduce “one-indicator failure modes”.
- EMA Cross , a classic fast vs slow trend bias. Simple, responsive, but can whipsaw in ranges.
- DEMA ATR , a smoother trend anchor that adapts to volatility. Often cleaner in chop than basic crosses.
- Relative Strength Overlay , a strength scoring style bias built from an RSI-style internal scoring process. Useful when you want “strength state” more than “moving average state”.
Color conventions:
- Long color and short color are user-defined, so you can keep consistent visuals across your BackQuant suite.
Step 2, pick your Impulse Model
Impulse is separate from trend on purpose. Trend answers direction, impulse answers timing. A market can be trending but not currently impulsing, or impulsing in a counter-trend squeeze.
Impulse Models (examples)
How to use impulse signals:
- Treat impulse as “permission” to engage, not as a standalone trade trigger.
- Best pairing is trend aligned impulse, meaning bullish trend model plus bullish impulse, bearish plus bearish.
- Counter-trend impulses can be used as warning signals, take-profit cues, or short-lived mean reversion opportunities, depending on your style.
The impulse options in this module are built around pressure and expansion detection. They are meant to identify moments where conditions shift from “noise” to “initiative activity”.
Step 3, choose a Stop Loss framework
This script includes optional stop visualization modes. These are not meant to be blindly used as a “one true stop”, they are tools for structuring invalidation around volatility or defined percentage bands.
Stop Loss (examples)
Stop loss options:
- None , no overlay.
- Dynamic , a volatility-aware band. Useful when you want stops to widen in high vol and tighten in low vol.
- Fixed , preset percentage bands. Useful for quick structure around risk units, scaling, or rule-based journaling.
- Bar-to-Bar , a micro-structure invalidation reference that uses the prior bar as a risk anchor. Useful for very tight management and fast invalidation.
How to apply them properly:
- Stops should be placed where the trade idea is wrong, not where you “feel pain”.
- A volatility stop is usually an environment stop, while a fixed stop is usually a plan stop.
- If you use impulses for entries, your stop should account for impulse volatility, otherwise you get stopped on the exact move you’re trying to capture.
────────────────────────────────────────────────────────────
RSI Screener module
This module is built for scanning multiple symbols and timeframes from one chart, without switching tabs.
RSI Screener (example)
What it does:
- Lets you define up to 10 symbols (defaults to major crypto pairs).
- Each slot can have its own timeframe.
- Computes an RSI value per symbol and assigns a directional state relative to a midline threshold.
- Displays a stacked overlay readout using a monospace label style for quick scanning.
How to use it:
- Set slots 1–5 as your majors, 6–10 as your rotation candidates.
- Use higher timeframes for regime, lower timeframes for timing.
- Use the midline threshold as a “trend bias” line, not an overbought or oversold line.
- Treat the screener as context, not a signal. Your chart model and price action still decide the trade.
Performance note:
- Screeners are heavy by nature because each symbol is a security() request. Keep the number of enabled slots reasonable if you are on lower-end hardware or running many scripts.
────────────────────────────────────────────────────────────
Price Action Concepts and Market Structure stack
This script includes a full price action toolkit intended to provide “where” context, levels, zones, and structural breaks, so the trend and impulse models are not operating in a vacuum.
Price Action Concepts / Market Structure (example)
This section is split into five major blocks:
1) Market Structure, Swing and Internal
You can enable swing structure and internal structure separately, with independent lookbacks.
- Swing structure tracks larger, slower pivots, better for macro trend structure.
- Internal structure tracks tighter pivots, better for entry timing and micro shifts.
It prints structure events as:
- BOS (Break of Structure), continuation-style break.
- MSB (Market Structure Break), shift-style break. Some traders call this CHoCH, here it’s presented as an MSB concept.
Usage:
- Swing BOS is good for confirming a larger regime.
- Internal structure is good for timing entries within the swing context.
- If internal flips but swing does not, treat it as a warning, not necessarily a full reversal.
2) Fair Value Gaps (FVG)
Optional imbalance boxes that highlight displacement zones.
Key controls:
- Timeframe selection (or current timeframe).
- How many to keep on chart.
- How far to extend them right.
Usage:
- FVGs are best treated as “areas of interest”, not guaranteed support/resistance.
- They help you frame where price might rebalance after an impulse event.
3) Order Blocks (OB)
Optional institutional-style zones detected from structure and candle logic, with filters.
Key controls:
- Fractal type (3 or 5) changes how “strict” structure detection is.
- Break method (close vs high/low) changes confirmation strictness.
- Optional filter with FVG distance to reduce low-quality blocks.
- Extend, delete-when-filled, and label options for chart hygiene.
Usage:
- OBs are strongest when aligned with swing context and confirmed by volume or displacement.
- Filled blocks are informational, they can be removed to reduce clutter.
4) Volumetric Support and Resistance
This module creates support and resistance “zones” based on high-volume pivot events, then manages them over time.
Key controls:
- Detection sensitivity, volume multiplier, and lookback period.
- Minimum distance between zones to avoid stacking duplicates.
- Remove broken, extend, and volume display toggles.
How to interpret:
- Levels are thicker zones, not single price lines.
- “Touches” are tracked as an interaction count, useful for identifying repeatedly defended or attacked zones.
- High-volume zones are visually emphasized, these tend to matter more than low volume pivots.
Usage:
- Pair volumetric levels with impulse signals, an impulse into a high-volume resistance zone is not the same as an impulse in open space.
- Use volumetric levels as structure anchors for invalidation and targets.
5) Alerts
The price action stack includes alerts for new levels, touches, breaks, and order block creation or interaction.
Use alerts for:
- Watchlist management, you get notified when price hits an area.
- Avoiding screen-watching, especially when you run multi-timeframe setups.
────────────────────────────────────────────────────────────
Core philosophy of the module
This indicator is not “one model to rule them all”. It is meant to let you build a trading process:
- Trend decides bias.
- Impulse decides engagement timing.
- Price action decides location and structure.
- Stops decide risk containment.
- Screener decides where to look.
If you only use one layer, you are throwing away most of the edge this style of framework is designed to create. The strength is in confluence and filtering.
────────────────────────────────────────────────────────────
Suggested presets
Preset A, clean trend-following overlay
- Trend Model, Universal Trend+ or DEMA ATR
- Impulse Model, either option
- Stop Loss, Dynamic
- Price action modules off (structure off, FVG off, OB off, volumetric off)
- Screener on (high timeframe)
Preset B, execution and structure mode
- Trend Model on
- Impulse Model on
- Market Structure on (swing + internal)
- FVG on (current timeframe or one higher)
- Order Blocks on with FVG filter
- Volumetric S/R on
- Stop Loss, Dynamic or Bar-to-Bar depending on speed
Preset C, watchlist scanner mode
- Screener on
- Minimal chart overlays on
- Use alerts for touches and breaks
- Only open charts that show alignment across trend and impulse
────────────────────────────────────────────────────────────
Notes and limitations
- This is a heavy script when multiple modules are enabled, because it draws objects and can request multiple symbols.
- The models are designed to be modular, so not every combination will be optimal for every market or timeframe.
────────────────────────────────────────────────────────────
Quick input map
Main Settings/Models
- Select Trend Model
- Select Impulse Model
- Select Stop Loss
- Show Screener
- Long/Short colors
Screener Settings
- Label size and offsets
- RSI length and midline
- Up to 10 symbol slots with per-slot timeframe and enable toggle
Market Structure
- Swing and internal structure mode and lookbacks
- Bull and bear colors
Fair Value Gaps
- Enable, count, timeframe, extend, colors
Order Blocks
- Enable, labels, fractal type, break method
- FVG filter and distance
- Lookback, extend, delete-when-filled, colors
Volumetric S/R
- Sensitivity, volume multiplier, analysis window
- Level limits, distance rules, extension and cleanup rules
- Volume display preferences
────────────────────────────────────────────────────────────
End note
This is intended as a full visual decision-support module for discretionary traders who want trend, timing, structure, and watchlist scanning in one place. Use it to build a repeatable process, then validate that process with proper testing and journaling before risking real capital.

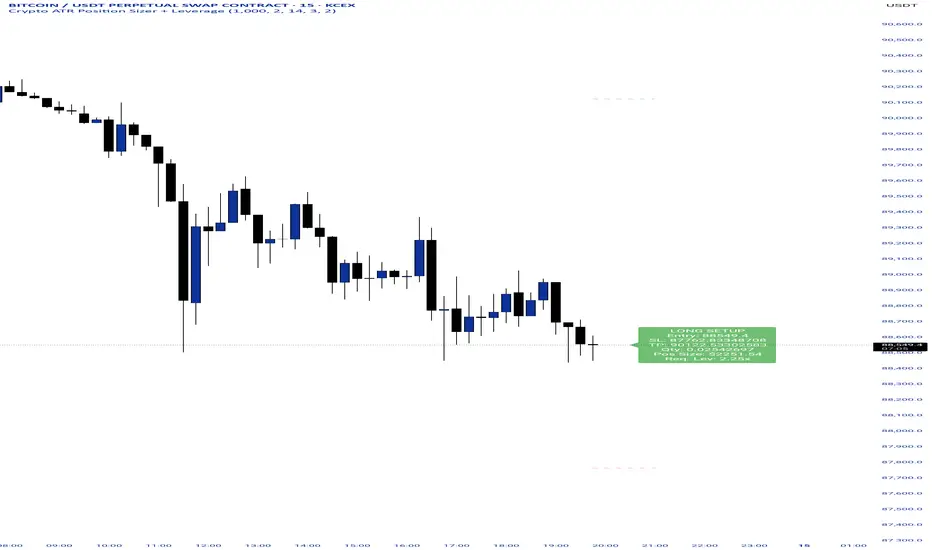
Crypto ATR Position Sizer + LeverageThis indicator is a "heads-up display" for crypto traders who need real time risk management without manually calculating position sizes. It uses Average True Range (ATR) to dynamically place Stop Losses based on current market volatility and automatically calculates the exact position size needed to respect your risk percentage.
Key Features:
Dynamic Risk Management: Stop Loss and Take Profit levels adjust automatically based on market volatility (ATR).
Auto-Position Sizing: Calculates the exact Quantity (in coins) and Position Value (in $) to ensure you never risk more than your defined percentage (e.g., 1% or 2%).
Leverage Calculator: Instantly sees the "Required Leverage" needed to execute the trade size relative to your account balance.
Crypto Precision: Displays up to 8 decimal places, making it compatible with both Bitcoin and low-sat altcoins.
Toggable Direction: Switch between Long and Short biases instantly via the settings menu.
How to Use:
Add the indicator to your chart.
Open Settings and input your Account Balance and Risk %.
Choose your direction (Long or Short) using the checkboxes.
The label will display your Entry, SL, TP, Coin Quantity, and Required Leverage in real-time.
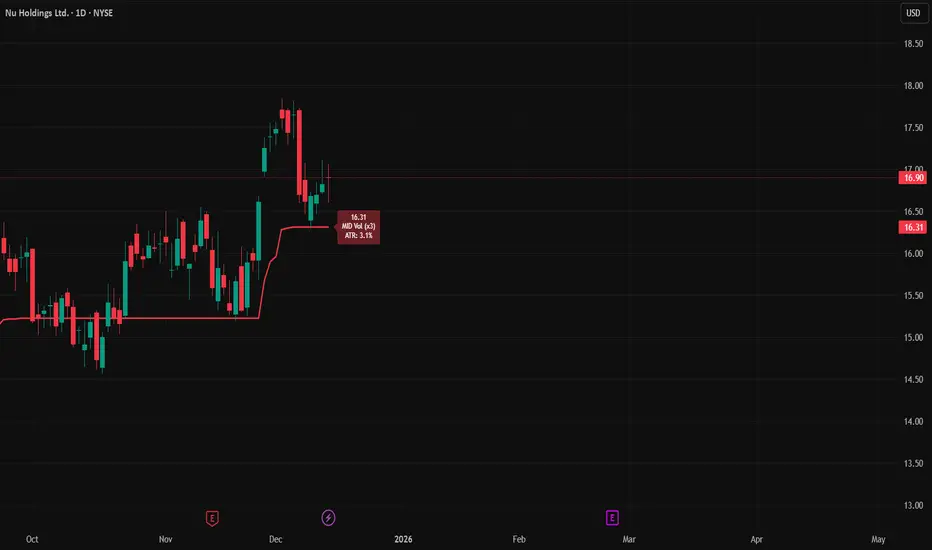
ATR Trailing StopATR Trailing Stop (Dynamic Volatility Regimes)
==============================================
This indicator implements an adaptive ATR-based trailing stop for long positions. The stop automatically adjusts based on stock volatility, tightening during fast movements and widening during calm periods. It is designed as a trade management tool to help protect profits while staying aligned with strong trends.
How It Works
------------
* Tracks the highest high over a configurable lookback window and ensures this “top” never moves downward.
* Computes the trailing stop as:**Top – ATR × Dynamic Multiplier**
* The ATR multiplier changes depending on volatility:
* Low volatility → Wide stop (slower trailing)
* Medium volatility → Standard trailing
* High volatility → Tight stop (faster trailing)
* The trailing stop only moves upward; it never decreases.
* If price falls significantly below the stop (default: 5%), the system resets and begins trailing from a new top.
* An optional price-scale label displays:
* Current stop value
* Volatility regime (LOW / MID / HIGH)
* ATR percentage and active multiplier
Alerts
------
Two alert conditions are included:
### Trailing Stop – Near
Triggers when price moves within a user-defined percentage above the stop.
### Trailing Stop – Hit
Triggers when price touches or closes below the stop.
How to Use
----------
1. Add the indicator to any chart (daily timeframe recommended).
2. Configure:
* ATR length
* Lookback bars
* Volatility thresholds
* ATR multipliers
3. Set alerts for early warnings or stop-hit events.
4. Use the stop line as a dynamic risk-management tool to guide exit decisions and protect profits.
Notes
-----
* Designed for long-only trailing logic.
* This indicator does not generate entry signals; it is intended for stop management.
Vega Convexity Engine [PRO]ENGINEERED ASYMMETRY.
This is the flagship Stage 2 Specialist Model of the Vega Crypto Strategies ecosystem.
While the free "Regime Filter" tells you when to trade (filtering out chop), the Convexity Engine tells you how to trade. It activates only when the Regime Filter confirms an Impulse, classifying the specific vector of the market move to maximize risk-adjusted returns.
PRO FEATURES
This script visualizes the output of our Hierarchical Machine Learning Engine:
🚀 Directional Classification:
It does not just say "Buy." It classifies volatility into 4 distinct probability classes:
- EXPLOSION: High-confidence, high-velocity upside (Fat-Tail).
- RALLY: Standard trend continuation.
- PULLBACK: Short-term correction opportunity.
- CRASH: High-confidence downside (Long Squeeze Detection).
🛡️ Dynamic Risk Engine (Intraday Stops):
The "+" markers on your chart represent the Vega Institutional Stop Loss . These levels dynamically adjust based on Average True Range (ATR) and Volatility Z-Scores.
Strategy: If price breaches the "+" marker, the hypothesis is invalidated. Exit immediately.
📊 Institutional HUD:
A professional heads-up display showing the current Regime, Vector, and Risk Deployment status in real-time.
THE PHILOSOPHY
"Convexity" means limited downside with unlimited upside. By combining the Regime Filter (sitting in cash during noise) with Dynamic Stops (cutting losers fast), this engine is designed to capture the "fat tails" of the crypto market distribution.
🔒 HOW TO GET ACCESS
This is an Invite-Only script. It is strictly for members of Vega Crypto Strategies .
To unlock access, please visit the link in the Author Profile below or check our signature. Once subscribed via Whop, your TradingView username will be automatically authorized instantly.
Disclaimer: This tool is for educational purposes only. Past performance is not indicative of future results. Trading cryptocurrencies involves significant risk.

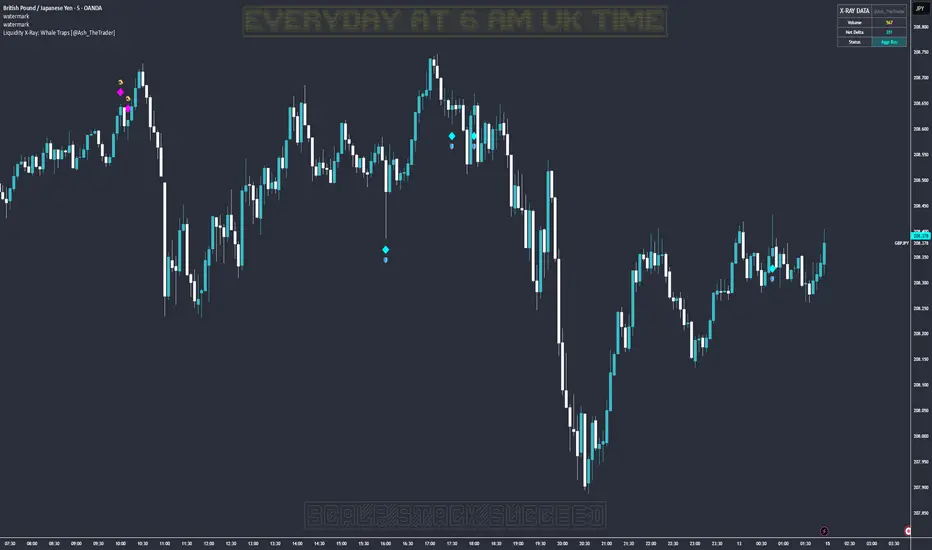
Liquidity X-Ray: Whale Traps [@Ash_TheTrader]👁️ Liquidity X-Ray: The Institutional Edge
Stop Trading Blind. See Inside the Candle.
Ninety percent of retail traders only see the outer shell of a candlestick—the Open, High, Low, and Close. They are trading blind to the actual battle that took place during that candle's formation.
Institutions, however, use expensive Order Flow software to see where aggressive buying or selling is happening in real-time.
The Liquidity X-Ray Strategy, developed by @Ash_TheTrader, levels the playing field. It uses advanced Intrabar Analysis to simulate institutional order flow footprints directly on your TradingView chart, automating powerful reversal signals based on "Absorption."
🧠 The Concept: Intrabar Analysis & Delta
How does it work?
Imagine a single 1-Hour candle. Inside that candle, there are sixty 1-Minute candles hidden from view.
This strategy performs an "X-Ray" scan. It tunnels into the lower timeframes (e.g., 5-minute data inside a 1-hour bar) to calculate the Net Delta—the difference between aggressive buying volume and aggressive selling volume.
Cyan Candles: Indicate that aggressive buyers (hitting the Ask) won the internal battle.
Magenta Candles: Indicate that aggressive sellers (hitting the Bid) won the internal battle.
But knowing who won isn't enough. The real edge comes from identifying Absorption.
🎯 The Signals: Detecting Traps & Shields
The core philosophy of this strategy by @Ash_TheTrader is simple: Identify where high effort yields low results.
When massive volume comes in, but price refuses to move, it means one side is being "absorbed" by a larger player. This is often the precursor to a violent reversal.
1. The Bear Trap (🪤)
What you see: A candle with massive volume and aggressive internal buying (positive Delta), yet the candle body remains small and fails to push price significantly higher.
The Psychology: Retail traders are FOMO-buying aggressively at a high. Institutional "Whales" are sitting on the other side, passively selling into this demand, absorbing all the buy orders without letting price rise.
The Result: Once the buyers are exhausted, the trap snaps shut, and price reverses downward.
Strategy Action: Enters a SHORT position.
2. The Bull Shield (🛡️)
What you see: A candle with massive volume and aggressive internal selling (negative Delta), yet the candle body remains small and fails to push price lower.
The Psychology: A "Stop Run" is occurring. Retail traders are panic-selling. Smart money is stepping in like a shield, absorbing all the sell pressure at a fixed level.
The Result: Once the sellers are exhausted, there is no one left to sell, and price rallies upward.
Strategy Action: Enters a LONG position.
⚡ Strategy Features & The Viral Dashboard
This isn't just an indicator; it's a complete, automated trading system.
Automated Execution: The script takes the trades for you when a Shield or Trap is confirmed upon candle close.
Smart Risk Management: It automatically places Stop Losses beyond the wick of the signal candle and targets a default 2:1 Risk/Reward ratio.
The Live Performance Panel: Look at the top right of your chart. The strategy features a built-in, professional-grade dashboard that displays real-time statistics. You can instantly see the strategy's Win Rate and Net Profit over the current historical data.
"Numbers don't lie. Don't just guess if a setup works; watch the win rate adjust in real-time." — @Ash_TheTrader
🛠️ How to Use This Strategy
For the best results, follow these institutional guidelines:
Timeframe: This strategy is most effective on Higher Timeframes where institutional volume is dominant. We recommend the 1-Hour (1H) or 4-Hour (4H) charts.
Intrabar Resolution (Settings): In the strategy settings, ensure the "Intrabar Resolution" is set lower than your chart timeframe. The default is 5 minutes, which is ideal for scanning inside 1H or 4H candles.
Confluence: While the strategy can be traded standalone, the best signals often occur near major support/resistance zones or key Fibonacci levels.
⚠️ Disclaimer
This strategy uses request.security_lower_tf to perform its calculations. While highly accurate, past performance on the dashboard does not guarantee future results. Always manage your risk responsibly.
Trade smart. See the liquidity.
~ @Ash_TheTrader
Adaptive Risk Management [sgbpulse]1. Introduction:
Adaptive Risk Management is an advanced indicator designed to provide traders with a comprehensive risk management tool directly on the chart. Instead of relying on complex manual calculations, the indicator automates all critical steps of trade planning. It dynamically calculates the estimated Entry Price , the Stop Loss location, the required Position Size (Quantity) based on your capital and risk limits, and the three Take Profit targets based on your defined Reward/Risk ratios. The indicator displays all these essential data points clearly and visually on the chart, ensuring you always know the potential risk-reward profile of every trade.
ARM : The A daptive R isk M anagement every trader needs to ARM themselves with.
2. The Critical Importance of Risk Management
Proper risk management is the cornerstone of successful trading. Consistent profitability in the market is impossible without rigorously defining risk limits.
Risk Control: This starts by setting the maximum risk amount you are willing to lose in a single trade (Risk per Trade), and limiting the total capital allocated to the position (Max Capital per Trade).
Defining Boundaries (Stop Loss & Take Profit): It is mandatory to define a technical Stop Loss and a Take Profit target. A fundamental rule of risk management is that the Reward/Risk Ratio (R/R) must be a minimum of 1:1.
3. Core Features, Adaptivity, and Customization
The Adaptive Risk Management indicator is engineered for use across all major trading styles, including Swing Trading, Intraday Trading, and Scalping, providing consistent risk control regardless of the chosen timeframe.
Real-Time Dynamic Adaptivity: The indicator calculates all risk management parameters (Entry, Stop Loss, Quantity) dynamically with every new bar, thus adapting instantly to changing market conditions.
Trend Direction Adjustment: Define the analysis direction (Long/Uptrend or Short/Downtrend).
Intraday Session Data Control: Full control over whether lookback calculations will include data from Extended Trading Hours (ETH), or if the daily calculations will start actively only from the first bar of Regular Trading Hours (RTH).
Status Validation: The indicator performs critical status checks and displays clear Warning Messages if risk conditions are not met.
4. Intuitive Visualization and Real-Time Data
Dynamic Tracking Lines: The Entry Price and Stop Loss lines are updated with every new bar. Crucially, the length of these lines dynamically reflects the calculation's lookback range (e.g., the extent of Lookback Bars or the location of the confirmed Pivot Point), providing a visual anchor for the calculated price.
Risk and Reward Zones: The indicator creates a graphical background fill between Entry and Stop Loss (marked with the risk color) and between Entry and the Reward Targets (marked with the reward color).
Essential Information Labels: Labels are placed at the end of each line, providing critical data: Estimated Entry Price, Stock/Contract Quantity (Quantity), Total Entry Amount, Estimated Stop Loss, Risk per Share, Total Financial Risk (Risk Amount), Exit Amount, Estimated Take Profit 1/2/3, Reward/Risk Ratio 1/2/3, Total Reward 1/2/3, TP Exit Amount 1/2/3.
4.1. Data Window Metrics (16 Full Series)
The indicator displays 16 full data series in the TradingView Data Window, allowing precise tracking of every calculation parameter:
Entry Data: Estimated Entry, Quantity, Entry Amount.
Risk Data (Stop Loss): Estimated Stop Loss, Risk per Share, Risk Amount, Exit Amount.
Reward Data (Take Profit): Estimated Take Profit 1/2/3, Reward/Risk Ratio 1/2/3, Total Reward 1/2/3, TP Exit Amount 1/2/3.
4.2. Instant Tracking in the Status Line
The indicator displays 6 critical parameters continuously in the indicator's Status Line: Estimated Entry, Quantity, Estimated Stop Loss, Estimated Take Profit 1/2/3.
5. Detailed Indicator Inputs
5.1 General
Focused Trend: Defines the analysis direction (Uptrend / Downtrend).
Max Capital per Trade: The maximum amount allocated to purchasing stocks/contracts (in account currency).
Risk per Trade: The maximum amount the user is willing to risk in this single trade (in account currency).
ATR Length: The lookback period for the Average True Range (ATR) calculation.
5.2 Intraday Session Data Control
Regular Hours Limitation : If enabled, all daily lookback calculations (for Entry/Stop Loss anchor points) will begin strictly from the first Regular Trading Hours (RTH) bar. This limits the lookback range to the current RTH session, excluding preceding Extended Trading Hours (ETH) data. Only relevant for Intraday charts. Default: False (Off)
5.3 Entry Inputs
Entry Method: Selects the entry price calculation method:
Current Price: Uses the closing price of the current bar as the estimated entry point (Market Entry).
ATR Real Bodies Margin :
- Uptrend: Calculates the Maximum Real Body over the lookback period + the calculated safety margin.
- Downtrend: Calculates the Minimum Real Body over the lookback period - the calculated safety margin.
ATR Bars Margin :
- Uptrend: Calculates the Maximum High price over the lookback period + the calculated safety margin.
- Downtrend: Calculates the Minimum Low price over the lookback period - the calculated safety margin.
Lookback Bars: The number of bars used to calculate the extremes in the ATR-based entry methods (Relevant only for ATR Real Bodies Margin and ATR Bars Margin methods).
ATR Multiplier (Entry): The multiplier applied to the ATR value. The result of the multiplication is the calculated safety margin used to determine the estimated Entry Price.
5.4 Risk Inputs (Stop Loss)
Risk Method: Selects the Stop Loss price calculation method.
ATR Current Price Margin :
- Uptrend: Entry Price - the calculated safety margin.
- Downtrend: Entry Price + the calculated safety margin.
ATR Current Bar Margin :
- Uptrend: Current Bar's Low price - the calculated safety margin.
- Downtrend: Current Bar's High price + the calculated safety margin.
ATR Bars Margin :
- Uptrend: Lowest Low over lookback period - the calculated safety margin.
- Downtrend: Highest High over lookback period + the calculated safety margin.
ATR Pivot Margin :
- Uptrend: The first confirmed Pivot Low point - the calculated safety margin.
- Downtrend: The first confirmed Pivot High point + the calculated safety margin.
Lookback Bars: The lookback period for finding the extreme price used in the 'ATR Bars Margin' calculation.
ATR Multiplier (Risk): The multiplier applied to the ATR value. The result of the multiplication is the calculated safety margin used to place the estimated Stop Loss. Note: If set to 0, the Stop Loss will be placed exactly at the technical anchor point, provided the Minimum Margin Value is also 0.
Minimum Margin Value: The minimum price value (e.g., $0.01) the Stop Loss margin buffer must be.
Pivot (Left / Right): The number of bars required on either side of the pivot bar for confirmation (relevant only for the ATR Pivot Margin method).
5.5 Reward Inputs (Take Profit)
Show Take Profit 1/2/3: ON/OFF switch to control the visibility of each Take Profit target.
Reward/Risk Ratio 1/ 2/ 3: Defines the R/R ratio for the profit target. Must be ≥1.0.
6. Indicator Status/Warning Messages
In situations where the Stop Loss location cannot be calculated logically and validly, often caused by a mismatch between the configured Focused Trend (Uptrend/Downtrend) and the actual price action, the indicator will display a warning message, explaining the reason and suggesting corrective action.
Status Message 1: Pivot reference unavailable
Condition: The Stop Loss is set to the "ATR Pivot Margin" method, but the anchor point (Pivot) is missing or inaccessible.
Message Displayed: "Pivot reference unavailable. Wait for valid price action, or adjust the Regular Hours Limitation setting or Pivot Left/Right inputs."
Status Message 2: Calculated Stop Loss is unsafe
Condition: The calculated Stop Loss is placed illogically or unsafely relative to the trend direction and the Entry price.
Message Displayed: "Calculated Stop Loss is unsafe for current trend. Wait for valid price action or adjust SL Lookback/Multiplier."
7. Summary
The Adaptive Risk Management (ARM) indicator provides a seamless and systematic approach to trade execution and risk control. By dynamically automating all critical trade parameters—from Entry Price and Stop Loss placement to Position Sizing and Take Profit targets—ARM removes emotional bias and ensures every trade adheres strictly to your predefined risk profile.
Key Benefits:
Systematic Risk Control: Strict enforcement of maximum capital allocation and risk per trade limits.
Adaptivity: Dynamic calculation of prices and quantities based on real-time market data (ATR and Lookback).
Clarity and Trust: Clear on-chart visualization, precise data metrics (16 series), and unambiguous Status/Warning Messages ensure transparency and reliability.
ARM allows traders to focus on strategy and analysis, confident that their execution complies with the core principles of professional risk management.
Important Note: Trading Risk
This indicator is intended for educational and informational purposes only and does not constitute investment advice or a recommendation for trading in any form whatsoever.
Trading in financial markets involves significant risk of capital loss. It is important to remember that past performance is not indicative of future results. All trading decisions are your sole responsibility. Never trade with money you cannot afford to lose.

VYW Stop Loss LinesA simple utility designed to visually display Stop Loss lines on the chart based on an offset from the current price (the orange dashed lines in the screenshot above).
This indicator can also draw a line from the current bar's close price to the Price axis (the dashed gray line in the screenshot above).

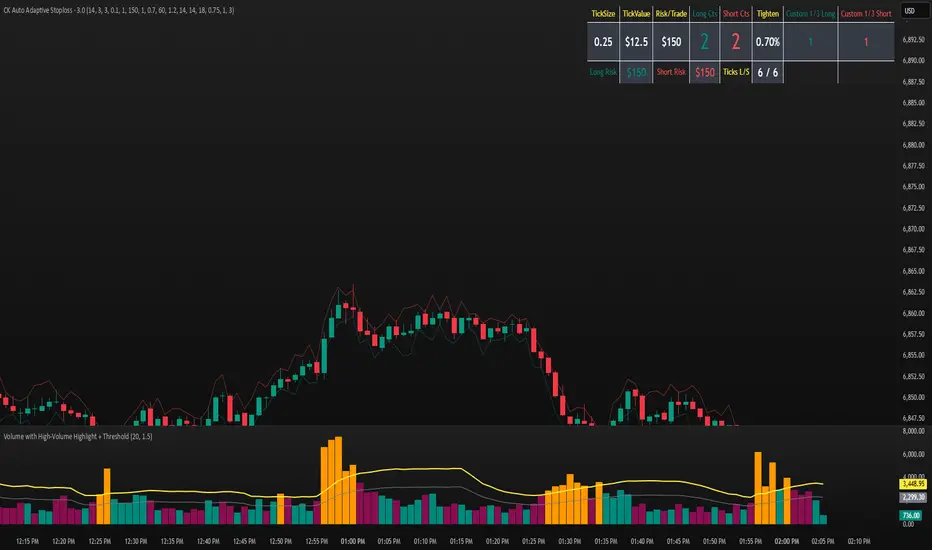
CK Auto Adaptive StoplossThis tool automatically finds the best stop-loss for every trade by analyzing candle structure, ATR volatility, volume spikes, and market momentum. It tightens or widens the stop dynamically and shows you exactly how many contracts you can use based on your risk per trade.
It also plots bold stop-loss lines on your chart and includes a live position-sizing table so you always stay consistent.
Multi-Entry Fibonacci CalculatorMulti-Entry Fibonacci Calculator
This tool is a comprehensive trade calculator designed for discretionary traders who plan to scale into positions. It automates the complex task of position sizing across up to three separate entries while ensuring your total risk exposure remains fixed. By inputting your desired entry, stop loss, and initial profit target levels, the script calculates the precise quantity for each entry and provides a dynamic, real-time view of your trade's vitals.
The primary goal of this script is to allow for disciplined risk management in multi-entry trade plans. Whether you are averaging into a position or adding on pullbacks, this tool ensures your total predefined risk is never exceeded, even if all entries are filled.
Key Features
Multi-Entry Position Sizing: Automatically calculates the share/contract size for up to three entries based on their distance from the stop loss and user-defined weights.
Fixed Risk Management: Define your total risk as a percentage of your account. The script ensures that a full stop-out across all filled entries will result in a loss equal to this predefined amount.
Dynamic Take Profit: The take-profit level automatically adjusts based on your current average entry price to preserve the original target profit amount in dollars.
Real-Time Info Panel: A customizable on-chart panel displays all critical trade data, including current quantity, average price, projected P&L, and trade status.
Visual Trade Plan: Plots all your defined price levels (entries, stop loss, take profit) directly on the chart with informative labels.
Trade State Tracking & Alerts: The script monitors the price and will trigger alerts when entries are hit, or when the stop loss or take profit levels are reached.
How to Use
Configure Account & Risk: In the settings, enter your "Account Size" and the "Risk per Trade (%)" you are willing to take on the entire position.
Set Trade Direction: Choose either "LONG" or "SHORT".
Input Price Levels: Manually enter the prices for your entries (Entry 1, 2, 3), your "Stop Loss Price," and an "Initial TP Reference." The initial TP is used to calculate the target profit in dollars.
Distribute Position Weight: Assign weights to each entry (e.g., 50% for Entry 1, 30% for Entry 2, 20% for Entry 3). The total should sum to 100.
Monitor the Trade: Use the info panel and on-chart visuals to track the trade's progress. The script will show your average price as entries are filled and update the dynamic take-profit level accordingly.
Understanding the Calculations
Weighted Position Sizing: The script calculates sizes for each entry so that if all entries are filled and the stop loss is hit, your total loss will equal your predefined risk amount. It intelligently allocates size based on the distance of each entry from the stop loss and the weight you assign to it.
Dynamic Take Profit: The "Initial TP Reference" is used only to calculate a target profit in dollars based on your first entry's size. The script then calculates a dynamic TP line on your chart. This line adjusts based on your average entry price as positions are filled, ensuring that if price reaches this level, you will realize your original target dollar profit, regardless of how many entries were filled.
On-Chart Elements
Price Lines: Blue lines for entries, a red line for the stop loss, and a green line for the dynamic take profit.
Labels: Display the calculated quantity for each entry, the total risk amount at the stop loss, and the target profit amount at the take profit.
Average Price: Yellow circles plot your live average entry price as the position is built.
Info Panel: A comprehensive table showing live trade status, current quantity, average price, and projected profit/loss. The panel changes color to green on a TP hit and red on an SL hit.

Position Size Calculator + Live R/R Panel — SMC/ICT (@PueblaATH)Position Size + Live R/R Panel — SMC/ICT (@PueblaATH)
Position Size + Live R/R Panel — SMC/ICT (@PueblaATH) is a professional-grade risk management and execution module built for Smart Money Concepts (SMC) and ICT Traders who require accurate, repeatable, institution-style trade planning.
This tool delivers precise position sizing, R:R modeling, leverage and margin projections, fee-adjusted PnL outcomes, and real-time execution metrics—all directly on the chart. Optimized for crypto, forex, and futures, it provides scalpers, day traders, and swing traders with the clarity needed to execute high-quality trades with confidence and consistency.
What the Indicator Does
Institutional Position Sizing Engine
Calculates position size based on account balance, % risk, and SL distance.
Supports custom minimum lot size rounding across crypto, FX, indices, and derivatives.
Intelligent direction logic (Auto / Long / Short) based on SMC/ICT structure.
Advanced Risk/Reward & Profit Modeling
Real-time R:R ratio using actual rounded position size.
Live PnL readout that updates with price movements.
Gross & net profit projections with full fee deduction.
Execution Planning with Draggable Levels
Entry, SL, and TP levels fully draggable for fast scenario modeling.
Automatic projected lines backward/forward with clean label alignment.
TP and SL tags include % movement from Entry, ideal for SMC/ICT journaling.
Precise modeling of real exchange fee structures
Maker fee per side
Taker fee per side
Mixed fee modes (Maker entry, Taker exit, Average, etc.)
Leverage & Margin Forecasting
Margin requirements displayed for 3 customizable leverage settings.
Helps traders understand capital commitment before executing the trade.
Useful for futures, crypto perps, and CFD setups.
Clean HUD Panel for Rapid Decision-Making
A full professional trading panel displays:
Target & actual risk
Position size
Entry / SL / TP
TP/SL percentage distance
Gross profit
Net profit (after fees)
Fees @ TP and @ SL
Live PnL
Margin requirements
Optimized for SMC & ICT Workflows
Perfect for traders using:
Breakers, FVGs, OBs
Liquidity sweeps
Session models
Precision entries (OTE, Displacement, Rebalancing)
Leverage-based execution (crypto perps, futures)
How to Use It
Attach the indicator to your chart.
Set account balance, risk %, fee model, and leverage presets.
Drag Entry, SL, and TP to shape the setup.
View instant calculations of: Position size; R:R; Net PnL after fees; Margin required
Use it as your pre-trade checklist & execution model.
Originality & Credits
This script is an original creation by @PueblaATH, released under the MPL 2.0 license.
It does not copy, modify, or repackage any existing TradingView code.
All logic—including the fee engine, margin calculator, responsive HUD, dynamic risk model, and visual execution system—is authored specifically for this indicator.

Position Sizing Calculator (Real-Time) - Futures Edition█ SUMMARY
The following indicator is a Position Sizing Calculator based on Average True Range (ATR), originally developed by market technician J. Welles Wilder Jr., intended for real-time trading.
This script utilizes the user's account size, acceptable risk percentage, and a stop-loss distance based on ATR to dynamically calculate the appropriate position size for each trade in real time.
█ BACKGROUND
Developed for use on the Micro E-mini Nasdaq-100 futures (MNQ), this script provides traders with continuously updated dynamic position sizes. It enables traders to instantly determine the exact number of contracts to use when entering a trade while staying within their acceptable risk tolerance.
This real-time position sizing tool helps traders make well-informed decisions when planning trade entries and calculating maximum stop-loss levels, ultimately enhancing risk management.
█ USER INPUTS
Trading Account Size: Total dollar value of the user's trading account.
Acceptable Risk (%): Maximum percentage of the trading account that the user is willing to risk per trade.
ATR Multiplier for Stop-Loss: Multiplier used to determine the distance of the stop-loss from the current price, based on the ATR value.
ATR Length: The length of the lookback period used to calculate the ATR value.
Show Target Risk Row: Toggle to hide/show the Target Risk Row
SL Levels Display: Option to see Both, Long Only, Short Only, or None of the Stop Loss Level Values.
Contract Point Value ($): Point value per contract. Tooltip highlights common values.
Tick Size: Minimum Price Movement (Default set to 0.25)
Minimum Contracts: Override the Minimum Contracts per trade to a user selected value.
(May Exceed User's Target Risk)

XRP CrossChain Momentum EngineThis is a strategy with stop loss 3% , leverage 4 and no pyramiding. It works great with XRP and other coins with similar price, but i suggest XRP. Profit in 1 year around 900% and profit in 2 years around 2000% as you can see in the pictures. I have initial capital 1000 but it can change.

ATR Risk Display - Multi FuturesWhat This Does
I got tired of manually calculating my ATR stops and risk for different futures contracts, especially when switching between ES, NQ, and their micro versions. This indicator automatically detects what futures symbol you're trading and shows you the exact tick count and dollar risk for your stop loss.
The Problem It Solves
If you trade futures with ATR-based stops, you know the hassle:
Different contracts have different tick values
You need to calculate position risk in dollars
Switching between symbols means redoing all the math
Renko charts make it even more confusing since ATR needs to come from regular candles
This handles all of that automatically.
Key Features
Auto-detects futures symbols - ES, NQ, YM, RTY, GC, CL, and all the micros (MES, MNQ, etc.)
Shows everything you need in one line: ATR(timeframe) × multiplier = X ticks ($XXX)
Works on Renko charts - pulls ATR from regular timeframe charts (super important if you use Renko)
Adjustable position sizing - set your contract count and see total risk instantly
Clean, minimal display - just the info you need, no clutter
How to Use
Add it to any futures chart
Set your preferred ATR timeframe (I use 5-minute)
Set your ATR multiplier (I use 1.5x for my stops)
Set your contract size
That's it - the indicator handles the rest
The display will show something like: "ES ATR(5) × 1.5 = 12 ticks ($150)"
Settings Explained
ATR Timeframe: What timeframe to calculate ATR from (always uses regular candles, even on Renko)
ATR Multiplier: How many ATRs for your stop (1.5 is common, 2.0 for wider stops)
Number of Contracts: Your position size for risk calculation
Auto-Detect Symbol: Leave on unless you want to manually override
Supported Futures
Full size: ES, NQ, YM, RTY, GC, CL, ZB, ZN, 6E, 6J
Micros: MES, MNQ, MYM, M2K, MGC, MCL
Notes
Made this primarily for my own ES trading but figured others might find it useful
The tick values are based on standard CME specs
If you trade other futures, you can modify the code to add them
Works great alongside level indicators for risk management
Why This Exists
I use ATR trailing stops on all my trades and got tired of doing mental math every time I switched between charts or contracts. Especially useful if you trade both full-size and micro contracts - the risk difference is huge and easy to mess up.
Hope this helps your trading! Feel free to suggest improvements.

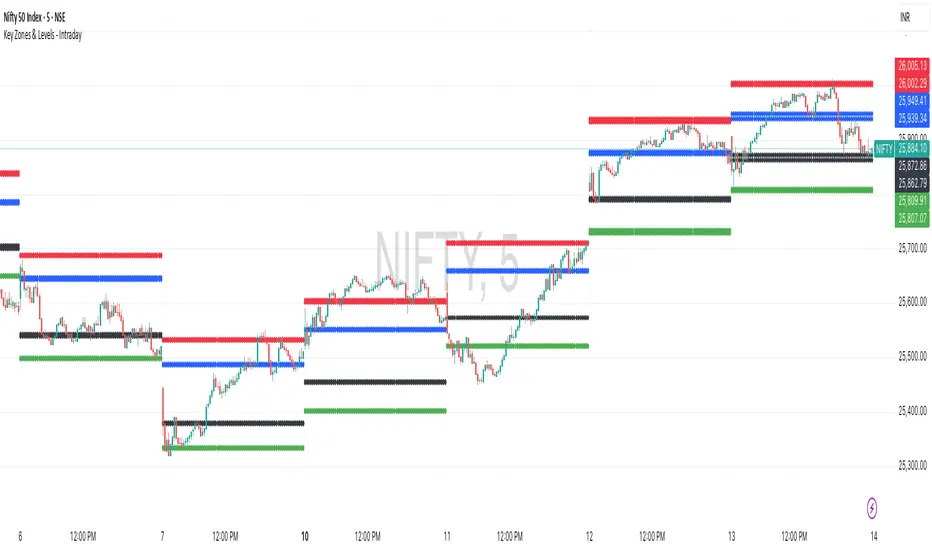
Key Zones & Levels - IntradayThis indicator provides key zones and levels for the day.
The levels are constant for the day and no re-painting.
The levels are plotted at 9:15pm IST for Indian stock market trading.
Use these levels with RSI for a perfect reversal setup with small stop loss.
Work perfectly for all types of market - Indices, stocks, commodity, futures.
Join my channel to support me - whatsapp.com
Exponential Moving Average + ATR MTF [YSFX]Description:
This indicator is a reupload of a previously published EMA + ATR tool, updated and enhanced after a house rule violation to provide additional features and a cleaner, more versatile experience for traders.
It combines trend analysis and volatility measurement into one intuitive tool, allowing traders to visualize market direction, dynamic support and resistance, and adaptive risk levels—all in a clean, minimal interface.
The indicator calculates a customizable moving average (MA) type—EMA, SMA, WMA, HMA, RMA, DEMA, TEMA, VWMA, LSMA, or KAMA—and surrounds it with ATR-based bands that expand and contract with market volatility. This creates a dynamic envelope around price, helping traders identify potential breakouts, pullbacks, or high-probability entry/exit zones.
Advanced Features:
Multiple MA types: Supports all major moving averages, including advanced options like KAMA, DEMA, and TEMA.
KAMA customization: Adjustable fast and slow lengths for precise tuning.
Dual timeframe support: Optionally use separate timeframes for the MA and ATR, or a global timeframe for both.
Dynamic ATR bands: Automatically adjust to market volatility, useful for setting adaptive stop-loss levels.
Optional fill: Shade the area between upper and lower ATR bands for a clear visual representation of volatility.
Flexible for all markets: Works across any timeframe or asset class.
Who It’s For:
This indicator is ideal for trend-following traders, swing traders, and volatility-focused analysts who want to:
Confirm trend direction while accounting for volatility
Identify high-probability trade entries and exits
Implement dynamic, ATR-based stop-loss strategies
Keep charts clean and uncluttered while still capturing key market information
This reuploaded version ensures compliance with platform rules while offering enhanced flexibility and clarity for modern trading workflows.

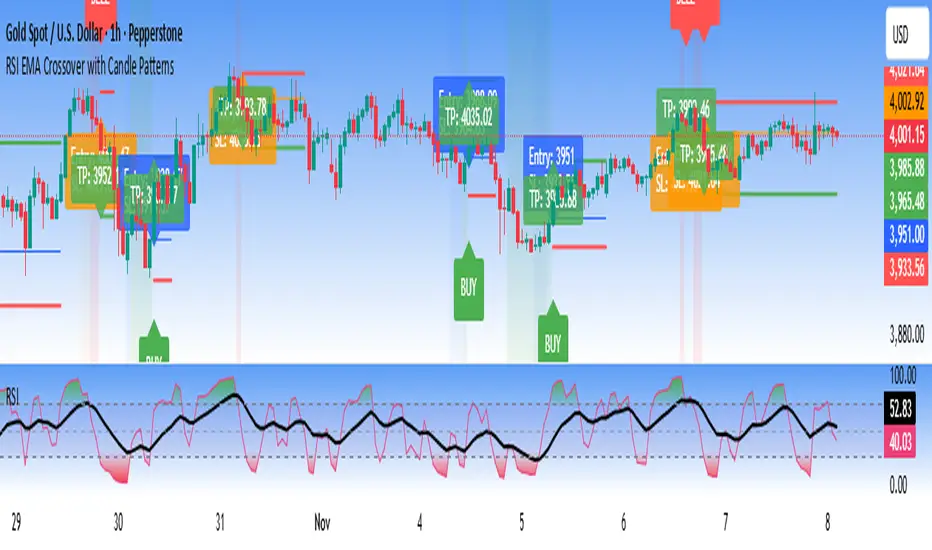
RSI EMA Crossover with Price ActionThe RSI and RSI's EMA Crossover with Price Action (1:2 Risk-Reward) strategy combines Momentum, Trend confirmation, and Basic price-action logic to generate high-probability trade setups with Proper Risk Management.
This script identifies entries when the RSI crosses a key threshold and aligns with an RSI - EMA crossover, confirming Exhaustion of a current trend and Price action confirms the Change in Trend direction. It integrates price action filters to avoid false signals during low-volatility or choppy conditions.
The strategy also includes a risk-management module, setting a fixed 1:2 risk-to-reward ratio — automatically placing a take-profit target twice the size of the stop loss. Also the Stop loss can be adjusted to nearest swing low or last 3 candles Low. to avoid Stoploss hunt.
Features
✅ RSI and EMA crossover confirmation for directional bias
✅ Basic price-action validation (optional filters)
✅ Configurable stop-loss and take-profit levels (default 1:2)
✅ Visual trade markers for entries and exits
Disclaimer: This script is intended for educational and research purposes only. It should not be considered financial advice or a guaranteed trading system. Users are encouraged to test and optimize parameters before using in live markets.
ATR SL/TP Precision Zones (Dots)ATR SL/TP Precision Zones (Dots) is a volatility-based tool designed to help traders set accurate Stop Loss and Take Profit levels based on real market volatility — not fixed pips or emotion.
This indicator uses ATR (Average True Range) multiplied by 1.2 to calculate dynamic distance bands.
Instead of drawing a ribbon or channel, it places simple dots above and below each candle:
Upper Dot (Green) → Suggested Take Profit / Price Stretch Zone
Lower Dot (Red) → Suggested Stop Loss Cushion / Support Expansion Zone
Because ATR measures market volatility, these dots expand during high volatility and tighten during slow markets, helping traders avoid stop-loss hunts and premature exits.
Why This Works
Most traders lose because:
They set SL too close → stopped out by noise
They set TP too far → price never reaches it
This tool calibrates those distances automatically based on real price movement behavior.
ATR = volatility
Volatility = market breathing room
This indicator ensures your trade has room to breathe, increasing win consistency.
Best Use Cases
Scalping
Swing trading
Trend continuation entries
Reversal confirmations with support/resistance
Works on Crypto / Forex / Stocks / Futures

ATR Trailing Stop with Entry Date & First-Day MultiplierATR based trailing stop based on a X post of Aksel Kibar.
