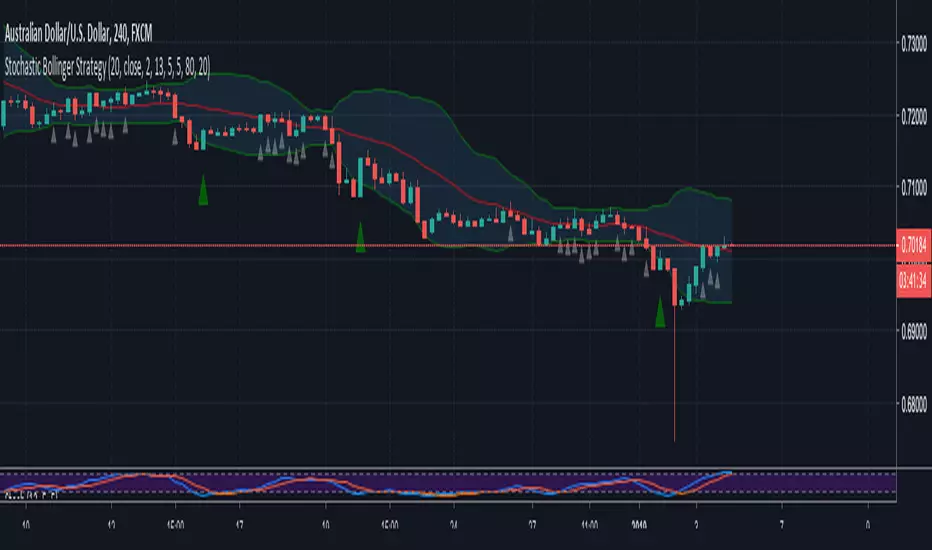
Stochastic Bollinger Strategy (Wicks)See 'Stochastic Bollinger Strategy' for details on how this works.
tips/donations are always appreciated venmo @rick-munoz
Osilator Stochastic

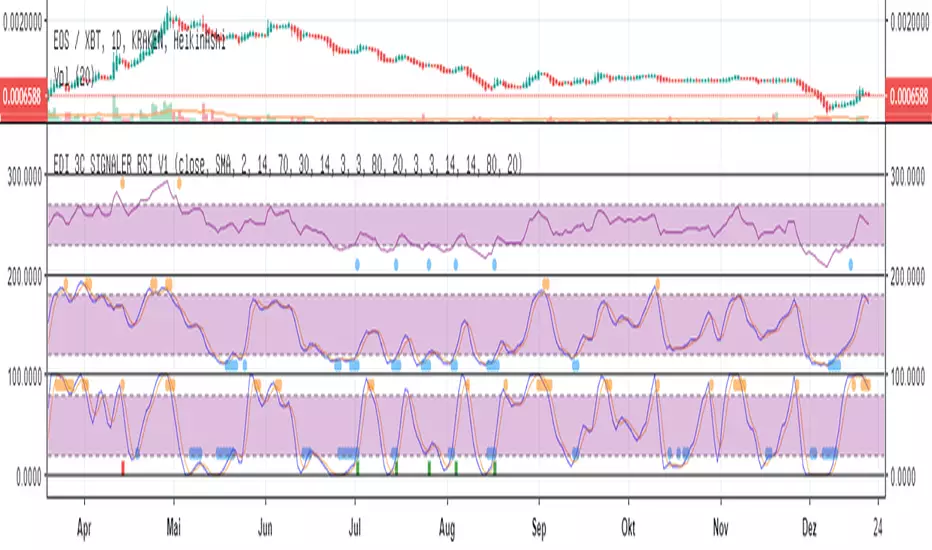
Eds Bot Signaler on Basis of RSI Stoch StochRSIEDS AWESOME BOT SIGNALER
Specially for use with e.g. 3commas or autoview
But can also be used just in normal manual (visual) mode
This Script is very early Beta. Works for visual manual use....
and also for 3Commas Bot as "Signaler" (how to connect with Bot, see the docu on 3commas).
... but can use as Signaler for any Bot who is able to get Tradingview sms-mails. (e.g. autoview)
It combines RSI, Stoch and Stoch-RSI.
You can choose normal RSI, or " returning RSI " (signals when leaving the sell/buy-zone. much higher profits with this)
You can choose how many of the indicators are needed to "fire".
You can choose if one of the indicators is a "must"
For Stoch & Stoch-RSI you can Choose sma or ema calculations of the moving average.
All the Values speak for themselves, if you are used to technical analyses (stay away in the moment, if you dont know, what rsi, stoch etc is used.
The Signals are also shown in the chart, the single ones, but also the combined which fires the Bot-Signal (shown as green and red column-candle at bottom)
Enjoy !! Free use in the moment.
More detailled Explanation in the future. Just play around!
If you wanna give something back:
BTC: 15buigKjh4JYnuVwcEWiYMpYvP3Lbp4ypL
Stochastic Bollinger StrategyBollinger defaults = 20, close, 2
Stochastic defaults = 13, 5, 5
Buy Signal (GREEN triangle):
BULLISH candle formed
Candle OPEN is LESS than LOWER Bollinger Band
Stochastic (K) is LESS than 20
Sell Signal (RED triangle):
BEARISH candle formed
Candle OPEN is GREATER than UPPER Bollinger Band
Stochastic (K) is GREATER than 80
Read more about the strategy and where to set buy stops and sell stops here: swing-trading-strategies.com
[Delphi] Power Tools OscillatorsFEATURES
- RSI
- Stochastic
//******************************************************************************
// Power Tools Oscillators
// Inner Version 1.0 04/12/2018
// Developer: iDelphi
//------------------------------------------------------------------------------
// 04/12/2018 Added RSI
// 04/12/2018 Added Stochastic
//******************************************************************************

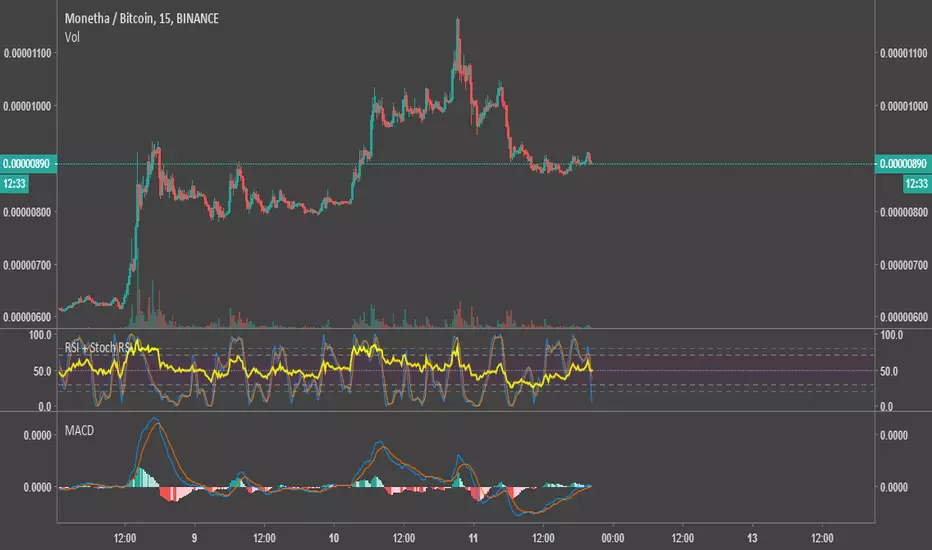
Relative Strength Index & Stochastic RSIThis script calculates both RSI (Relative Strength Index) and Stock (Stochastic) RSI Indicators, and plots them with a distinctive background on the same graph. The colors were chosen to be very easy on the eyes.
I published it as a way to give back to this community. Use your own judgement when trading, I am not responsible for any losses resulting from the use of my script.
Feel free to modify the script with no attribution.
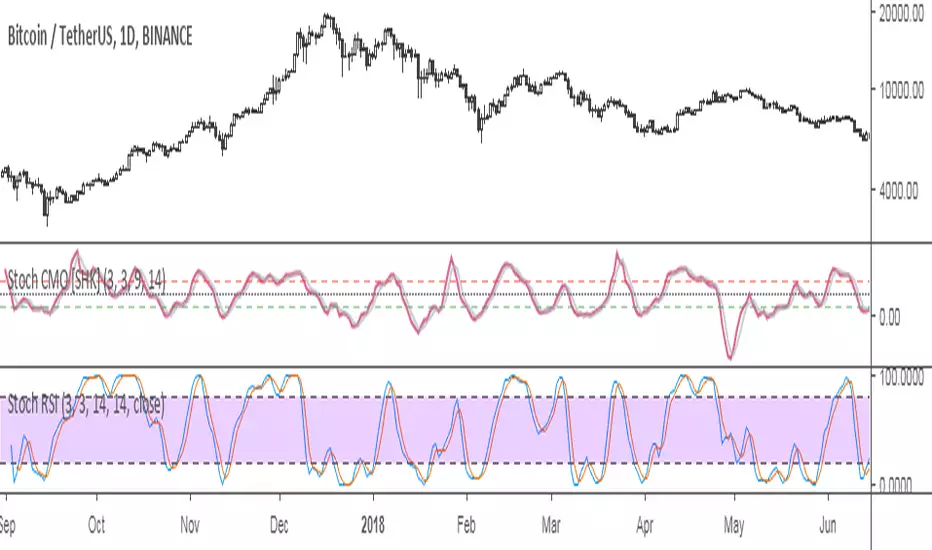
StochCMO - Stochastic CMO [SHK]StochCMO is the combination of Stochastic and CMO (Chande Momentum Oscillator).
The StochCMO is an indicator used in technical analysis that ranges between zero and one and is created by applying the Stochastic Oscillator formula to a set of Chande Momentum Oscillator (CMO) values rather than standard price data. Using CMO values within the Stochastic formula gives traders an idea of whether the current CMO value is overbought or oversold - a measure that becomes specifically useful when the CMO value is confined between its signal levels of 20 and 80.
Usage:
The usage of StochCMO is similar to StochRSI.
StochCMO vs StochRSI:
The difference between these indicators can be realized by comparing CMO & RSI:
CMO is similar to the Relative Strength Index (RSI) except that it measures momentum on both up days and down days. The CMO also does not use internal smoothing and thus does not obscure short-term extremes in momentum. As a result, the CMO often reaches over bought and over sold areas more regularly than momentum indicators, such as the RSI, that have internal smoothing.
Hope it helps you.
VolumeS as stochv1just to show a concept . I use volume S to make it as stoch and add to it MTF function
B=buy
S=sell
D=down
if you do not like the MTF fuction just remove it from code or put the time frame of graph to be exact as MTF one
I did not add alert as it just a concept idea , to make it more complex it easy if you add more indicators to it and then compare the signals
have fun

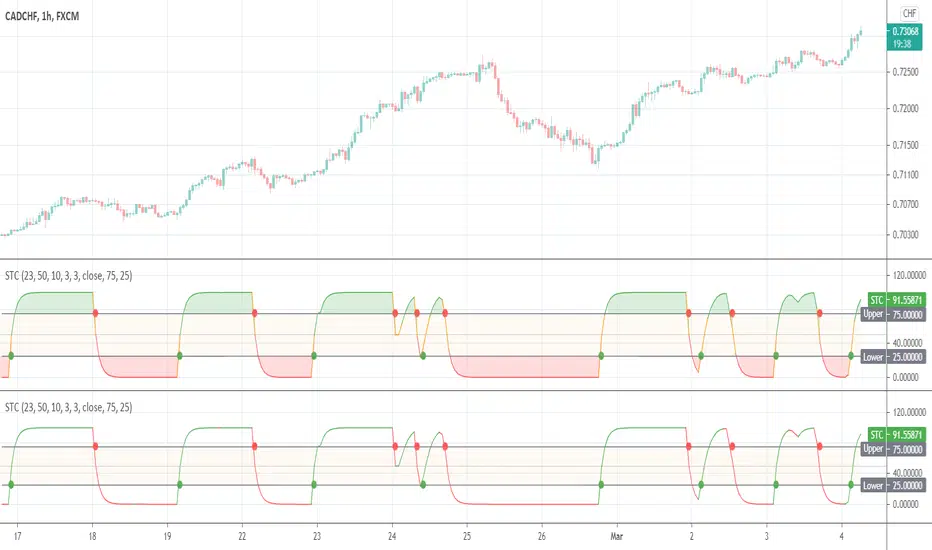
Schaff Trend CycleThis indicator was originally developed by Doug Schaff in the 1990s (published in 2008).
RSI / Stoch / SRSI / MFI / Aroon Overlay [SigmaDraconis]Combines 4 popular indicators (RSI, Stoch, SRSI, MFI) and 1 peculiar one (Aroon) in 1 for those who want to save indicators but not only.
This is an evolution of my (simpler) "RSI / Stoch / Stoch RSI (SRSI) Overlay " that you can find on my scripts.
Added bands for oversold/overbought areas (70/30 common for RSI and 80/20 for SRSI and MFI), as well as a middle 50 horizontal line.
Neutral bands around 55-45 added as well that can be hidden for less clutter. I also recommend a more transparent coloring for these since Pine script doesn't allow default transparency for horizontal lines.
By default only RSI and Stoch are activated, you can activate Aroon, MFI and SRSI on the inputs window.
Some extra notes:
* RSI, Stoch and MFI can help to strengthen one's decision as well as Aroon to predict a possible trend reversal, SRSI can show when RSI has high probability of being topped or bottomed when oversold/overbought but don't forget to look at volume and how the trend progresses that can keep SRSI above 80 or below 20 while RSI and price continues to trend, divergences are most helpful here to find possible reversal areas.
* This chart depicts some interesting divergences, as well as Stoch tops and bottoms and confluences between RSI/MFI and Stoch on some over-extended tops and bottoms that shown being good reversal zones.
RSI resistances are shown as well, failing to break above 60 or the neutral zone (this is a bearish BTC trend chart after all) or failing to gain support to break up certain levels (RSI notes a more bullish trend when consistently above 60 and more bearish below 40).
If you like it and use it to profit, please tip me below :)
Tip jars:
BTC: 15nMBiEGVrdGcu9C1h6QRcTNRvugHkqrMQ
ETH: 0xC33845946c48B61fBCbEA0367ec2238CaF2b73bc
BTS: sigma-draconis

Inside Bar Alert I need help!!! I created the alert but it triggering during the formation not once it has printed. Does anyone know who to make it trigger the alert once the inside bar is complete and make it plot an arrow when the inside bar has formed?

My Script with stoch and bb
I created a script to buy / sell when stoch oversold, overbought and BB when the price is above the upper BB and falls below it.
I want to combine with rsi but I do not know how to do it
and I want to put SL to avoid the trap of market.
Do you have any way to help me optimize the scirpt?

Stochastic MomentumStochastic Momentum adds shorter and longer term Stochastic movements on the same chart to indicate relative momentum for short and slightly longer term outlooks.
Can be used like a regular Stochastic indicator for overbought / oversold levels, divergence and additionally also the crossing of the shorter (blue) and longer (orange) levels.
It is a leading indicator and often signals early moves of momentum, which may or may not translate into the same price movements.

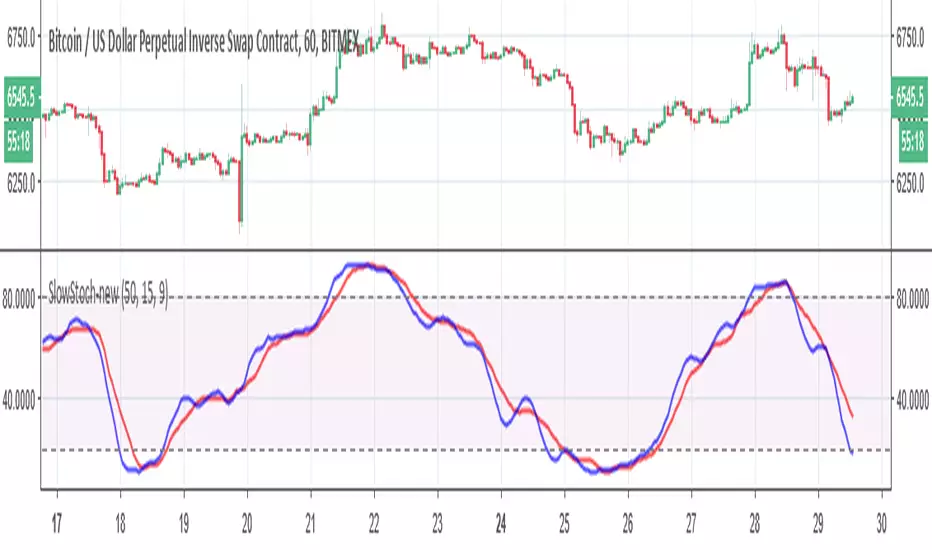
Slow Stochastic-newnothing fancy here, just some modification to the old stoch to make it more realistic
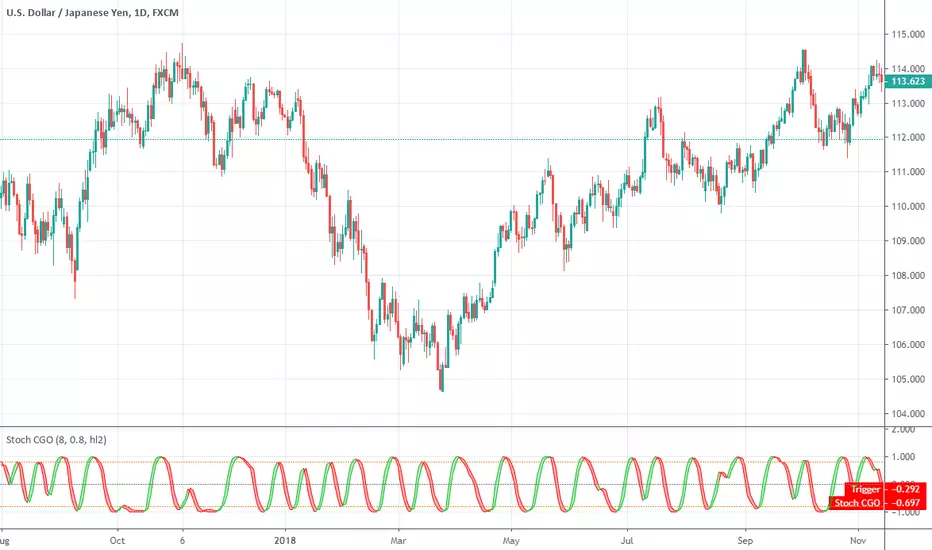
Stochastic CG Oscillator (Center of Gravity)Stochastic CG Oscillator (Center of Gravity) script.
This indicator was originally developed by John F. Ehlers (see his book `Cybernetic Analysis for Stocks and Futures`, Chapter 8: `Stochasticization and Fisherization of Indicators`).
Ehlers StochasticEhlers Stochastic script.
This indicator was originally developed by John F. Ehlers (Stocks & Commodities V. 32:1: Predictive And Successful Indicators).
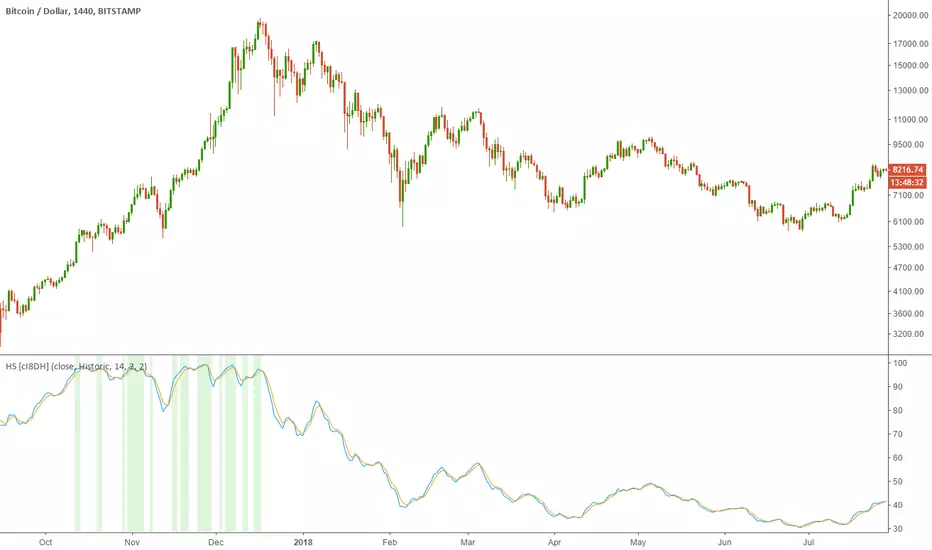
Historical Stochatic (HS) [cI8DH]This indicator calculates historical stochastic (HS). It also includes the standard stoch. HS works similar to the standard stochastic . The difference is that the standard stochastic has a set look-back period, while HS looks as far back as the first bar. This allows identifying ATHs and ATLs (background highlights green and red respectively). Basically, HS shows inverse retracement from ATL to ATH in percentage.
This indicator works best on non-range bound indicators such as MACD. As you can see in the chart below, MACD is not useful to compare against periods that price is wildly different. Applying HS on MACD fixes this issue (To achieve the same results, add MACD indicator > change the source to MACD on HS settings > since MACD is a smoothed indicator, smoothing length is set to 1. To get similar smoothing length on the signal as in standard MACD, set %D to 5 smoothed MA which is equivalent to 9 EMA smoothing on standard MACD).
Gain/Loss Moving Average (GLMA) is another indicator that can benefit well from HS. GLMA is the simplest and probably the most accurate momentum indicator. But it is not as convenient as RSI since it is not range bound. HS can make it range bound without compromising its accuracy. (To achieve the same results, add GLMA indicator > change the source to GLMA on HS settings > set %K length to 1).
Chart below shows HS applied to Accumulation/Distribution Money Flow (ADMF) and compares it against its range bound counter part, ADP.
Conclusion:
There are different ways of making an indicator normalized or range bound. Some indicators use RSI's approach (positive changes MA / all changes MA) such as MFI, CMF, ADP. This approach is great but the divergence near extremes can sometimes be misleading. HS fixes this problem as long as the indicator is not making a new ATH or ATL . When it does make new ATH or ATL , this indicator gives a warning to avoid using it for detecting divergence.
PS:
It is a bit geeky to apply HS on other indicators. I will publish some of my indicators with HS and standard stoch built-in. So stay tuned if u r interested in this indicator.
Read more here about using stochastic
www.tradingview.com(STOCH)
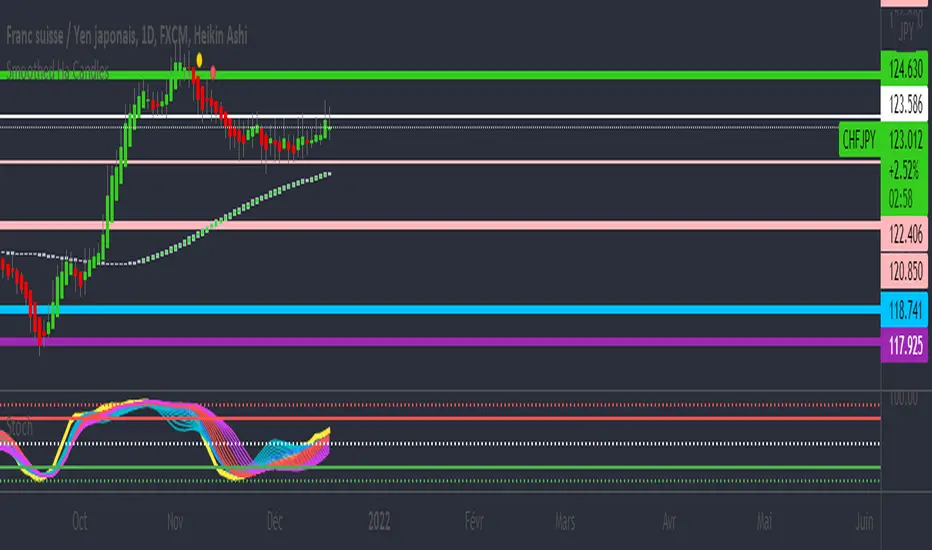
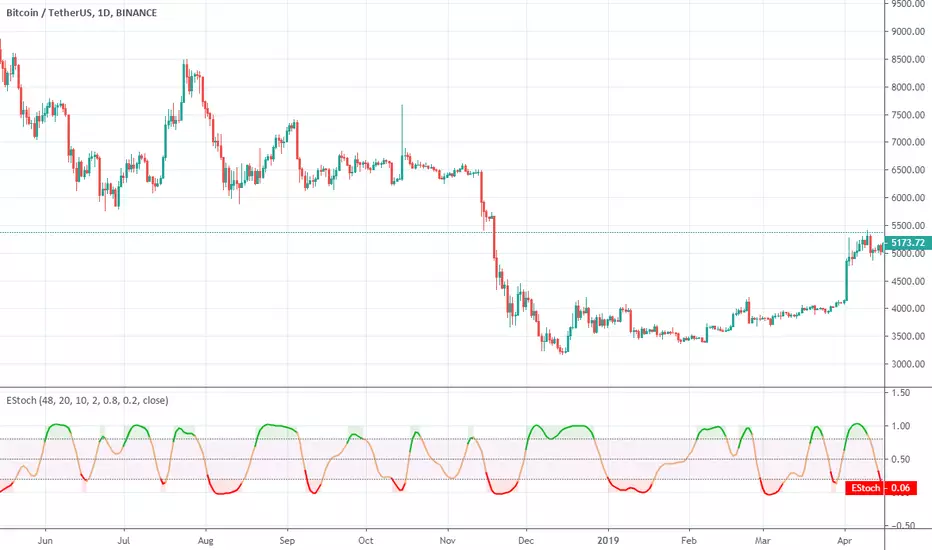
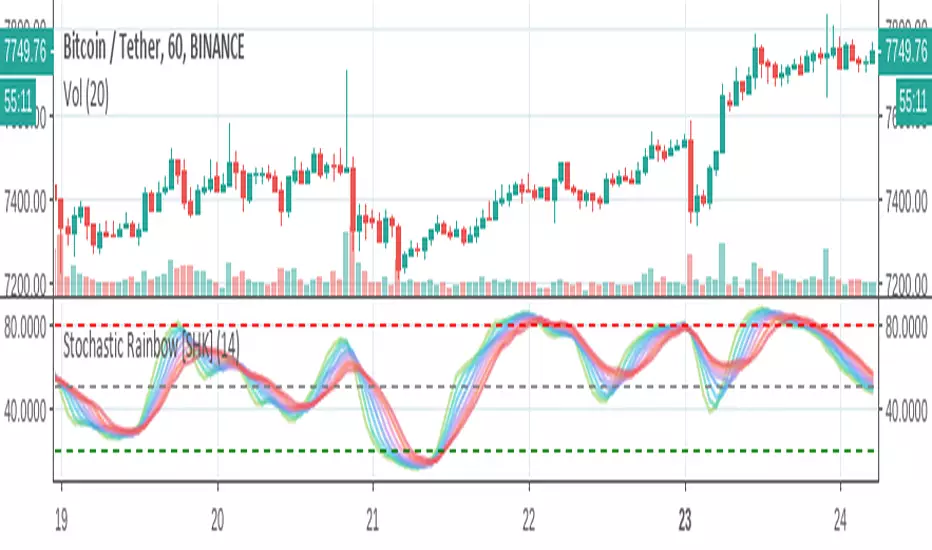
Stochastic Rainbow [SHK]Stochastic Rainbow consists of 8 stochastic oscillators with different speeds. So It has lower noises and better visualization comparing to simple stochastic.
I welcome comments, suggestions.
3x Stoch on Given Time-frame v0.13x stochastic oscillators (K only), set the timeframe you want the stoch to be based off.
Smooth and length is hard-coded to give easy view of the time-frame set in the indicator arguments shown on-chart. Edit these in the Pine Editor as needed.
smooth = 6
length1 = 5
length2 = 8
length3 = 14

Stoch Momentum Index* Original code from UCSgears.
* Added circles for when Stoch MI and signal line crosses.

Inverse Fisher Transform on STOCHASTIC (modified graphics)Modified the graphic representation of the script from John Ehlers - From California, USA, he is a veteran trader. With 35 years trading experience he has seen it all. John has an engineering background that led to his technical approach to trading ignoring fundamental analysis (with one important exception). John strongly believes in cycles. He’d rather exit a trade when the cycle ends or a new one starts. He uses the MESA principle to make predictions about cycles in the market and trades one hundred percent automatically.
In the show John reveals:
• What is more appropriate than trading individual stocks
• The one thing he relies upon in his approach to the market
• The detail surrounding his unique trading style
• What important thing underpins the market and gives every trader an edge
About INVERSE FISHER TRANSFORM:
The purpose of technical indicators is to help with your timing decisions to buy or sell. Hopefully, the signals are clear and unequivocal. However, more often than not your decision to pull the trigger is accompanied by crossing your fingers. Even if you have placed only a few trades you know the drill. In this article I will show you a way to make your oscillator-type indicators make clear black-or-white indication of the time to buy or sell. I will do this by using the Inverse Fisher Transform to alter the Probability Distribution Function (PDF) of your indicators. In the past12 I have noted that the PDF of price and indicators do not have a Gaussian, or Normal, probability distribution. A Gaussian PDF is the familiar bell-shaped curve where the long “tails” mean that wide deviations from the mean occur with relatively low probability. The Fisher Transform can be applied to almost any normalized data set to make the resulting PDF nearly Gaussian, with the result that the turning points are sharply peaked and easy to identify. The Fisher Transform is defined by the equation
1)
Whereas the Fisher Transform is expansive, the Inverse Fisher Transform is compressive. The Inverse Fisher Transform is found by solving equation 1 for x in terms of y. The Inverse Fisher Transform is:
2)
The transfer response of the Inverse Fisher Transform is shown in Figure 1. If the input falls between –0.5 and +0.5, the output is nearly the same as the input. For larger absolute values (say, larger than 2), the output is compressed to be no larger than unity. The result of using the Inverse Fisher Transform is that the output has a very high probability of being either +1 or –1. This bipolar probability distribution makes the Inverse Fisher Transform ideal for generating an indicator that provides clear buy and sell signals.

ShortSqueeze StochasticOscillatorHey!
I made a StochasticOscillator with BITFINEX:BTCUSDLONG & BITFINEX:BTCUSDSHOTS
Hope you enjoy it, and remember it's not about the asset's price, but about the asset's interest with these finantial tools.

Stochastic (Double-Smoothed Bressert)Bressert's Double-Smoothed Stochastic formula, with some extra features. Visual highlighting of overbought/oversold values with dots. On intraday charts you can optionally show the Daily Stochastic instead of using the minutes/hours data.
