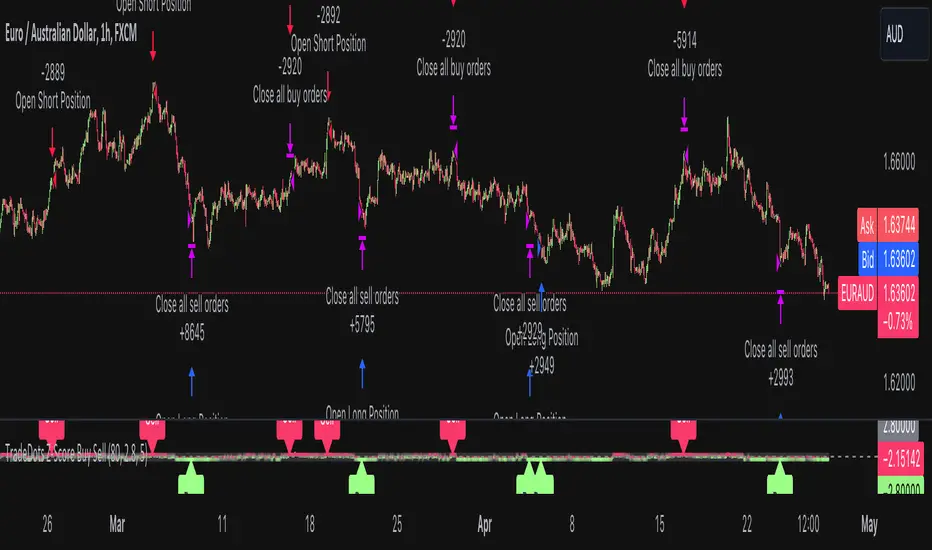
Uptrick: Dynamic Z-Score DivergenceIntroduction
Uptrick: Dynamic Z-Score Divergence is an oscillator that combines multiple momentum sources within a Z-Score framework, allowing for the detection of statistically significant mean-reversion setups, directional shifts, and divergence signals. It integrates a multi-source normalized oscillator, a slope-based signal engine, structured divergence logic, a slope-adaptive EMA with dynamic bands, and a modular bar coloring system. This script is designed to help traders identify statistically stretched conditions, evolving trend dynamics, and classical divergence behavior using a unified statistical approach.
Overview
At its core, this script calculates the Z-Score of three momentum sources—RSI, Stochastic RSI, and MACD—using a user-defined lookback period. These are averaged and smoothed to form the main oscillator line. This normalized oscillator reflects how far short-term momentum deviates from its mean, highlighting statistically extreme areas.
Signals are triggered when the oscillator reverses slope within defined inner zones, indicating a shift in direction while the signal remains in a statistically stretched state. These mean-reversion flips (referred to as TP signals) help identify turning points when price momentum begins to revert from extended zones.
In addition, the script includes a divergence detection engine that compares oscillator pivot points with price pivot points. It confirms regular bullish and bearish divergence by validating spacing between pivots and visualizes both the oscillator-side and chart-side divergences clearly.
A dynamic trend overlay system is included using a Slope Adaptive EMA (SA-EMA). This trend line becomes more responsive when Z-Score deviation increases, allowing the trend line to adapt to market conditions. It is paired with ATR-based bands that are slope-sensitive and selectively visible—offering context for dynamic support and resistance.
The script includes configurable bar coloring logic, allowing users to color candles based on oscillator slope, last confirmed divergence, or the most recent signal of any type. A full alert system is also built-in for key signals.
Originality
The script is based on the well-known concept of Z-Score valuation, which is a standard statistical method for identifying how far a signal deviates from its mean. This foundation—normalizing momentum values such as RSI or MACD to measure relative strength or weakness—is not unique to this script and is widely used in quantitative analysis.
What makes this implementation original is how it expands the Z-Score foundation into a fully featured, signal-producing system. First, it introduces a multi-source composite oscillator by combining three momentum inputs—RSI, Stochastic RSI, and MACD—into a unified Z-Score stream. Second, it builds on that stream with a directional slope logic that identifies turning points inside statistical zones.
The most distinctive additions are the layered features placed on top of this normalized oscillator:
A structured divergence detection engine that compares oscillator pivots with price pivots to validate regular bullish and bearish divergence using precise spacing and timing filters.
A fully integrated slope-adaptive EMA overlay, where the smoothing dynamically adjusts based on real-time Z-Score movement of RSI, allowing the trend line to become more reactive during high-momentum environments and slower during consolidation.
ATR-based dynamic bands that adapt to slope direction and offer real-time visual zones for support and resistance within trend structures.
These features are not typically found in standard Z-Score indicators and collectively provide a unique approach that bridges statistical normalization, structure detection, and adaptive trend modeling within one script.
Features
Z-Score-based oscillator combining RSI, StochRSI, and MACD
Configurable smoothing for stable composite signal output
Buy/Sell TP signals based on slope flips in defined zones
Background highlighting for extreme outer bands
Inner and outer zones with fill logic for statistical context
Pivot-based divergence detection (regular bullish/bearish)
Divergence markers on oscillator and price chart
Slope-Adaptive EMA (SA-EMA) with real-time adaptivity based on RSI Z-Score
ATR-based upper and lower bands around the SA-EMA, visibility tied to slope direction
Configurable bar coloring (oscillator slope, divergence, or most recent signal)
Alerts for TP signals and confirmed divergences
Optional fixed Y-axis scaling for consistent oscillator view
The full setup mode can be seen below:
Input Parameters
General Settings
Full Setup: Enables rendering of the full visual system (lines, bands, signals)
Z-Score Lookback: Lookback period for normalization (mean and standard deviation)
Main Line Smoothing: EMA length applied to the averaged Z-Score
Slope Detection Index: Used to calculate directional flips for signal logic
Enable Background Highlighting: Enables visual region coloring in
overbought/oversold areas
Force Visible Y-Axis Scale: Forces max/min bounds for a consistent oscillator range
Divergence Settings
Enable Divergence Detection: Toggles divergence logic
Pivot Lookback Left / Right: Defines the structure of oscillator pivot points
Minimum / Maximum Bars Between Pivots: Controls the allowed spacing range for divergence validation
Bar Coloring Settings
Bar Coloring Mode:
➜ Line Color: Colors bars based on oscillator slope
➜ Latest Confirmed Signal: Colors bars based on the most recent confirmed divergence
➜ Any Latest Signal: Colors based on the most recent signal (TP or divergence)
SA-EMA Settings
RSI Length: RSI period used to determine adaptivity
Z-Score Length: Lookback for normalizing RSI in adaptive logic
Base EMA Length: Base length for smoothing before adaptivity
Adaptivity Intensity: Scales the smoothing responsiveness based on RSI deviation
Slope Index: Determines slope direction for coloring and band logic
Band ATR Length / Band Multiplier: Controls the width and responsiveness of the trend-following bands
Alerts
The script includes the following alert conditions:
Buy Signal (TP reversal detected in oversold zone)
Sell Signal (TP reversal detected in overbought zone)
Confirmed Bullish Divergence (oscillator HL, price LL)
Confirmed Bearish Divergence (oscillator LH, price HH)
These alerts allow integration into automation systems or signal monitoring setups.
Summary
Uptrick: Dynamic Z-Score Divergence is a statistically grounded trading indicator that merges normalized multi-momentum analysis with real-time slope logic, divergence detection, and adaptive trend overlays. It helps traders identify mean-reversion conditions, divergence structures, and evolving trend zones using a modular system of statistical and structural tools. Its alert system, layered visuals, and flexible input design make it suitable for discretionary traders seeking to combine quantitative momentum logic with structural pattern recognition.
Disclaimer
This script is for educational and informational purposes only. No indicator can guarantee future performance, and trading involves risk. Always use risk management and test strategies in a simulated environment before deploying with live capital.
Standar Deviasi (Volatilitas)

Smarter Money Volume Rejection Blocks [PhenLabs]📊 Smarter Money Volume Rejection Blocks – Institutional Rejection Zone Detection
The Smarter Money Volume Rejection Blocks indicator combines high-volume analysis with statistical confidence intervals to identify where institutional traders are actively defending price levels through volume spikes and rejection patterns.
🔥 Core Methodology
Volume Spike Detection analyzes when current volume exceeds moving average by configurable multipliers (1.0-5.0x) to identify institutional activity
Rejection Candle Analysis uses dual-ratio system measuring wick percentage (30-90%) and maximum body ratio (10-60%) to confirm genuine rejections
Statistical Confidence Channels create three-level zones (upper, center, lower) based on ATR or Standard Deviation calculations
Smart Invalidation Logic automatically clears zones when price significantly breaches confidence levels to maintain relevance
Dynamic Channel Projection extends confidence intervals forward up to 200 bars with customizable length
Support Zone Identification detects bullish rejections where smart money absorbs selling pressure with high volume and strong lower wicks
Resistance Zone Mapping identifies bearish rejections where institutions defend price levels with volume spikes and pronounced upper wicks
Visual Information Dashboard displays real-time status table showing volume spike conditions and active support/resistance zones
⚙️ Technical Configuration
Dual Confidence Interval Methods: Choose between ATR-Based for trend-following environments or StdDev-Based for range-bound statistical precision
Volume Moving Average: Configurable period (default 20) for baseline volume comparison calculations
Volume Spike Multiplier: Adjustable threshold from 1.0 to 5.0 times average volume to filter institutional activity
Rejection Wick Percentage: Set minimum wick size from 30% to 90% of candle range for valid rejection detection
Maximum Body Ratio: Configure body-to-range ratio from 10% to 60% to ensure genuine rejection structures
Confidence Multiplier: Statistical multiplier (default 1.96) for 95% confidence interval calculations
Channel Projection Length: Extend confidence zones forward from 10 to 200 bars for anticipatory analysis
ATR Period: Customize Average True Range lookback from 5 to 50 bars for volatility-based calculations
StdDev Period: Adjust Standard Deviation period from 10 to 100 bars for statistical precision
🎯 Real-World Trading Applications
Identify high-probability support zones where institutional buyers have historically defended price with significant volume
Map resistance levels where smart money sellers consistently reject higher prices with volume confirmation
Combine with price action analysis to confirm breakout validity when price approaches confidence channel boundaries
Use invalidation signals to exit positions when smart money zones are definitively breached
Monitor the real-time dashboard to quickly assess current market structure and active rejection zones
Adapt strategy based on calculation method: ATR for trending markets, StdDev for ranging conditions
Set alerts on confidence level breaches to catch potential trend reversals or continuation patterns
📈 Visual Interpretation Guide
Green Zones indicate bullish rejection blocks where buyers defended with high volume and lower wicks
Red Zones indicate bearish rejection blocks where sellers defended with high volume and upper wicks
Solid Center Lines represent the core rejection price level where maximum volume activity occurred
Dashed Confidence Boundaries show upper and lower statistical limits based on volatility calculations
Zone Opacity decreases as channels extend forward to indicate decreasing confidence over time
Dashboard Color Coding provides instant visual feedback on active volume spike and zone conditions
⚠️ Important Considerations
Volume-based indicators identify historical rejection zones but cannot predict future price action with certainty
Market conditions change rapidly and institutional activity patterns evolve continuously
High volume does not guarantee level defense as market structure can shift without warning
Confidence intervals represent statistical probabilities, not guaranteed price boundaries

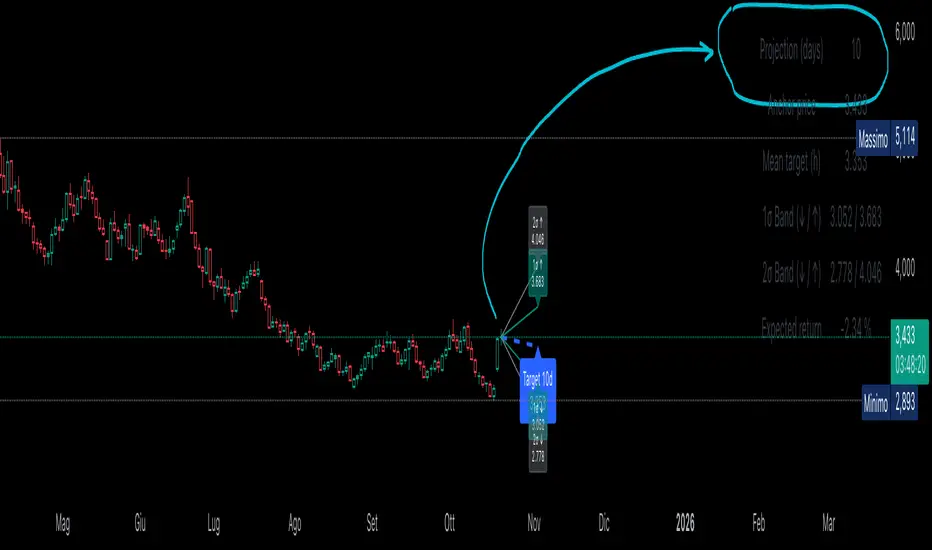
Statistical Projection over N Days (drift + σ) – v1.2 [EN]🧭 Overview
“Statistical Projection over N Days (drift + σ)” is a quantitative forecasting model that estimates the expected future price range of any asset over a chosen horizon (default = 10 days).
It combines average drift (trend direction) and historical volatility (σ) to produce a probabilistic cone of future price movement.
The indicator displays:
a blue dashed line (expected price path),
1σ / 2σ deviation bands (volatility envelopes),
and a summary table with the key forecast values and expected return.
⚙️ Core Logic (Explained Simply)
The indicator analyses recent price behavior to estimate two key elements:
the average daily tendency of the market (called drift), and
the average daily variability (called volatility).
Here’s how it works, step by step:
Measures daily percentage changes (using logarithmic returns) to understand how much the price typically moves from one bar to the next.
It then calculates the average of those returns over a chosen historical window (for example, 70 bars).
If the average is positive → the market has a rising tendency (upward drift).
If the average is negative → the market tends to decline (downward drift).
At the same time, it computes the standard deviation of those returns — this shows how “wide” the movements are, i.e. how volatile the asset is.
Using these two measures — drift and volatility — it estimates where the price is statistically expected to move over the next N bars:
The mean projection (blue dashed line) represents the most likely price path.
The 1σ and 2σ lines (teal and gray) define confidence zones, where price is expected to remain about 68% and 95% of the time, respectively.
The model updates continuously with every new bar, recalculating both drift and volatility, so the projection cone expands, contracts, or changes direction depending on the latest market behavior.
📉 Interpretation of the Blue Line
The blue dashed line (pMean) is the statistical forecast path of price over the next N bars.
🔹 When the blue line is below the current price
The recent drift (average log return) is negative → the model expects a gradual decline.
Interpretation:
The prevailing statistical bias is bearish — the market is expected to move lower toward equilibrium.
🔹 When the blue line is above the current price
The recent drift is positive → the model expects a continued rise.
Interpretation:
The price is statistically likely to trend upward, maintaining momentum in the direction of the current drift.
🔹 When the blue line is sloping upward
The mean projection pMean is rising with each new bar.
Indicates positive drift → the average daily return is positive.
Interpretation:
The asset is in a growth phase; volatility bands act as potential expansion corridors.
🔹 When the blue line is sloping downward
The mean projection pMean decreases bar after bar.
Indicates negative drift → average daily return is negative.
Interpretation:
The asset is in a corrective or declining phase, with volatility determining potential drawdown limits.
🔹 When the blue line is flat
The drift (μ) is approximately zero.
Interpretation:
The model sees no directional bias; price equilibrium dominates.
Expect a sideways range unless new volatility (σ) expansion occurs.
📈 How to Read the Entire Projection
Blue dashed line → expected mean path (most probable price trajectory).
Teal lines (±1σ) → statistically normal range (≈68% of future outcomes).
Gray lines (±2σ) → extreme bounds (≈95% of outcomes).
Labels on the right show exact forecast prices for each band.
If the actual price moves outside the gray 2σ range →
→ it signals volatility breakout or regime shift, meaning the past volatility no longer explains the present movement.
🧮 Summary Table
Located at the top-right corner, it provides:
Field Description
Projection (days) Number of bars used for projection (h).
Anchor price Starting close used for forecast.
Mean target (h) Expected price after h bars (blue line endpoint).
1σ Band (↓ / ↑) 68% confidence interval.
2σ Band (↓ / ↑) 95% confidence interval.
Expected return Projected % change from current close to mean target.
Colors can be customized — for example:
white headers,
aqua for anchor price,
lime for target,
orange/red for σ bands,
yellow for expected return.
🧠 Practical Meaning
Blue Line State Interpretation Bias
Above price, rising Ongoing positive drift Bullish
Below price, falling Negative drift Bearish
Flat, near price Neutral drift Sideways
Steep slope Strong directional momentum Trend confirmation
Price > +2σ band Excess volatility / overextension Possible correction
Price < −2σ band Undervaluation or panic Reversion likely
⚡ Summary
Aspect Description
Purpose Statistical forecast of expected price range
Method Drift (μ) + Volatility (σ) from log returns
Outputs Mean projection (blue), 1σ & 2σ bands, expected return
Interpretation Directional bias from blue line and its slope
Recommended timeframe Daily
Best use Trend confirmation, probabilistic target estimation, volatility analysis.
Fractal Manipulation Projections [keypoems]Fractal Manipulation Projections 0-30 minutes
This study draws statistical hourly rails that help visualize how far price normally travels during the first half‑hour of each hour.
How it works
On the first bar of every clock hour (New York time) the script records the hourly open.
It then looks up the historical mean (μ) and standard deviations (σ) of (open - low for bearish| high - open for bullish candles) of the first 5 / 10 / 15 / 20 / 25 / 30‑minute candle that followed that open.
Lines are plotted at ±0.5 σ, ±1 σ and ±1.5 σ above and below the open; optional polylines or smooth curves can connect equal‑σ levels.
A small on‑chart table shows the current ±1.5 σ ranges for quick reference.
Data set
Pre‑computed distributions were built from 1‑minute CME Nasdaq‑100 futures (NQ1!) data:
2020‑present for all other hours (default).
2010‑present for the 02:00 hour (optional toggle).
No external data or HTTP requests are used; the script is fully self‑contained.
Inputs
Select which time‑slices (5 m … 30 m) and which σ levels to draw.
Choose straight or Catmull‑Rom curves, colors, line styles, and how many past hours (1‑6) remain visible.
Intended use
These projections do not predict direction or supply trade signals; they simply show where price would lie if it moved a typical ±σ distance from the hourly open. Use them as a contextual volatility gauge alongside your own strategy.
For educational purposes only. Nothing in this script constitutes financial advice. Past performance‑based statistics do not guarantee future results.

Kernel Regression Bands SuiteMulti-Kernel Regression Bands
A versatile indicator that applies kernel regression smoothing to price data, then dynamically calculates upper and lower bands using a wide variety of deviation methods. This tool is designed to help traders identify trend direction, volatility, and potential reversal zones with customizable visual styles.
Key Features
Multiple Kernel Types: Choose from 17+ kernel regression styles (Gaussian, Laplace, Epanechnikov, etc.) for smoothing.
Flexible Band Calculation: Select from 12+ deviation types including Standard Deviation, Mean/Median Absolute Deviation, Exponential, True Range, Hull, Parabolic SAR, Quantile, and more.
Adaptive Bands: Bands are calculated around the kernel regression line, with a user-defined multiplier.
Signal Logic: Trend state is determined by crossovers/crossunders of price and bands, coloring the regression line and band fills accordingly.
Custom Color Modes: Six unique color palettes for visual clarity and personal preference.
Highly Customizable Inputs: Adjust kernel type, lookback, deviation method, band source, and more.
How to Use
Trend Identification: The regression line changes color based on the detected trend (up/down)
Volatility Zones: Bands expand/contract with volatility, helping spot breakouts or mean-reversion opportunities.
Visual Styling: Use color modes to match your chart theme or highlight specific market states.
Credits:
Kernel regression logic adapted from:
ChartPrime | Multi-Kernel-Regression-ChartPrime (Link in the script)
Disclaimer
This script is for educational and informational purposes only. Not financial advice. Use at your own risk.

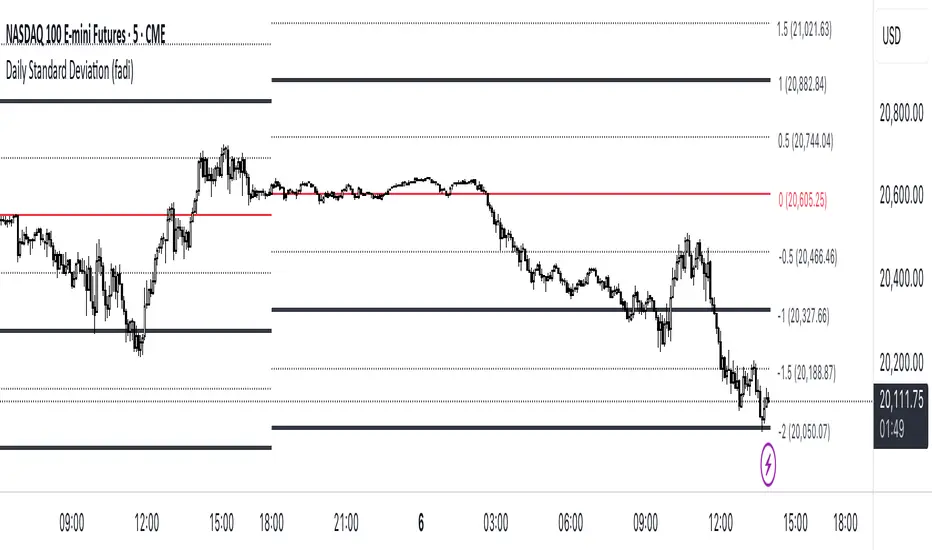
Standard Deviation (fadi)The Standard Deviation indicator uses standard deviation to map out price movements. Standard deviation measures how much prices stray from their average—small values mean steady trends, large ones mean wild swings. Drawing from up to 20 years of data, it plots key levels using customizable Fibonacci lines tied to that standard deviation, giving traders a snapshot of typical price behavior.
These levels align with a bell curve: about 68% of price moves stay within 1 standard deviation, 95% within roughly 2, and 99.7% within roughly 3. When prices break past the 1 StDev line, they’re outliers—only 32% of moves go that far. Prices often snap back to these lines or the average, though the reversal might not happen the same day.
How Traders Use It
If prices surge past the 1 StDev line, traders might wait for momentum to fade, then trade the pullback to that line or the average, setting a target and stop.
If prices dip below, they might buy, anticipating a bounce—sometimes a day or two later. It’s a tool to spot overstretched prices likely to revert and/or measure the odds of continuation.
Settings
Higher Timeframe: Sets the Higher Timeframe to calculate the Standard Deviation for
Show Levels for the Last X Days: Displays levels for the specified number of days.
Based on X Period: Number of days to calculate standard deviation (e.g., 20 years ≈ 5,040 days). Larger periods smooth out daily level changes.
Mirror Levels on the Other Side: Plots symmetric positive and negative levels around the average.
Fibonacci Levels Settings: Defines which levels and line styles to show. With mirroring, negative values aren’t needed.
Background Transparency: Turn on Background color derived from the level colors with the specified transparency
Overrides: Lets advanced users input custom standard deviations for specific tickers (e.g., NQ1! at 0.01296).

Standard Deviation Lines v1.0Overview
The Standard Deviation Lines v1.0 indicator is designed to provide a statistical approach to market volatility by plotting multiple standard deviation levels based on price action. This tool helps traders identify key price levels where the market may experience significant reactions, making it useful for trend analysis, support/resistance identification, and volatility-based trading strategies.
Key Features
✅ Dynamic Standard Deviation Levels: Calculates and plots up to ±3 standard deviation levels, giving traders a clear view of price dispersion and potential overbought/oversold areas.
✅ Quadrant-Based Deviation Zones: Divides standard deviation ranges into smaller, meaningful levels (e.g., 0.214, 0.382, 0.50, 0.618, 0.786) for a granular analysis of price movements.
✅ VIX Integration for Volatility Adjustment: Incorporates CBOE:VIX to dynamically adjust standard deviation levels based on market volatility.
✅ Weekly vs. Daily Mode: Users can toggle between weekly and daily standard deviation calculations to adapt to different trading strategies.
✅ Auto-Updating Levels: The indicator refreshes at market close (17:00), ensuring traders work with the latest price data.
✅ Customizable Display: Uses color-coded lines to differentiate between positive and negative deviations, with dashed lines for mid-levels and key support/resistance areas.
How to Use
📌 Trend & Volatility Analysis – Higher standard deviation levels indicate strong price movements, helping traders assess trend strength and market volatility.
📌 Reversal & Continuation Signals – Prices reaching extreme standard deviation levels (±2 or ±3) may suggest potential reversals or breakouts.
📌 Support & Resistance Zones – The quadrant-based deviation zones help identify hidden support/resistance areas where price may react.
📌 Risk Management – Traders can use standard deviation bands to set stop-loss and take-profit levels based on statistical price dispersion.
Best For
🔹 Day traders & swing traders looking to incorporate volatility-based strategies.
🔹 Mean reversion traders who capitalize on price returning to statistical averages.
🔹 Momentum traders who want to confirm trend strength and continuation.
Try the Standard Deviation Lines v1.0 now and enhance your market analysis with a statistical edge!
Volume Block Order AnalyzerCore Concept
The Volume Block Order Analyzer is a sophisticated Pine Script strategy designed to detect and analyze institutional money flow through large block trades. It identifies unusually high volume candles and evaluates their directional bias to provide clear visual signals of potential market movements.
How It Works: The Mathematical Model
1. Volume Anomaly Detection
The strategy first identifies "block trades" using a statistical approach:
```
avgVolume = ta.sma(volume, lookbackPeriod)
isHighVolume = volume > avgVolume * volumeThreshold
```
This means a candle must have volume exceeding the recent average by a user-defined multiplier (default 2.0x) to be considered a significant block trade.
2. Directional Impact Calculation
For each block trade identified, its price action determines direction:
- Bullish candle (close > open): Positive impact
- Bearish candle (close < open): Negative impact
The magnitude of impact is proportional to the volume size:
```
volumeWeight = volume / avgVolume // How many times larger than average
blockImpact = (isBullish ? 1.0 : -1.0) * (volumeWeight / 10)
```
This creates a normalized impact score typically ranging from -1.0 to 1.0, scaled by dividing by 10 to prevent excessive values.
3. Cumulative Impact with Time Decay
The key innovation is the cumulative impact calculation with decay:
```
cumulativeImpact := cumulativeImpact * impactDecay + blockImpact
```
This mathematical model has important properties:
- Recent block trades have stronger influence than older ones
- Impact gradually "fades" at rate determined by decay factor (default 0.95)
- Sustained directional pressure accumulates over time
- Opposing pressure gradually counteracts previous momentum
Trading Logic
Signal Generation
The strategy generates trading signals based on momentum shifts in institutional order flow:
1. Long Entry Signal: When cumulative impact crosses from negative to positive
```
if ta.crossover(cumulativeImpact, 0)
strategy.entry("Long", strategy.long)
```
*Logic: Institutional buying pressure has overcome selling pressure, indicating potential upward movement*
2. Short Entry Signal: When cumulative impact crosses from positive to negative
```
if ta.crossunder(cumulativeImpact, 0)
strategy.entry("Short", strategy.short)
```
*Logic: Institutional selling pressure has overcome buying pressure, indicating potential downward movement*
3. Exit Logic: Positions are closed when the cumulative impact moves against the position
```
if cumulativeImpact < 0
strategy.close("Long")
```
*Logic: The original signal is no longer valid as institutional flow has reversed*
Visual Interpretation System
The strategy employs multiple visualization techniques:
1. Color Gradient Bar System:
- Deep green: Strong buying pressure (impact > 0.5)
- Light green: Moderate buying pressure (0.1 < impact ≤ 0.5)
- Yellow-green: Mild buying pressure (0 < impact ≤ 0.1)
- Yellow: Neutral (impact = 0)
- Yellow-orange: Mild selling pressure (-0.1 < impact ≤ 0)
- Orange: Moderate selling pressure (-0.5 < impact ≤ -0.1)
- Red: Strong selling pressure (impact ≤ -0.5)
2. Dynamic Impact Line:
- Plots the cumulative impact as a line
- Line color shifts with impact value
- Line movement shows momentum and trend strength
3. Block Trade Labels:
- Marks significant block trades directly on the chart
- Shows direction and volume amount
- Helps identify key moments of institutional activity
4. Information Dashboard:
- Current impact value and signal direction
- Average volume benchmark
- Count of significant block trades
- Min/Max impact range
Benefits and Use Cases
This strategy provides several advantages:
1. Institutional Flow Detection: Identifies where large players are positioning themselves
2. Early Trend Identification: Often detects institutional accumulation/distribution before major price movements
3. Market Context Enhancement: Provides deeper insight than simple price action alone
4. Objective Decision Framework: Quantifies what might otherwise be subjective observations
5. Adaptive to Market Conditions: Works across different timeframes and instruments by using relative volume rather than absolute thresholds
Customization Options
The strategy allows users to fine-tune its behavior:
- Volume Threshold: How unusual a volume spike must be to qualify
- Lookback Period: How far back to measure average volume
- Impact Decay Factor: How quickly older trades lose influence
- Visual Settings: Labels and line width customization
This sophisticated yet intuitive strategy provides traders with a window into institutional activity, helping identify potential trend changes before they become obvious in price action alone.

Daily Standard Deviation (fadi)The Daily Standard Deviation indicator uses standard deviation to map out daily price movements. Standard deviation measures how much prices stray from their average—small values mean steady trends, large ones mean wild swings. Drawing from up to 20 years of data, it plots key levels using customizable Fibonacci lines tied to that standard deviation, giving traders a snapshot of typical price behavior.
These levels align with a bell curve: about 68% of price moves stay within 1 standard deviation, 95% within roughly 2, and 99.7% within roughly 3. When prices break past the 1 StDev line, they’re outliers—only 32% of moves go that far. Prices often snap back to these lines or the average, though the reversal might not happen the same day.
How Traders Use It
If prices surge past the 1 StDev line, traders might wait for momentum to fade, then trade the pullback to that line or the average, setting a target and stop.
If prices dip below, they might buy, anticipating a bounce—sometimes a day or two later. It’s a tool to spot overstretched prices likely to revert and/or measure the odds of continuation.
Settings
Open Hour: Sets the trading day’s start (default: 18:00 EST).
Show Levels for the Last X Days: Displays levels for the specified number of days.
Based on X Period: Number of days to calculate standard deviation (e.g., 20 years ≈ 5,040 days). Larger periods smooth out daily level changes.
Mirror Levels on the Other Side: Plots symmetric positive and negative levels around the average.
Fibonacci Levels Settings: Defines which levels and line styles to show. With mirroring, negative values aren’t needed.
Overrides: Lets advanced users input custom standard deviations for specific tickers (e.g., NQ1! at 0.01296).
Prime Bands [ChartPrime]The Prime Standard Deviation Bands indicator uses custom-calculated bands based on highest and lowest price values over specific period to analyze price volatility and trend direction. Traders can set the bands to 1, 2, or 3 standard deviations from a central base, providing a dynamic view of price behavior in relation to volatility. The indicator also includes color-coded trend signals, standard deviation labels, and mean reversion signals, offering insights into trend strength and potential reversal points.
⯁ KEY FEATURES AND HOW TO USE
⯌ Standard Deviation Bands :
The indicator plots upper and lower bands based on standard deviation settings (1, 2, or 3 SDs) from a central base, allowing traders to visualize volatility and price extremes. These bands can be used to identify overbought and oversold conditions, as well as potential trend reversals.
Example of 3-standard-deviation bands around price:
⯌ Dynamic Trend Indicator :
The midline of the bands changes color based on trend direction. If the midline is rising, it turns green, indicating an uptrend. When the midline is falling, it turns orange, suggesting a downtrend. This color coding provides a quick visual reference to the current trend.
Trend color examples for rising and falling midlines:
⯌ Standard Deviation Labels :
At the end of the bands, the indicator displays labels with price levels for each standard deviation level (+3, 0, -3, etc.), helping traders quickly reference where price is relative to its statistical boundaries.
Price labels at each standard deviation level on the chart:
⯌ Mean Reversion Signals :
When price moves beyond the upper or lower bands and then reverts back inside, the indicator plots mean reversion signals with diamond icons. These signals indicate potential reversal points where the price may return to the mean after extreme moves.
Example of mean reversion signals near bands:
⯌ Standard Deviation Scale on Chart :
A visual scale on the right side of the chart shows the current price position in relation to the bands, expressed in standard deviations. This scale provides an at-a-glance view of how far price has deviated from the mean, helping traders assess risk and volatility.
⯁ USER INPUTS
Length : Sets the number of bars used in the calculation of the bands.
Standard Deviation Level : Allows selection of 1, 2, or 3 standard deviations for upper and lower bands.
Colors : Customize colors for the uptrend and downtrend midline indicators.
⯁ CONCLUSION
The Prime Standard Deviation Bands indicator provides a comprehensive view of price volatility and trend direction. Its customizable bands, trend coloring, and mean reversion signals allow traders to effectively gauge price behavior, identify extreme conditions, and make informed trading decisions based on statistical boundaries.

HMA Gaussian Volatility AdjustedOverview
The "HMA Gaussian Volatility Adjusted" indicator introduces a unique combination of HMA smoothing with a Gaussian filter and two components to measure volatility (Average True Range (ATR) and Standard Deviation (SD)). This tool provides traders with a stable and accurate measure of price trends by integrating a Gaussian Filter smoothed using HMA with a customized calculation of volatility. This innovative approach allows for enhanced sensitivity to market fluctuations while filtering out short-term price noise.
Technical Composition and Calculation
The "HMA Gaussian Volatility Adjusted" indicator incorporates HMA smoothing and dynamic standard deviation calculations to build upon traditional volatility measures.
HMA & Gaussian Smoothing:
HMA Calculation (HMA_Length): The script applies a Hull Moving Average (HMA) to smooth the price data over a user-defined period, reducing noise and helping focus on broader market trends.
Gaussian Filter Calculation (Length_Gaussian): The smoothed HMA data is further refined by putting it into a Gaussian filter to incorporate a normal distribution.
Volatility Measurement:
ATR Calculation (ATR_Length, ATR_Factor): The indicator incorporates the Average True Range (ATR) to measure market volatility. The user-defined ATR multiplier is applied to this value to calculate upper and lower trend bands around the Gaussian, providing a dynamic measure of potential price movement based on recent volatility.
Standard Deviation Calculation (SD_Length): The script calculates the standard deviation of the price over a user-defined length, providing another layer of volatility measurement. The upper and lower standard deviation bands (SDD, SDU) act as additional indicators of price extremes.
Momentum Calculation & Scoring
When the indicator signals SHORT:
Diff = Price - Upper Boundary of the Standard Deviation (calculated on a Gaussian filter).
When the indicator signals LONG:
Diff = Price - Upper Boundary of the ATR (calculated on a Gaussian filter).
The calculated Diff signals how close the indicator is to changing trends. An EMA is applied to the Diff to smooth the data. Positive momentum occurs when the Diff is above the EMA, and negative momentum occurs when the Diff is below the EMA.
Trend Detection
Trend Logic: The indicator uses the calculated bands to identify whether the price is moving within or outside the standard deviation and ATR bands. Crosses above or below these bands, combined with positive/negative momentum, signals potential uptrends or downtrends, offering traders a clear view of market direction.
Features and User Inputs
The "HMA Gaussian Volatility Adjusted" script offers a variety of user inputs to customize the indicator to suit traders' styles and market conditions:
HMA Length: Allows traders to adjust the sensitivity of the HMA smoothing to control the amount of noise filtered from the price data.
Gaussian Length: Users can define the length at which the Gaussian filter is applied.
ATR Length and Multiplier: These inputs let traders fine-tune the ATR calculation, affecting the size of the dynamic upper and lower bands to adjust for price volatility.
Standard Deviation Length: Controls how the standard deviation is calculated, allowing further customization in detecting price volatility.
EMA Confluence: This input lets traders determine the length of the EMA used to calculate price momentum.
Type of Plot Setting: Allows users to determine how the indicator signal is plotted on the chart (Background color, Trend Lines, BOTH (backgroung color and Trend Lines)).
Transparency: Provides users with customization of the background color's transparency.
Color Long/Short: Offers users the option to choose their preferred colors for both long and short signals.
Summary and Usage Tips
The "HMA Gaussian Volatility Adjusted" indicator is a powerful tool for traders looking to refine their analysis of market trends and volatility. Its combination of HMA smoothing, Gaussian filtering, and standard deviation analysis provides a nuanced view of market movements by incorporating various metrics to determine direction, momentum, and volatility. This helps traders make better-informed decisions. It's recommended to experiment with the various input parameters to optimize the indicator for specific needs.

Dema Percentile Standard DeviationDema Percentile Standard Deviation
The Dema Percentile Standard Deviation indicator is a robust tool designed to identify and follow trends in financial markets.
How it works?
This code is straightforward and simple:
The price is smoothed using a DEMA (Double Exponential Moving Average).
Percentiles are then calculated on that DEMA.
When the closing price is below the lower percentile, it signals a potential short.
When the closing price is above the upper percentile and the Standard Deviation of the lower percentile, it signals a potential long.
Settings
Dema/Percentile/SD/EMA Length's: Defines the period over which calculations are made.
Dema Source: The source of the price data used in calculations.
Percentiles: Selects the type of percentile used in calculations (options include 60/40, 60/45, 55/40, 55/45). In these settings, 60 and 55 determine percentile for long signals, while 45 and 40 determine percentile for short signals.
Features
Fully Customizable
Fully Customizable: Customize colors to display for long/short signals.
Display Options: Choose to show long/short signals as a background color, as a line on price action, or as trend momentum in a separate window.
EMA for Confluence: An EMA can be used for early entries/exits for added signal confirmation, but it may introduce noise—use with caution!
Built-in Alerts.
Indicator on Diffrent Assets
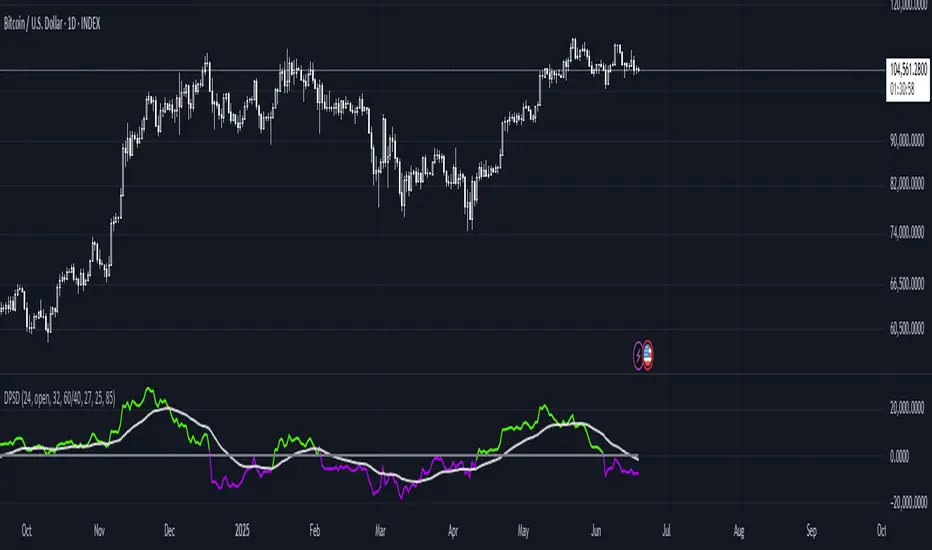
INDEX:BTCUSD 1D Chart (6 high 56 27 60/45 14)
CRYPTO:SOLUSD 1D Chart (24 open 31 20 60/40 14)
CRYPTO:RUNEUSD 1D Chart (10 close 56 14 60/40 14)
Remember no indicator would on all assets with default setting so FAFO with setting to get your desired signal.
STANDARD DEVIATION INDICATOR BY WISE TRADERWISE TRADER STANDARD DEVIATION SETUP: The Ultimate Volatility and Trend Analysis Tool
Unlock the power of STANDARD DEVIATIONS like never before with the this indicator, a versatile and comprehensive tool designed for traders who seek deeper insights into market volatility, trend strength, and price action. This advanced indicator simultaneously plots three sets of customizable Deviations, each with unique settings for moving average types, standard deviations, and periods. Whether you’re a swing trader, day trader, or long-term investor, the STANDARD DEVIATION indicator provides a dynamic way to spot potential reversals, breakouts, and trend-following opportunities.
Key Features:
STANDARD DEVIATIONS Configuration : Monitor three different Bollinger Bands at the same time, allowing for multi-timeframe analysis within a single chart.
Customizable Moving Average Types: Choose from SMA, EMA, SMMA (RMA), WMA, and VWMA to calculate the basis of each band according to your preferred method.
Dynamic Standard Deviations: Set different standard deviation multipliers for each band to fine-tune sensitivity for various market conditions.
Visual Clarity: Color-coded bands with adjustable thicknesses provide a clear view of upper and lower boundaries, along with fill backgrounds to highlight price ranges effectively.
Enhanced Trend Detection: Identify potential trend continuation, consolidation, or reversal zones based on the position and interaction of price with the three bands.
Offset Adjustment: Shift the bands forward or backward to analyze future or past price movements more effectively.
Why Use Triple STANDARD DEVIATIONS ?
STANDARD DEVIATIONS are a popular choice among traders for measuring volatility and anticipating potential price movements. This indicator takes STANDARD DEVIATIONS to the next level by allowing you to customize and analyze three distinct bands simultaneously, providing an unparalleled view of market dynamics. Use it to:
Spot Volatility Expansion and Contraction: Track periods of high and low volatility as prices move toward or away from the bands.
Identify Overbought or Oversold Conditions: Monitor when prices reach extreme levels compared to historical volatility to gauge potential reversal points.
Validate Breakouts: Confirm the strength of a breakout when prices move beyond the outer bands.
Optimize Risk Management: Enhance your strategy's risk-reward ratio by dynamically adjusting stop-loss and take-profit levels based on band positions.
Ideal For:
Forex, Stocks, Cryptocurrencies, and Commodities Traders looking to enhance their technical analysis.
Scalpers and Day Traders who need rapid insights into market conditions.
Swing Traders and Long-Term Investors seeking to confirm entry and exit points.
Trend Followers and Mean Reversion Traders interested in combining both strategies for maximum profitability.
Harness the full potential of STANDARD DEVIATIONS with this multi-dimensional approach. The "STANDARD DEVIATIONS " indicator by WISE TRADER will become an essential part of your trading arsenal, helping you make more informed decisions, reduce risks, and seize profitable opportunities.
Who is WISE TRADER ?
Wise Trader is a highly skilled trader who launched his channel in 2020 during the COVID-19 pandemic, quickly building a loyal following. With thousands of paid subscribed members and over 70,000 YouTube subscribers, Wise Trader has become a trusted authority in the trading world. He is known for his ability to navigate significant events, such as the Indian elections and stock market crashes, providing his audience with valuable insights into market movements and volatility. With a deep understanding of macroeconomics and its correlation to global stock markets, Wise Trader shares informed strategies that help traders make better decisions. His content covers technical analysis, trading setups, economic indicators, and market trends, offering a comprehensive approach to understanding financial markets. The channel serves as a go-to resource for traders who want to enhance their skills and stay informed about key market developments.

E9 Bollinger RangeThe E9 Bollinger Range is a technical trading tool that leverages Bollinger Bands to track volatility and price deviations, along with additional trend filtering via EMAs.
The script visually enhances price action with a combination of trend-filtering EMAs, bar colouring for trend direction, signals to indicate potential buy and sell points based on price extension and engulfing patterns.
Here’s a breakdown of its key components:
Bollinger Bands: The strategy plots multiple Bollinger Band deviations to create different price levels. The furthest deviation bands act as warning signs for traders when price extends significantly, signaling potential overbought or oversold conditions.
Bar Colouring: Visual bar colouring is applied to clearly indicate trend direction: green bars for an uptrend and red bars for a downtrend.
EMA Filtering: Two EMAs (50 and 200) are used to help filter out false signals, giving traders a better sense of the underlying trend.
This combination of signals, visual elements, and trend filtering provides traders with a systematic approach to identifying price deviations and taking advantage of market corrections.
Brief History of Bollinger Bands
Bollinger Bands were developed by John Bollinger in the early 1980s as a tool to measure price volatility in financial markets. The bands consist of a moving average (typically 20 periods) with upper and lower bands placed two standard deviations away. These bands expand and contract based on market volatility, offering traders a visual representation of price extremes and potential reversal zones.
John Bollinger’s work revolutionized technical analysis by incorporating volatility into trend detection. His bands remain widely used across markets, including stocks, commodities, and cryptocurrencies. With the ability to highlight overbought and oversold conditions, Bollinger Bands have become a staple in many trading strategies.

Standard Deviation-Based Fibonacci Band by zdmre This indicator is designed to better understand market dynamics by focusing on standard deviation and the Fibonacci sequence. This indicator includes the following components to assist investors in analyzing price movements:
Weighted Moving Average (WMA) : The indicator creates a central band by utilizing the weighted moving average of standard deviation. WMA provides a more current and accurate representation by giving greater weight to recent prices. This central band offers insights into the general trend of the market, helping to identify potential buying and selling opportunities.
Fibonacci Bands : The Fibonacci bands located above and below the central band illustrate potential support and resistance levels for prices. These bands enable investors to pinpoint areas where the price may exhibit indecisiveness. When prices move within these bands, it may be challenging for investors to discern the market's preferred direction.
Indecisiveness Representation : When prices fluctuate between the Fibonacci bands, they may reflect a state of indecisiveness. This condition is critical for identifying potential reversal points and trend changes. Investors can evaluate these periods of indecisiveness to develop suitable buying and selling strategies.
This indicator is designed to assist investors in better analyzing market trends and supporting their decision-making processes. The integration of standard deviation and the Fibonacci sequence offers a new perspective on understanding market movements.
#DYOR

Sinc Bollinger BandsKaiser Windowed Sinc Bollinger Bands Indicator
The Kaiser Windowed Sinc Bollinger Bands indicator combines the advanced filtering capabilities of the Kaiser Windowed Sinc Moving Average with the volatility measurement of Bollinger Bands. This indicator represents a sophisticated approach to trend identification and volatility analysis in financial markets.
Core Components
At the heart of this indicator is the Kaiser Windowed Sinc Moving Average, which utilizes the sinc function as an ideal low-pass filter, windowed by the Kaiser function. This combination allows for precise control over the frequency response of the moving average, effectively separating trend from noise in price data.
The sinc function, representing an ideal low-pass filter, provides the foundation for the moving average calculation. By using the sinc function, analysts can independently control two critical parameters: the cutoff frequency and the number of samples used. The cutoff frequency determines which price movements are considered significant (low frequency) and which are treated as noise (high frequency). The number of samples influences the filter's accuracy and steepness, allowing for a more precise approximation of the ideal low-pass filter without altering its fundamental frequency response characteristics.
The Kaiser window is applied to the sinc function to create a practical, finite-length filter while minimizing unwanted oscillations in the frequency domain. The alpha parameter of the Kaiser window allows users to fine-tune the trade-off between the main-lobe width and side-lobe levels in the frequency response.
Bollinger Bands Implementation
Building upon the Kaiser Windowed Sinc Moving Average, this indicator adds Bollinger Bands to provide a measure of price volatility. The bands are calculated by adding and subtracting a multiple of the standard deviation from the moving average.
Advanced Centered Standard Deviation Calculation
A unique feature of this indicator is its specialized standard deviation calculation for the centered mode. This method employs the Kaiser window to create a smooth deviation that serves as an highly effective envelope, even though it's always based on past data.
The centered standard deviation calculation works as follows:
It determines the effective sample size of the Kaiser window.
The window size is then adjusted to reflect the target sample size.
The source data is offset in the calculation to allow for proper centering.
This approach results in a highly accurate and smooth volatility estimation. The centered standard deviation provides a more refined and responsive measure of price volatility compared to traditional methods, particularly useful for historical analysis and backtesting.
Operational Modes
The indicator offers two operational modes:
Non-Centered (Real-time) Mode: Uses half of the windowed sinc function and a traditional standard deviation calculation. This mode is suitable for real-time analysis and current market conditions.
Centered Mode: Utilizes the full windowed sinc function and the specialized Kaiser window-based standard deviation calculation. While this mode introduces a delay, it offers the most accurate trend and volatility identification for historical analysis.
Customizable Parameters
The Kaiser Windowed Sinc Bollinger Bands indicator provides several key parameters for customization:
Cutoff: Controls the filter's cutoff frequency, determining the divide between trends and noise.
Number of Samples: Sets the number of samples used in the FIR filter calculation, affecting the filter's accuracy and computational complexity.
Alpha: Influences the shape of the Kaiser window, allowing for fine-tuning of the filter's frequency response characteristics.
Standard Deviation Length: Determines the period over which volatility is calculated.
Multiplier: Sets the number of standard deviations used for the Bollinger Bands.
Centered Alpha: Specific to the centered mode, this parameter affects the Kaiser window used in the specialized standard deviation calculation.
Visualization Features
To enhance the analytical value of the indicator, several visualization options are included:
Gradient Coloring: Offers a range of color schemes to represent trend direction and strength for the moving average line.
Glow Effect: An optional visual enhancement for improved line visibility.
Background Fill: Highlights the area between the Bollinger Bands, aiding in volatility visualization.
Applications in Technical Analysis
The Kaiser Windowed Sinc Bollinger Bands indicator is particularly useful for:
Precise trend identification with reduced noise influence
Advanced volatility analysis, especially in the centered mode
Identifying potential overbought and oversold conditions
Recognizing periods of price consolidation and potential breakouts
Compared to traditional Bollinger Bands, this indicator offers superior frequency response characteristics in its moving average and a more refined volatility measurement, especially in centered mode. These features allow for a more nuanced analysis of price trends and volatility patterns across various market conditions and timeframes.
Conclusion
The Kaiser Windowed Sinc Bollinger Bands indicator represents a significant advancement in technical analysis tools. By combining the ideal low-pass filter characteristics of the sinc function, the practical benefits of Kaiser windowing, and an innovative approach to volatility measurement, this indicator provides traders and analysts with a sophisticated instrument for examining price trends and market volatility.
Its implementation in Pine Script contributes to the TradingView community by making advanced signal processing and statistical techniques accessible for experimentation and further development in technical analysis. This indicator serves not only as a practical tool for market analysis but also as an educational resource for those interested in the intersection of signal processing, statistics, and financial markets.
Related:
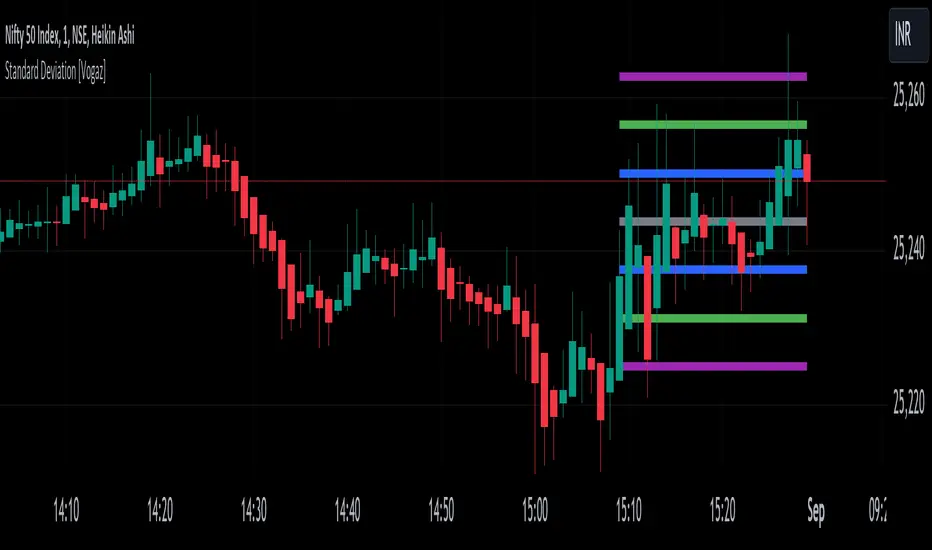
Standard Deviation [Vogaz]This Pine Script indicator provides a visualization of standard deviation bands plotted as fixed horizontal lines on the TradingView chart. The bands are based on the last candle's closing price and are designed to help traders identify potential volatility levels and deviations from the average price.
Features:
Standard Deviation Calculation: The indicator calculates standard deviation based on a user-defined length and source price. It then creates bands around the last candle's close price, showing potential ranges of price volatility.
Customizable Multipliers: You can adjust the multipliers for standard deviation levels (e.g., 1x, 2x, 3x) to set how far the bands are from the closing price.
Adjustable Line Thickness and Length: Customize the thickness and length of the horizontal lines. The lines extend backwards from the current bar to show the range over a user-defined number of bars.
Color Settings: Each band and the closing price line have configurable colors for better visual differentiation. You can set colors for:
Standard Deviation 1 Band (up and down)
Standard Deviation 2 Band (up and down)
Standard Deviation 3 Band (up and down)
Last Close Price Line
Inputs:
Length: Number of periods for calculating standard deviation.
Source: Price type used for standard deviation calculation (e.g., closing price).
StdDev Multipliers: Multipliers for different standard deviation bands.
Line Thickness: Thickness of the horizontal lines.
Line Length: Length of the lines extending from the current bar.
Line Colors: Colors for the bands and the last close price line.
Use Case:
This indicator is useful for traders who want to visualize price volatility and deviations around the last closing price. By analyzing these bands, traders can make informed decisions about potential price movements and market conditions.
How to Use:
Add the Indicator to Your Chart: Apply the indicator to your TradingView chart.
Adjust Settings: Modify the standard deviation multipliers, line thickness, and length according to your preferences.
Analyze the Bands: Use the bands to assess price volatility and identify potential trading signals.
Fear/Greed Zone Reversals [UAlgo]The "Fear/Greed Zone Reversals " indicator is a custom technical analysis tool designed for TradingView, aimed at identifying potential reversal points in the market based on sentiment zones characterized by fear and greed. This indicator utilizes a combination of moving averages, standard deviations, and price action to detect when the market transitions from extreme fear to greed or vice versa. By identifying these critical turning points, traders can gain insights into potential buy or sell opportunities.
🔶 Key Features
Customizable Moving Averages: The indicator allows users to select from various types of moving averages (SMA, EMA, WMA, VWMA, HMA) for both fear and greed zone calculations, enabling flexible adaptation to different trading strategies.
Fear Zone Settings:
Fear Source: Select the price data point (e.g., close, high, low) used for Fear Zone calculations.
Fear Period: This defines the lookback window for calculating the Fear Zone deviation.
Fear Stdev Period: This sets the period used to calculate the standard deviation of the Fear Zone deviation.
Greed Zone Settings:
Greed Source: Select the price data point (e.g., close, high, low) used for Greed Zone calculations.
Greed Period: This defines the lookback window for calculating the Greed Zone deviation.
Greed Stdev Period: This sets the period used to calculate the standard deviation of the Greed Zone deviation.
Alert Conditions: Integrated alert conditions notify traders in real-time when a reversal in the fear or greed zone is detected, allowing for timely decision-making.
🔶 Interpreting Indicator
Greed Zone: A Greed Zone is highlighted when the price deviates significantly above the chosen moving average. This suggests market sentiment might be leaning towards greed, potentially indicating a selling opportunity.
Fear Zone Reversal: A Fear Zone is highlighted when the price deviates significantly below the chosen moving average of the selected price source. This suggests market sentiment might be leaning towards fear, potentially indicating a buying opportunity. When the indicator identifies a reversal from a fear zone, it suggests that the market is transitioning from a period of intense selling pressure to a more neutral or potentially bullish state. This is typically indicated by an upward arrow (▲) on the chart, signaling a potential buy opportunity. The fear zone is characterized by high price volatility and overselling, making it a crucial point for traders to consider entering the market.
Greed Zone Reversal: Conversely, a Greed Zone is highlighted when the price deviates significantly above the chosen moving average. This suggests market sentiment might be leaning towards greed, potentially indicating a selling opportunity. When the indicator detects a reversal from a greed zone, it indicates that the market may be moving from an overbought condition back to a more neutral or bearish state. This is marked by a downward arrow (▼) on the chart, suggesting a potential sell opportunity. The greed zone is often associated with overconfidence and high buying activity, which can precede a market correction.
🔶 Why offer multiple moving average types?
By providing various moving average types (SMA, EMA, WMA, VWMA, HMA) , the indicator offers greater flexibility for traders to tailor the indicator to their specific trading strategies and market preferences. Different moving averages react differently to price data and can produce varying signals.
SMA (Simple Moving Average): Provides an equal weighting to all data points within the specified period.
EMA (Exponential Moving Average): Gives more weight to recent data points, making it more responsive to price changes.
WMA (Weighted Moving Average): Allows for custom weighting of data points, providing more flexibility in the calculation.
VWMA (Volume Weighted Moving Average): Considers both price and volume data, giving more weight to periods with higher trading volume.
HMA (Hull Moving Average): A combination of weighted moving averages designed to reduce lag and provide a smoother curve.
Offering multiple options allows traders to:
Experiment: Traders can try different moving averages to see which one produces the most accurate signals for their specific market.
Adapt to different market conditions: Different market conditions may require different moving average types. For example, a fast-moving market might benefit from a faster moving average like an EMA, while a slower-moving market might be better suited to a slower moving average like an SMA.
Personalize: Traders can choose the moving average that best aligns with their personal trading style and risk tolerance.
In essence, providing a variety of moving average types empowers traders to create a more personalized and effective trading experience.
🔶 Disclaimer
Use with Caution: This indicator is provided for educational and informational purposes only and should not be considered as financial advice. Users should exercise caution and perform their own analysis before making trading decisions based on the indicator's signals.
Not Financial Advice: The information provided by this indicator does not constitute financial advice, and the creator (UAlgo) shall not be held responsible for any trading losses incurred as a result of using this indicator.
Backtesting Recommended: Traders are encouraged to backtest the indicator thoroughly on historical data before using it in live trading to assess its performance and suitability for their trading strategies.
Risk Management: Trading involves inherent risks, and users should implement proper risk management strategies, including but not limited to stop-loss orders and position sizing, to mitigate potential losses.
No Guarantees: The accuracy and reliability of the indicator's signals cannot be guaranteed, as they are based on historical price data and past performance may not be indicative of future results.

Bias Finder [UAlgo]The "Bias Finder " indicator is a tool designed to help traders identify market bias and trends effectively. This indicator leverages smoothed Heikin Ashi candles and oscillators to provide a clear visual representation of market trends and potential reversals. By utilizing higher timeframes and smoothing techniques, the indicator aims to filter out market noise and offer a more reliable signal for trading decisions.
🔶 Key Features
Heikin Ashi Candles: The indicator uses Heikin Ashi candles, a special type of candlestick that incorporates information from the previous candle to potentially provide smoother visuals and highlight potential trend direction.
Oscillator: The indicator calculates an oscillator based on the difference between the smoothed opening and closing prices of a higher timeframe. This oscillator helps visualize the strength of the bias.
Light Teal: Strong bullish trend.
Dark Teal: Weakening bullish trend.
Light Red: Strong bearish trend.
Dark Red: Weakening bearish trend.
Standard Deviation: The indicator can optionally display upper and lower standard deviation bands based on the Heikin Ashi high and low prices. These bands can help identify potential breakout areas.
Oscillator Period: Adjust the sensitivity of the oscillator.
Higher Timeframe: Select a timeframe for the Heikin Ashi candles and oscillator calculations (must be equal to or greater than the chart's timeframe).
Display Options: Choose whether to display Heikin Ashi candles, market bias fill, standard deviation bands, and HA candle colors based on the bias.
Alerts: Enable/disable specific alerts and customize their messages.
🔶 Disclaimer
Use with Caution: This indicator is provided for educational and informational purposes only and should not be considered as financial advice. Users should exercise caution and perform their own analysis before making trading decisions based on the indicator's signals.
Not Financial Advice: The information provided by this indicator does not constitute financial advice, and the creator (UAlgo) shall not be held responsible for any trading losses incurred as a result of using this indicator.
Backtesting Recommended: Traders are encouraged to backtest the indicator thoroughly on historical data before using it in live trading to assess its performance and suitability for their trading strategies.
Risk Management: Trading involves inherent risks, and users should implement proper risk management strategies, including but not limited to stop-loss orders and position sizing, to mitigate potential losses.
No Guarantees: The accuracy and reliability of the indicator's signals cannot be guaranteed, as they are based on historical price data and past performance may not be indicative of future results.

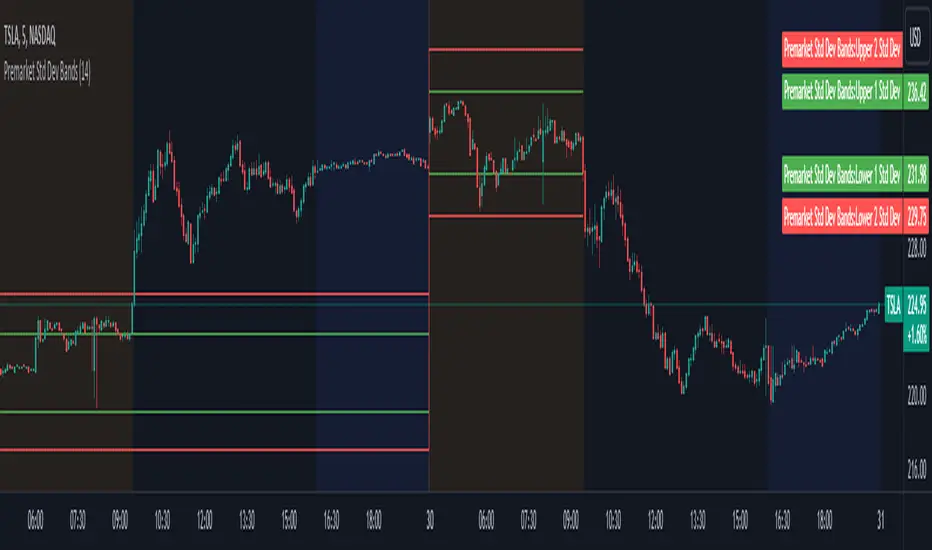
Premarket Std Dev BandsOverview
The Premarket Std Dev Bands indicator is a powerful Pine Script tool designed to help traders gain deeper insights into the premarket session's price movements. This indicator calculates and displays the standard deviation bands for premarket trading, providing valuable information on price volatility and potential support and resistance levels during the premarket hours.
Key Features
Premarket Focus: Specifically designed to analyze price movements during the premarket session, offering unique insights not available with traditional indicators.
Customizable Length: Users can adjust the averaging period for calculating the standard deviation, allowing for tailored analysis based on their trading strategy.
Standard Deviation Bands: Displays both 1 and 2 standard deviation bands, helping traders identify significant price movements and potential reversal points.
Real-Time Updates: Continuously updates the premarket open and close prices, ensuring the bands are accurate and reflective of current market conditions.
How It Works
Premarket Session Identification: The script identifies when the current bar is within the premarket session.
Track Premarket Prices: It tracks the open and close prices during the premarket session.
Calculate Premarket Moves: Once the premarket session ends, it calculates the price movement and stores it in an array.
Compute Averages and Standard Deviation: The script calculates the simple moving average (SMA) and standard deviation of the premarket moves over a specified period.
Plot Standard Deviation Bands: Based on the calculated standard deviation, it plots the 1 and 2 standard deviation bands around the premarket open price.
Usage
To utilize the Premarket Std Dev Bands indicator:
Add the script to your TradingView chart.
Adjust the Length input to set the averaging period for calculating the standard deviation.
Observe the plotted standard deviation bands during the premarket session to identify potential trading opportunities.
Benefits
Enhanced Volatility Analysis: Understand price volatility during the premarket session, which can be crucial for making informed trading decisions.
Support and Resistance Levels: Use the standard deviation bands to identify key support and resistance levels, aiding in better entry and exit points.
Customizable and Flexible: Tailor the averaging period to match your trading style and strategy, making this indicator versatile for various market conditions.
Support/Resistance v2 (ML) KmeanKmean with Standard Deviation Channel
1. Description of Kmean
Kmean (or K-means) is a popular clustering algorithm used to divide data into K groups based on their similarity. In the context of financial markets, Kmean can be applied to find the average price values over a specific period, allowing the identification of major trends and levels of support and resistance.
2. Application in Trading
In trading, Kmean is used to smooth out the price series and determine long-term trends. This helps traders make more informed decisions by avoiding noise and short-term fluctuations. Kmean can serve as a baseline around which other analytical tools, such as channels and bands, are constructed.
3. Description of Standard Deviation (stdev)
Standard deviation (stdev) is a statistical measure that indicates how much the values of data deviate from their mean value. In finance, standard deviation is often used to assess price volatility. A high standard deviation indicates strong price fluctuations, while a low standard deviation indicates stable movements.
4. Combining Kmean and Standard Deviation to Predict Short-Term Price Behavior
Combining Kmean and standard deviation creates a powerful tool for analyzing market conditions. Kmean shows the average price trend, while the standard deviation channels demonstrate the boundaries within which the price can fluctuate. This combination helps traders to:
Identify support and resistance levels.
Predict potential price reversals.
Assess risks and set stop-losses and take-profits.
Should you have any questions about code, please reach me at Tradingview directly.
Hope you find this script helpful!
Vwap Z-Score with Signals [UAlgo]The "VWAP Z-Score with Signals " is a technical analysis tool designed to help traders identify potential buy and sell signals based on the Volume Weighted Average Price (VWAP) and its Z-Score. This indicator calculates the VWAP Z-Score to show how far the current price deviates from the VWAP in terms of standard deviations. It highlights overbought and oversold conditions with visual signals, aiding in the identification of potential market reversals. The tool is customizable, allowing users to adjust parameters for their specific trading needs.
🔶 Features
VWAP Z-Score Calculation: Measures the deviation of the current price from the VWAP using standard deviations.
Customizable Parameters: Allows users to set the length of the VWAP Z-Score calculation and define thresholds for overbought and oversold levels.
Reversal Signals: Provides visual signals when the Z-Score crosses the specified thresholds, indicating potential buy or sell opportunities.
🔶 Usage
Extreme Z-Score values (both positive and negative) highlight significant deviations from the VWAP, useful for identifying potential reversal points.
The indicator provides visual signals when the Z-Score crosses predefined thresholds:
A buy signal (🔼) appears when the Z-Score crosses above the lower threshold, suggesting the price may be oversold and a potential upward reversal.
A sell signal (🔽) appears when the Z-Score crosses below the upper threshold, suggesting the price may be overbought and a potential downward reversal.
These signals can help you identify potential entry and exit points in your trading strategy.
🔶 Disclaimer
The "VWAP Z-Score with Signals " indicator is designed for educational purposes and to assist traders in their technical analysis. It does not guarantee profitable trades and should not be considered as financial advice.
Users should conduct their own research and use this indicator in conjunction with other tools and strategies.
Trading involves significant risk, and it is possible to lose more than your initial investment.

Buy Sell Strategy With Z-Score [TradeDots]The "Buy Sell Strategy With Z-Score" is a trading strategy that harnesses Z-Score statistical metrics to identify potential pricing reversals, for opportunistic buying and selling opportunities.
HOW DOES IT WORK
The strategy operates by calculating the Z-Score of the closing price for each candlestick. This allows us to evaluate how significantly the current price deviates from its typical volatility level.
The strategy first takes the scope of a rolling window, adjusted to the user's preference. This window is used to compute both the standard deviation and mean value. With these values, the strategic model finalizes the Z-Score. This determination is accomplished by subtracting the mean from the closing price and dividing the resulting value by the standard deviation.
This approach provides an estimation of the price's departure from its traditional trajectory, thereby identifying market conditions conducive to an asset being overpriced or underpriced.
APPLICATION
Firstly, it is better to identify a stable trading pair for this technique, such as two stocks with considerable correlation. This is to ensure conformance with the statistical model's assumption of a normal Gaussian distribution model. The ideal performance is theoretically situated within a sideways market devoid of skewness.
Following pair selection, the user should refine the span of the rolling window. A broader window smoothens the mean, more accurately capturing long-term market trends, while potentially enhancing volatility. This refinement results in fewer, yet precise trading signals.
Finally, the user must settle on an optimal Z-Score threshold, which essentially dictates the timing for buy/sell actions when the Z-Score exceeds with thresholds. A positive threshold signifies the price veering away from its mean, triggering a sell signal. Conversely, a negative threshold denotes the price falling below its mean, illustrating an underpriced condition that prompts a buy signal.
Within a normal distribution, a Z-Score of 1 records about 68% of occurrences centered at the mean, while a Z-Score of 2 captures approximately 95% of occurrences.
The 'cool down period' is essentially the number of bars that await before the next signal generation. This feature is employed to dodge the occurrence of multiple signals in a short period.
DEFAULT SETUP
The following is the default setup on EURUSD 1h timeframe
Rolling Window: 80
Z-Score Threshold: 2.8
Signal Cool Down Period: 5
Commission: 0.03%
Initial Capital: $10,000
Equity per Trade: 30%
RISK DISCLAIMER
Trading entails substantial risk, and most day traders incur losses. All content, tools, scripts, articles, and education provided by TradeDots serve purely informational and educational purposes. Past performances are not definitive predictors of future results.