DMI & ST DEV zone intersection [LM]Hello Traders,
This indicator uses two indicators st dev extremes and DMI extremes and visualize intersection of both indicators extreme zones using crosses. It means where cross is rendered intersection of extremes has occurred.
The standard deviation uses the same calculation as my Standard deviation zones Support & Resistance indicator, DMI indicator measures both the strength and direction of a price movement. I am using both indicators to find the intersection of extreme zones between them.
ST DEV settings:
source
tops setting
bottom setting
DMI settings:
length settings
extreme zone setting
Enjoy,
Lukas
Standar Deviasi

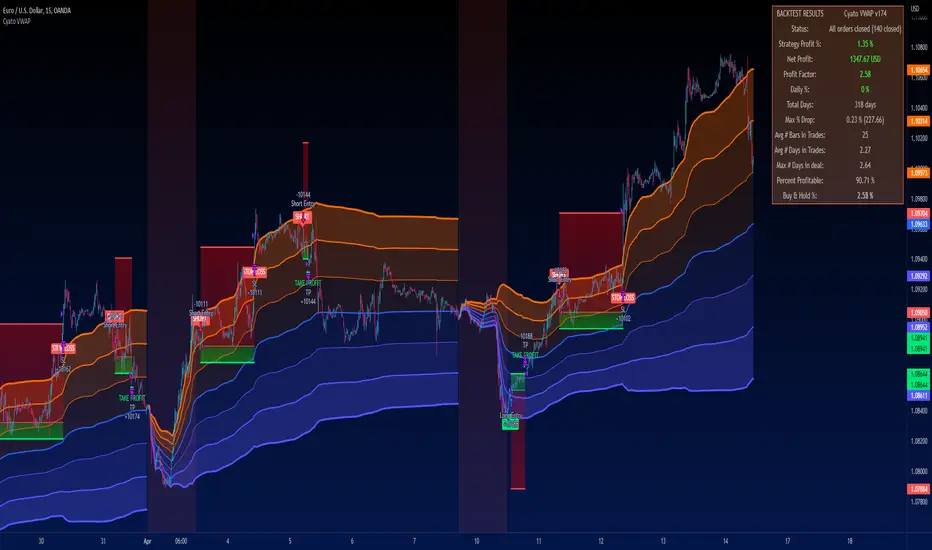
Cyatophilum VWAP StrategyAn indicator to backtest and automate VWAP custom strategies.
Use the Trend Mode to create Swing Trading strategies or Rotation Mode for Intraday Trading.
Configure your strategy using the Entry Condition Builder and Risk Management features, such as Trailing Stop & Take Profits, Safety Orders, and VWAP Exit conditions.
═════════════════════════════════════════════════════════════════════════
█ HOW IT WORKS
VWAP stands for Volume Weighted Average Price.
It is like a simple moving average that takes volume into account.
It is used by a lot of traders since it has everything one needs to know: price and volume.
The cummulated volume calculation resets every session, which interval can be configured.
From that we can calculate the MVWAP and the Standard Deviation Bands and create strategies around that.
█ HOW TO USE
Trend Mode
Trend Mode is the name for strategies built upon VWAP and price/MVWAP cross, most often for Swing Trading on high timeframes trending markets.
The side traded is often long and trying to beat Buy & Hold.
The trade exit can be triggered by a reversal signal (top chart), or a trailing stop (bottom chart) and take profit.
Rotation Mode
This is the mode for Intraday on low timeframes. It will work best on ranging markets.
We use the Standard Deviation Bands to buy/sell the price at overbougth/oversold levels.
The indicator allows to create complex entry conditions such as "Break out of 3rd bands AND break back in 2nd bands" within a certain amount of time.
We will use either the exit options to close the trade when prices reach an opposite band, or the risk management features explained below.
█ FEATURES
• VWAP settings
Configure the VWAP.
• Entry settings
Choose to go long, short, and if the strategy should reverse or not.
• Trend Mode
Choose to create entries from VWAP cross with price or MVWAP.
• Rotation Mode
Configure the 3 bands and build a condition for entry. The multiple inputs allow to add up different events required to trigger an entry, using 3 logical gates that can be linked together using a AND or OR condition. The events being: "break out", "Break back in" or "Just touches" any of the 3 bands. The condition must be met within a certain period of time to be valid.
• Exit settings
Options to exit trades at the end of every session or when the price reaches an opposite band.
• Stop Loss & Take Profit
Configure your stop loss and take profit for long and short trades.
You can also make a trailing stoploss and a trailing take profit.
• Safety Orders (DCA)
Create a strategy with up to 100 safety orders.
Configure their placement and order size using the price deviation, step scale, take profit type (from base order or total volume), and volume scale settings.
Graphics
A Configuration panel with all the indicator settings, useful for sharing a strategy.
A Backtest Results panel with buy & Hold Comparator.
█ ALERTS
Configure your alert messages for all events in the indicator settings.
Then click "Add Alert". In the popup window, select the option "alert() function calls only", give the alert a name and you are good to go!
█ BACKTEST RESULTS
The backtest settings used in this snapshot are the following:
Initial Capital: 10 000€
Order size: 10% equity
Commission: 0.1€ per order
Slippage : 10 ticks
Please read the author instructions below for access.
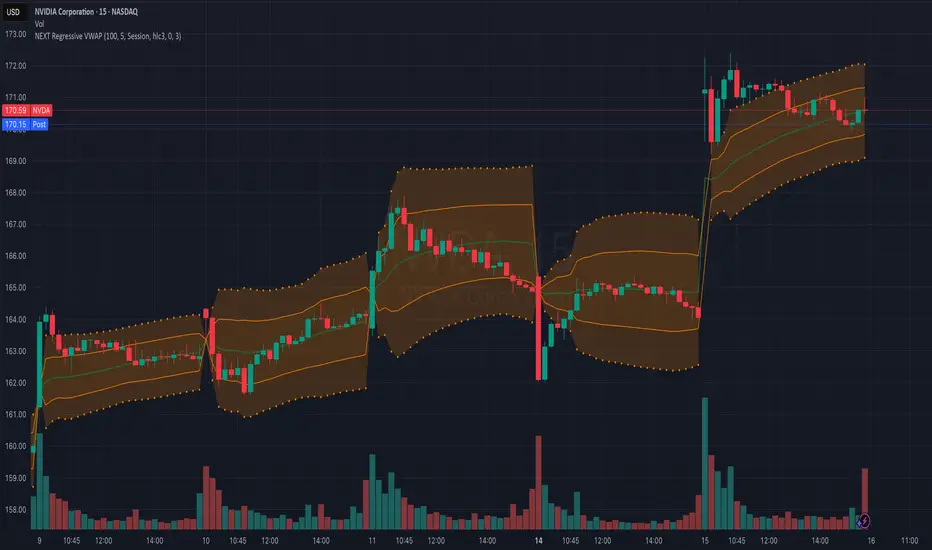
NEXT Regressive VWAPOverview:
This version of the Volume-Weighted Average Price (VWAP) indicator features an extended algorithm, which, in addition to volume and price, also incorporates regression analysis. The result is a more responsive, often leading VWAP slope with a degree of statistical predictability built in. Just like with the original VWAP, NEXT Regressive VWAP offers two optional Standard Deviation bands that parallel it. These can be set to any deviation level, with the default being 1 and -1, indicating one standard deviation above and one below Regressive VWAP, respectively.
Below is a screenshot comparing NEXT Regressive VWAP (green) to the original VWAP (blue) on CME_MINI:ES1! M3 chart.
Application and Strategy Ideas:
Price above NEXT Regressive VWAP is interpreted to have a bullish bias, and below, bearish. You can use TradingView's native Set Alert functionality to be notified, in real-time, when price crosses Regressive VWAP, and/or any of its standard deviation bands. Another popular "probability play" strategy is to scalp price when it crosses under the upper band (short) and crosses over the lower band (long). The screenshot below visualizes such a strategy on NASDAQ:QQQ M1 chart:
Input Parameters:
There are 3 groups of input.
Regression Settings
Length - controls the length of time (in bars) for regression analysis with higher values yielding smoother, more responsive values.
Regression Weighting - controls the degree of regression analysis incorporated into VWAP, with 5 being average, 0-4 less, 6-10 more. The higher the value, the more responsive the Regressive VWAP curve.
VWAP Settings
Anchor Period - controls the origin of VWAP calculations, start of session being the default.
Source - data used for calculating the VWAP, typically HLC/3, but can be used with other price formats and data sources as well.
Offset - shifting of the VWAP line forward (+) or backward (-).
Standard Deviation Bands Settings
Calculate Bands - checking this will add 2 bands, each equidistant (by the amount of Multiplier) from the NEXT Regressive VWAP line.
Bands Multiplier - standard deviation multiplier, with 1 being the default
Signals and Alerts:
Here is how to set price (close) crossing NEXT Regressive VWAP alerts: open a chart, attach NEXT Regressive VWAP, and right-click on chart -> Add Alert. Condition: Symbol e.g. ES (close) >> Crossing >> Regressive VWAP >> VWAP >> Once Per Bar Close.
STDev BandsReally simple script for dynamic support and resistance. Takes means over last 1440 bars (1440 minutes in a day) and calculates seven stdevs up and down.

M.Right_Top & Bottom Finder 1.0Thank you @Lazybear for the calculations for squeeze and BB, and all of the other great pine-coders who inspired me to create my own indicator to share!
This is the result of hours of work learning to code pine and tweaking until everything fits exactly what I was looking for.
After using it for a while and seeing the benefits personally, I figured now might be a good time to share with everyone while we are in such great market volatility, maybe I can save you some losses.
Basically, my indicator is meant to use volatility and standard deviations to show you the top and bottom of trends.
It does indeed work on lower timeframes, I typically use it on 5m, 30m, 4hr, and 1d.
What to look for:
When it detects the trend bottoming it will send a green histogram bar down, I also created a different shade green for even more likely bottoms.
When it detects the top of the trend it will send a red bar up, I have a brighter red for more certain tops.
The length of the histogram bar is also an indication as well. Sometimes there will be a reversal while still just showing the gray bar.
I just added alerts, so hopefully those work. If not, I will update.
Let me know if you have any questions, and enjoy.
Cheers!

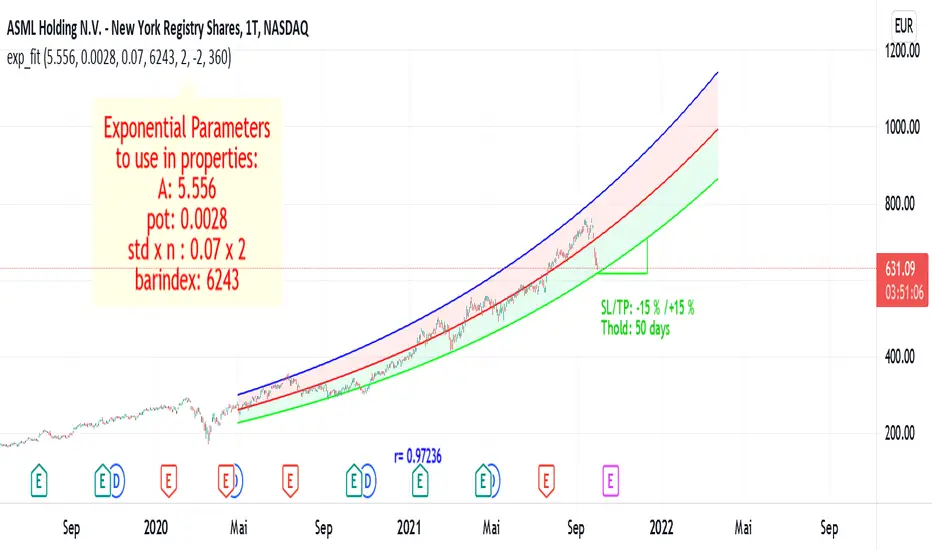
Exponential Regression Channel with novel volatilityThis code is a modified version of the built-in "linear regression" script of Tradingviews which can be plotted correctly on logarithmic charts
The log reg code of Forza was adjusted by altustro to generate an exponential regression (or a correct linear regression on the log scale, this is equivalent).
The standard deviation in the log scale is a better volatility measure which we call novola, and which defines the trend channel displayed in addition to the main indicator.
The exponential regression slope and channel also defines the typical holding time of the stock and the SL/TP boundaries, which are calculated and displayed at the last bar.
The display works both in log and regular scale. But only in the log scale it can be compared to the linear extension, which can also be plotted when activated in the properties.
The underlying exponential fit can not be displayed in regular scale as only lines can be plotted by TV. But with the related script Exponental Regression also the exponential regression can be exactly displayed using a workaround.

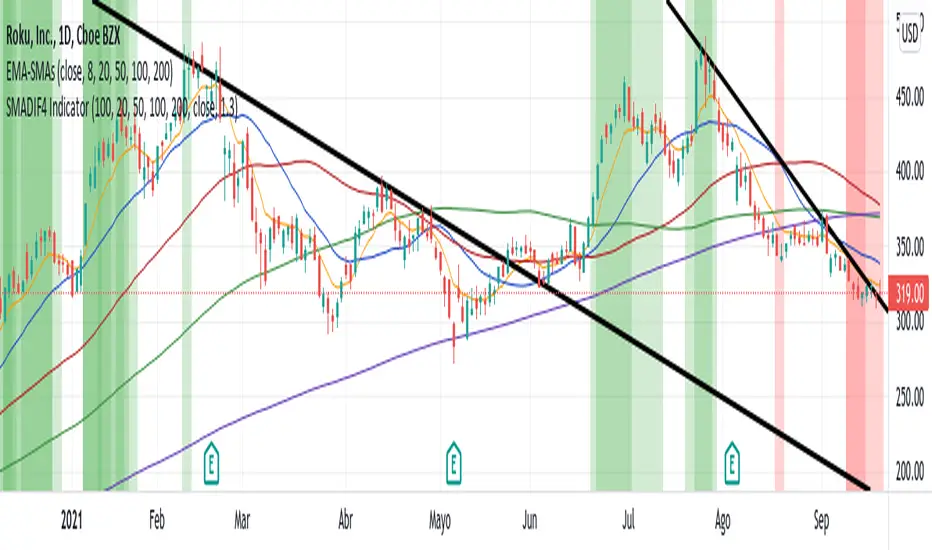
SMADIF4 IndicatorIt shows a percentage difference between close and 4-SMA, 20, 50, 100 and 200. As it turns greener, the stock is more expensive, and vice versa, it turns redder when it becomes cheaper relative to the SMA. It will print the green backgraound as long as the bar closes above the 200 SMA and red as long as the bar closes below the 200 SMA. It uses by default 1.3 sigma to discriminate non-representative values and 100 bars in the past.
Bar StatisticsThis script calculates and displays some bar statistics.
For the bar length statistics, it takes every length of upper or lower movements and calculates their average (with SD), median, and max. That way, you can see whether there is a bias in the market or not.
Eg.: If for 10 bars, the market moved 2 up, then 1 down, then 3 up, then 2 down, and 2 up, the average up bars length would be at 2.33, while the average for the down length would be at 1.5, showing that upper movements last longer than down movements.
For the range statistics, it takes the true range of each bar and calculates where the close of the bar is in relation to the true low of it. So if the closing of the bar is at 10.0, the low is at 9.0, and the high is at 10.2, the candle closed in the upper third of the bar. This process is calculated for every bar and for both closing prices and open prices. It is very useful to locate biasses, and they can you a better view of the market, since for most of the time a bar will open on an extreme and close on another extreme.
Eg.: Here on the DJI, we can see that for most of the time, a month opens at the lower third (near the low) and closes at the upper third (near the high). We can also see that it is very difficult for a month to open or close on the middle of the candle, showing how important the first and the last day are for determining the trend of the rest of the month.

Exponential RegressionIn Tradingview it is not possible to actually display arbitrary non-linear functions retrospectively.
Series objects can only depend on the current or past bars
Thus, while regression is possible, display of a non-linear curve into the past is not possible
This script is a workaround to be able to still display an exponential fit of the last n bars.
It is based on a linear regression of the log(close). The parameters of this regression are printed in the label.
To create the correct plot, these parameters have to be written into the properties of the indicator.
The functions displayed follow the expression exp(A)* exp(pot*t+d)
where d =0 for the center line, and d = +-std * upperMult for the upper and lower line respectiveley.
The parameters of the function are:
amplitude in log scale A
exponent of the exponential function pot
standard deviation of the linear regression std
number of bars of the current chart bindex
multiplicator of the std of the upper and lower exponential line upperMult and lowerMult +
This code is a version of the built-in "linear regression" script of Tradingview alztered by Forza so it can be plotted correctly on logarithmic charts
The code of Forza was further adjusted by altustro to be able to plot the full exponential curve also in regular scale
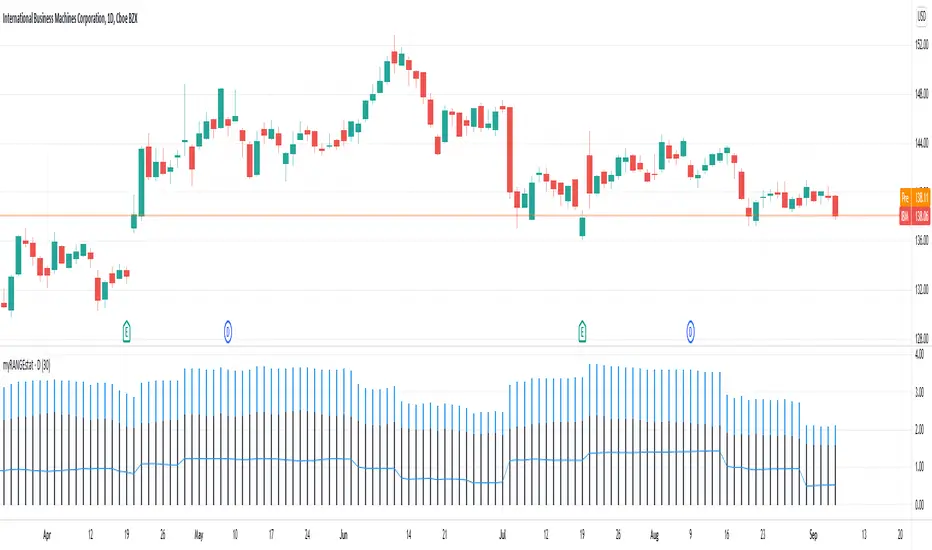
myRangestatCalculates the average daily range as well as the standard deviation of the daily range over a given period.
Adding both values gives you a statistical range (bottom to top or top to bottom) in which price can be expected to move.
[KL] Double Bollinger Bands Strategy (for Crypto/FOREX)This strategy uses a setup consisting of two Bollinger Bands based on the 20 period 20-SMA +/-
(a) upper/lower bands of two standard deviations apart, and
(b) upper/lower bands of one standard deviation apart.
We consider price at +/- one standard deviation apart from 20-SMA as the "Neutral Zone".
If price closes above Neutral Zone after a period of consolidation, then it's an opportunity for entry. Strategy will long, anticipating for breakout.
The illustration below shows price closing above the Neutral Zone after a period of consolidation.
a.c-dn.net
Position is exited when prices closes at Neutral Zone (being lower than prior bars)

Ultimate Moving Average Bands [CC+RedK]The Ultimate Moving Average Bands were created by me and @RedKTrader and this converts our Ultimate Moving Average into volatility bands that use the same adaptive logic to create the bands. I have enabled everything to be fully adjustable so please let me know if you find a more useful setting than what I have here by default. I'm sure everyone is familiar with volatility bands but generally speaking if a price goes above the volatility bands then this is either a sign of an extremely strong uptrend or a potential reversal point and vice versa. I have included strong buy and sell signals in addition to normal ones so darker colors are strong signals and lighter colors are normal ones. Buy when the lines turn green and sell when they turn red.
Let me know if there are any other scripts you would like to see me publish!

Zigzag CloudThis is Bollinger Band built on top of Zigzags instead of regular price + something more.
Indicator presents 7 lines and cloud around it. This can be used to visualize how low or high price is with respect to its past movement.
Middle line is moving average of last N zigzag pivots
Lines adjacent to moving average are also moving averages. But, they are made of only pivot highs and pivot lows. Means, line above moving average is pivot high moving average and line below moving average is pivot low moving average.
Lines after pivot high/low moving averages are upper and lower bolllinger bands based on Moving Average Line with 2 standard deviation difference.
Outermost lines are bollinger band top of Moving average pivot high and bollinger band bottom of moving average pivot low.

pricing_tableThis script helps you evaluate the fair value of an option. It poses the question "if I bought or sold an option under these circumstances in the past, would it have expired in the money, or worthless? What would be its expected value, at expiration, if I opened a position at N standard deviations, given the volatility forecast, with M days to expiration at the close of every previous trading day?"
The default (and only) "hv" volatility forecast is based on the assumption that today's volatility will hold for the next M days.
To use this script, only one step is mandatory. You must first select days to expiration. The script will not do anything until this value is changed from the default (-1). These should be CALENDAR days. The script will convert to these to business days for forecasting and valuation, as trading in most contracts occurs over ~250 business days per year.
Adjust any other variables as desired:
model: the volatility forecasting model
window: the number of periods for a lagged model (e.g. hv)
filter: a filter to remove forecasts from the sample
filter type: "none" (do not use the filter), "less than" (keep forecasts when filter < volatility), "greater than" (keep forecasts when filter > volatility)
filter value: a whole number percentage. see example below
discount rate: to discount the expected value to present value
precision: number of decimals in output
trim outliers: omit upper N % of (generally itm) contracts
The theoretical values are based on history. For example, suppose days to expiration is 30. On every bar, the 30 days ago N deviation forecast value is compared to the present price. If the price is above the forecast value, the contract has expired in the money; otherwise, it has expired worthless. The theoretical value is the average of every such sample. The itm probabilities are calculated the same way.
The default (and only) volatility model is a 20 period EWMA derived historical (realized) volatility. Feel free to extend the script by adding your own.
The filter parameters can be used to remove some forecasts from the sample.
Example A:
filter:
filter type: none
filter value:
Default: the filter is not used; all forecasts are included in the the sample.
Example B:
filter: model
filter type: less than
filter value: 50
If the model is "hv", this will remove all forecasts when the historical volatility is greater than fifty.
Example C:
filter: rank
filter type: greater than
filter value: 75
If the model volatility is in the top 25% of the previous year's range, the forecast will be included in the sample apart from "model" there are some common volatility indexes to choose from, such as Nasdaq (VXN), crude oil (OVX), emerging markets (VXFXI), S&P; (VIX) etc.
Refer to the middle-right table to see the current forecast value, its rank among the last 252 days, and the number of business days until
expiration.
NOTE: This script is meant for the daily chart only.

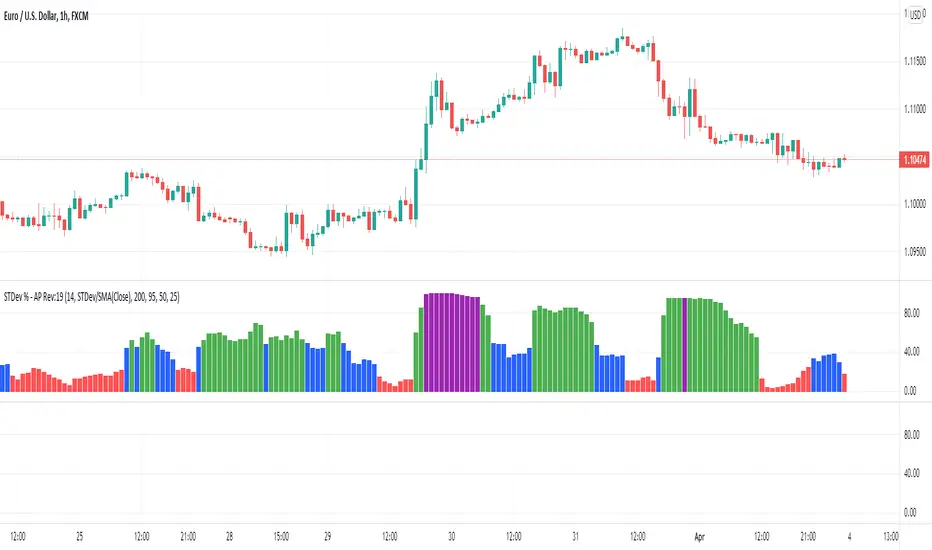
STDev % by Alejandro PThis is a simple indicator that expands the usability of Standard deviation into a universally usable indicator.
This indicator displays the volatility as standard deviation as a % of asset value, this allows using more standardized and comparable values across multiple instruments and asset classes.
Standard Deviation PercentageThis indicator plots Standard Deviation in Percentage. Standard deviation depicts how far is price from its mean.
By default it shows Standard Deviation Percentage for 10 periods.
While price will be moving away from mean, it will be printed in green, while price will retrace towards mean, it will be printed in red.
Currently, we have indicators available to print Standard Deviation but value of standard deviation depends upon value of underlying. This indicator will show deviation from mean in terms of percentage.

Probability Distribution HistogramProbability Distribution Histogram
During data exploration it is often useful to plot the distribution of the data one is exploring. This indicator plots the distribution of data between different bins.
Essentially, what we do is we look at the min and max of the entire data set to determine its range. When we have the range of the data, we decide how many bins we want to divide this range into, so that the more bins we get, the smaller the range (a.k.a. width) for each bin becomes. We then place each data point in its corresponding bin, to see how many of the data points end up in each bin. For instance, if we have a data set where the smallest number is 5 and the biggest number is 105, we get a range of 100. If we then decide on 20 bins, each bin will have a width of 5. So the left-most bin would therefore correspond to values between 5 and 10, and the bin to the right would correspond to values between 10 and 15, and so on.
Once we have distributed all the data points into their corresponding bins, we compare the count in each bin to the total number of data points, to get a percentage of the total for each bin. So if we have 100 data points, and the left-most bin has 2 data points in it, that would equal 2%. This is also known as probability mass (or well, an approximation of it at least, since we're dealing with a bin, and not an exact number).
Usage
This is not an indicator that will give you any trading signals. This indicator is made to help you examine data. It can take any input you give it and plot how that data is distributed.
The indicator can transform the data in a few ways to help you get the most out of your data exploration. For instance, it is usually more accurate to use logarithmic data than raw data, so there is an option to transform the data using the natural logarithmic function. There is also an option to transform the data into %-Change form or by using data differencing.
Another option that the indicator has is the ability to trim data from the data set before plotting the distribution. This can help if you know there are outliers that are made up of corrupted data or data that is not relevant to your research.
I also included the option to plot the normal distribution as well, for comparison. This can be useful when the data is made up of residuals from a prediction model, to see if the residuals seem to be normally distributed or not.

[BCT] Configurable DistributionTrading, like any "game of chance" is best studied and practiced using statistics.
Distributions are a simple and intuitive way to summarize your data and identify whether they follow a pattern (e.g. Normal aka Gaussian distribution, or otherwise)
Use cases:
- Confirm or infirm the indicator / strategy / time series you are looking at follows a known distribution
- Identify an edge you can consistently target
- Investigate changes over time
- Slice the distribution by quartiles or equal sized "buckets" you can use to set adequate limits in your strategies
to apply this script to your indicator, add this indicator to the chart along with the one you want to extract the distribution of. On this script's settings, switch from 'close' to the name of your indicator.
Example: add a log return calculation, add this script, select 'log return' in place of 'close' to obtain the example above.
Features:
- "zoom" - it's a multiplier that zooms in; note that the extremes will be "cropped out" of the picture, but are added to the first and last bar so as to maintain a correct count.
- "quartiles" - typically quartiles are by 4 but you can change it to any number. The table below the chart shows cutoff values for your indicator.
- "bins" - is the number of bins for the distribution.

Hercules Ultimate DCA™The Problem Most People Face When Trading & Investing:
If anyone tells you they know where the market is going, they’re either lying or they’re time travelers.
The truth is NOBODY knows whether the markets will move up or down tomorrow, next week, next year, or over any period of time.
If we all knew, we’d all be rich. What would suit most Investors is to Invest consistently over long periods of time into sound financial products.
When Creating This Investing Tool We Had 5 Requirements in Mind:
1. To create a tool that ANYONE with little to no experience could use to outperform 95% of traders and speculators.
2. To ignore the Charts, Candlesticks, Indicators, and Volatility in any market so you can rest easy at night, never having to look at the price of your asset and still remain profitable.
3. To create a tool that tells you exactly HOW MUCH to invest every day or week which takes the stress away in guessing which direction the market will go.
3. To minimize your risk and and exposure to downside even if you started buying a crypto at or near the top of a market.
4. To buy a crypto at or near the bottom of every single major swing or trend.
5. To make Investing Easy, Simple, and Fun for the average joe.
We achieved that goal with the Hercules Ultimate DCA™ Tool!
WHO Created it & HOW was it Created?
This tool uses complex math and an algorithm designed by a Quantitative Military Mathematician (who wishes to remain anonymous, so we’ll call him Satoshi) over a period of 5 and a half months.
To start, we wanted to keep things simple, and extensively researched 6 of the top investing strategies of all time:
1. Buy and Hold
2. Active Investing
3. Dollar Cost Averaging
4. Index Investing
5. Growth Investing
6. Value Investing
Most of the strategies above work well depending on your goals or how risk adverse you are, however most DO NOT check off all of the requirements we mentioned above. Comprehensive home-work and price-action history in Cryptocurrency Markets led us to the Dollar Cost Averaging (DCA) Strategy.
According to Fidelity,
“Dollar Cost Averaging is a strategy where you invest your money in equal portions, at regular intervals, regardless of which direction the market or a particular investment is going. In other words, your purchases occur regardless of the changes in price for the stock or other investment, potentially helping reduce the impact of volatility on the overall purchase.”
With this in mind our High IQ math friend got to work and formulated over 17 Different Variable Algorithms on the DCA Strategy before arriving to the one we named Hercules Ultimate DCA™.
WHY the Hercules Ultimate DCA™ Works BETTER Than Anything Else.
Rigorous backtesting & forward-testing led us to create what we believe is the most effective and efficient strategy to extract the most money from the markets while at the same time minimizing nearly all the risk when investing your hard earned money in small increments in a truly effortless way.
The Hercules Ultimate DCA™ is essentially a DCA strategy put on steroids because no two investments are alike.
As we mentioned above, a traditional DCA approach assumes you purchase the same dollar amount of any asset at scheduled times, no matter where the price of your purchased asset is.
Example: If you have $1,000 dollars and decided to invest 50 dollars per week into Bitcoin, you would invest over a period of 20 weeks before you run out of money. Now, let’s assume the price of bitcoin is 50k during your first week, you would invest $50 dollars. Then next week the price rises to 60k, you would still invest $50 Dollars. The third week, if the Price of BTC rose to 70k, you would invest $50 dollars, so on and so forth. This approach is flawed because although you would still do better than many speculators and traders over a long period of time, it essentially leaves you penniless at the end of twenty weeks with no gunpowder left to buy BTC if it drops to all-time lows.
The Hercules Ultimate DCA™ works so well because it tells you to invest less as the price goes up and far more if the prices drops. What feels counterintuitive to most investors is typically what provides the most returns. Take the example above. If you have $1,000 dollars to invest weekly and Bitcoin currently sits at 50k, you would start by investing $50 dollars. Then next week, let’s say BTC rises to 60k, you would now invest $30 dollars. And your third week, BTC reaches 70k, you would now invest $10 dollars. Not only does strategy preserve your capital but it tells you to invest less into an asset at all time highs and far more into an asset at lows.
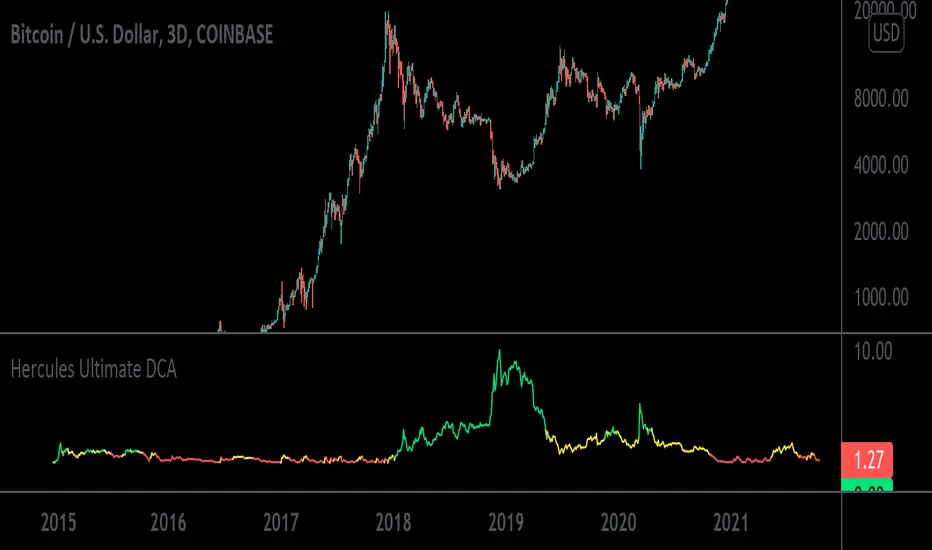
Now obviously the math in this tool is more complex, but it’s also more cost effective. At the time of writing this, the current Crypto Market has tanked from all-time-highs. Bitcoin currently sits at a price of $32,000 and is 51% down from its high of $64,900 dollars.
Just using this tool over the last 6 years, you would have invested a total of $5758.71 dollars and accumulated 4.328 Bitcoins for an average purchase of $1330.34 dollars. Your current Portfolio value would be $138,519.77 for a whopping percentage gain total of 2305%.
In other words, even with this massive crypto dump, you’d be rolling handsomely in your profits and you’d feel pretty smart too.
What’s more unique is that the Hercules Ultimate DCA™ will ALWAYS tell you to Invest More Dollars at the Literal Bottom of ANY market.
Dips in a market you believe in are far more exciting and will provide far more returns. The only way this tool fails is if the user (you) choose a market that goes to zero or is a rugpull.
How Do You Use the The Hercules Ultimate DCA™?
Step 1: Scroll to your “Invite-Only Scripts” in your indicators tab on Tradingview, then click on the indicator titled, “Hercules Ultimate DCA.”
Step 2: You should see the Indicator Populate at the Bottom of your chart with two lines, the Green line indicating how much you should buy that day, and the Blue line indicating how much of the asset you’ve purchased.
Step 3: (If you haven’t already) Make sure you turn on the Indicator Label. Navigate to the top right of the Crypto Product you would like to purchase and you will see a small settings gear. Once open, navigate on the left-hand side to the “Scales” tab and find the “Indicator Last Value Label.” Make sure it’s turned on and you will see the direct price.
Step 4: The amount you invest will now populate on the right hand side of the indicator with a number. That’s the exact dollar amount you invest in a disciplined manner no matter how large or small the number may seem.
Step 5: Get familiar with the indicator by opening the settings on the indicator itself. You will notice on the first tab it has a multiplier. If you increase it to 2, then the indicator will tell you to invest double the amount. If you input 10, then it will tell you to invest 10x the amount.
Step 6: Choose a Chart Timeframe and time of day to invest. If you choose to go with a once weekly investment then we recommend you increase your multiplier. If you choose a daily investment (and lack the necessary capital to invest large amounts daily) then we recommend keeping your multiplier down to lower numbers incase we see a lot of volatility. For most folks, once weekly on a 10x multiplier is most convenient. Set your chart to a weekly time-frame and increase your multiplier to 10. Then each week around the same time, you must invest.
Step 7: STAY DISCIPLINED. This method and tool only works if you invest the exact amount it tells you to invest over sustained periods of time.
Step 8: Enjoy Investing Made Easy 🙂
Sigma Spikes [CC]Sigma Spikes were created by Adam Grimes and this is one of the best volatility indicators out there. This indicator not only gives you positive or negative volatility but with my version I can identify any sudden changes from the underlying trend. Buy when the line turns green and sell when it turns red.
Let me know if there were any other indicators you wanted to see me publish!
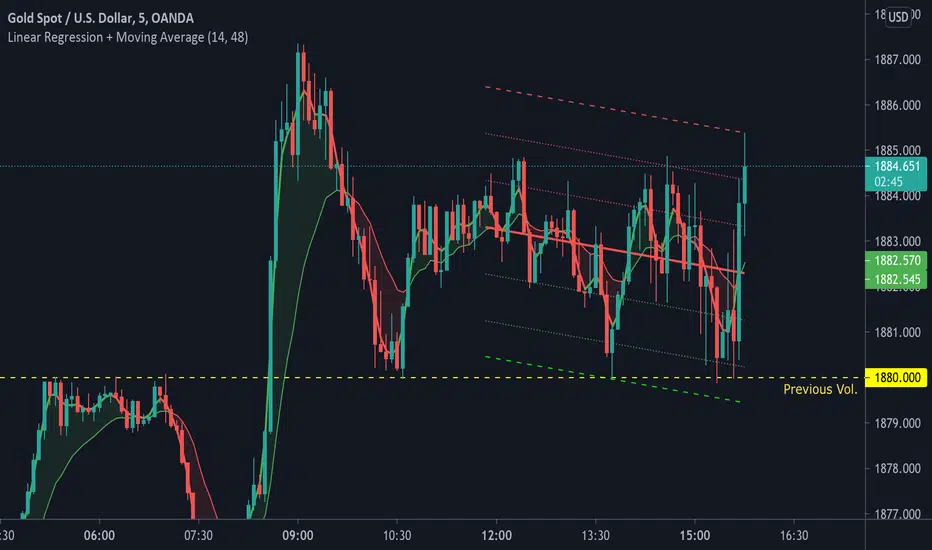
Linear Regression + Moving Average1. Linear Regression including 2 x Standard Deviation + High / Low. Middle line colour depends on colour change of Symmetrically Weighted Moving Average . Green zones indicate good long positions. Red zones indicate good short positions. (Custom)
2. Symmetrically Weighted Moving Average. Colour change depending on cross of offset -1. (Fixed)
3. Exponentially Weighted Moving Average. Colour change depending on cross with Symmetrically Weighted Moving Average. (Custom)
Intrangle - Straddle / StrangleIntrangle is an indicator to assist Nifty / Bank Nifty Option Writers / Sellers to identify the PE / CE legs to Sell for Straddle and Strangle positions for Intraday.
Basic Idea : (My Conclusion for making this Indicator)
1) Last 10 Years data says Nifty / Bank Nifty More than 66% of times Index are sideways or rangebound (within 1% day) .
2) Mostly, First one hour high and low working as good support and resistance.
Once First one hour complete, this indicator will show Strangle High (CE), Strangle Low (PE) and Straddle (CE/PE).
Straddle:
If you want to do straddle strategy, sell at the money strike (CE/PE) when price comes near to the straddle line (black line),
Strangle:
If you want to do Strangle strategy, sell Strangle High (CE) and Strangle Low (PE) when price comes near to the straddle line (black line). Both Strangle High and Low will be out of the money when price near to the straddle line (black line).
Adjustment: option adjustment to be done based on the price movement. Adjustment purely up to the user / trader.
Note1: If price not comes to near straddle line after first hour, better to stay light…
Note2: If first hour not giving wide High / Low, don’t use strangle strike based on this indicator. Straddle can be done any day with require adjustment / hedge. This Indicator is purely for education purpose, user / trader has to be back-tested before their start using it.
This indicator will work in Nifty / Bank Nifty only. Best Time frames are 3/5/15 Mins. This is purely made for Intraday
Happy Trading 😊

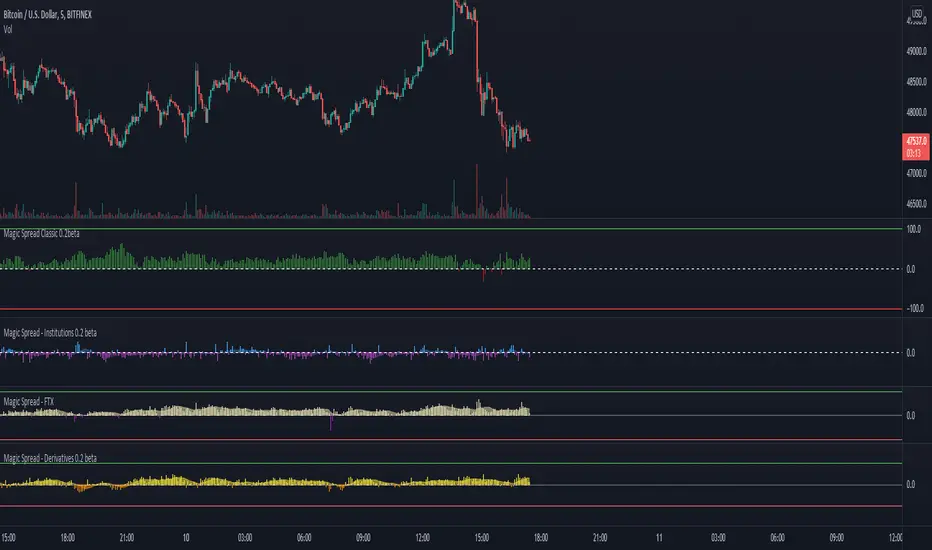
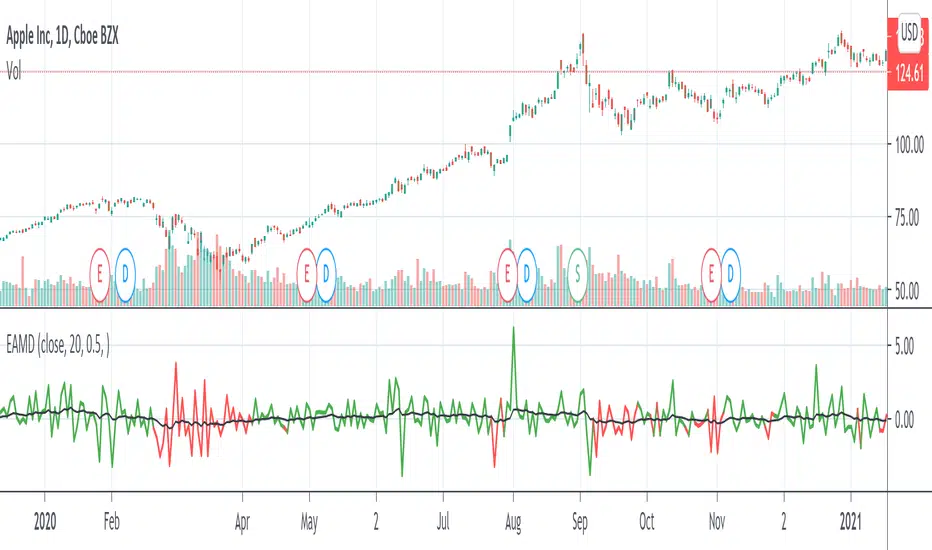
Magic Spread
Bullish above 0
Bearish below 0
Buy signal above 100
Sell signal below 100
The higher the number and the volume the stronger the signal is.
In extreme market behavior, counter trend signal are early sign of weakness that can take more or less time before reversing the trend.
Signal in the direction of the trend are more efficient.
Of course it work better as confluence, and should be used with other TA. Find support and resistance levels, and use this as confirmation.
e.g. :
A buy signal at support in an uptrend are very powerful.
A buy signal at support in large uptrend but a in a strong pullback can lead a significant bounce and forthcoming reversal but can take few LL before totally reversing.
A buy signal at resistance in an uptrend should mean imminent break-out but could be follow by a retrace / retest.