[VC] Cumulative Delta PLUS It is a Merged Version of our following two indicators.
V.C Box Chart Histogram
&
V.C Cumulative Delta Histogram.
We merged them at the user's request & convenience. This merged version also helps to save space for other indicators.
Description & Usage
Description & Usage will remain the same as described in individual descriptions of the above-mentioned parent indicators. Only one additional input is added to adjust the scale, named "Scale_Setting''.
Because now it's a merged version of 2 different indicators & both indicators have their different scale levels. To bring both indicators on an equal scale so that they can be visualised better, we have added scale adjustment settings that are easy to understand. Let's elaborate it.
Scale adjustment settings belong to the Cumulative length of the ' 'Cumulative Delta Indicator'' . Keep in mind that the best scale setting is keeping the scale setting values near or equal to cumulative length.
For example:
If you set cumulative length 20, the scale setting value should also be 20 or near 20 (like 17, 18, 19 etc.). (It depends on you, how large cumulative columns you want to see relative to Box chart Histogram)
Note: Any scale setting value can be used, it only affects visuals, not the actual calculations.
Disclaimer Note:
V.C Cumulative Delta Histogram It is purely Volume, Delta, Demand & Supply imbalance and comparative analysis-based tool. Before applying this Indicator to your study, you should clear your concepts about Volume, Delta & Spread, Demand & Supply, and Aggressive & Passive behaviour of buyers/sellers.
Some basic understanding of Sir Richerd Wyckoff's Theory can also be helpful.
Smartmoneyconcept

Sonarlab - SMC Multi Timeframe add-onThe SMC HTF Indicator is an add-on for the original SMC Indicator . This add-on will show you multi timeframe Internal structure points, swing structure points and POI's. This will make it easier for you to do your multi timeframe analyses to speed up the process and save you chart work.
Main features:
- POI's
- Structure points (Swing and Internal)
- Trading panel (based on structure breaks)
Setting overview
Higher timeframe structure
Select timeframe {turn on/ off} / {amount to show}
Internal structure {turn on/ off} / {amount to show}
Swing structure {turn on/ off} / {amount to show}
POI {turn on/ off} / {amount to show}
OB Mitigation {wick/ close}
Alerts
Bullish/ bearish POI
Bullish/ bearish BOS
Bullish/ bearish CHoCH
Swing Bullish/ bearish BOS
Swing Bullish/ bearish CHoCH
Second higher timeframe structure
Select timeframe {turn on/ off} / {amount to show}
Internal structure {turn on/ off} / {amount to show}
Swing structure {turn on/ off} / {amount to show}
POI {turn on/ off} / {amount to show}
OB Mitigation {wick/ close}
Alerts
Bullish/ bearish POI
Bullish/ bearish BOS
Bullish/ bearish CHoCH
Swing Bullish/ bearish BOS
Swing Bullish/ bearish CHoCH
Trading panel
Styling options

Liquidity_Zone by SebasVentuLiquidity_Zone by SebasVentu It is a strategy that shows the liquidity zones and also has a simulator
Es una estrategia que muestra las zonas de liquidez y ademas cuenta con un simulador

Wyichi AI 4.0Wyckoff logic : " Charles H. Dow and his colleague Edward Jones (Dow Jones & Company since 1882). The Dow Theory's final tenet is, "Trend Remains In Effect Until Clear Reversal Occurs." Dow Theorists look for "failure swings" and confirmations to give unambiguous signals of trend fatigue or trend reversal, according to this concept. Any pattern, whether it's a continuation pattern like a Flag Formation or a reversal pattern like Head & Shoulders , is designed to repeat itself over and over again."
Ichimoku : " An Ichimoku practitioner should be able to get a quick sense of sentiment, momentum, and trend strength by looking at an Ichimoku chart , Hosada was a fervent belief that market dynamics or behavior reflected human group dynamics. He felt that human conduct in their lives and relationships might be defined as a continual cyclical movement away from and back toward balance. "
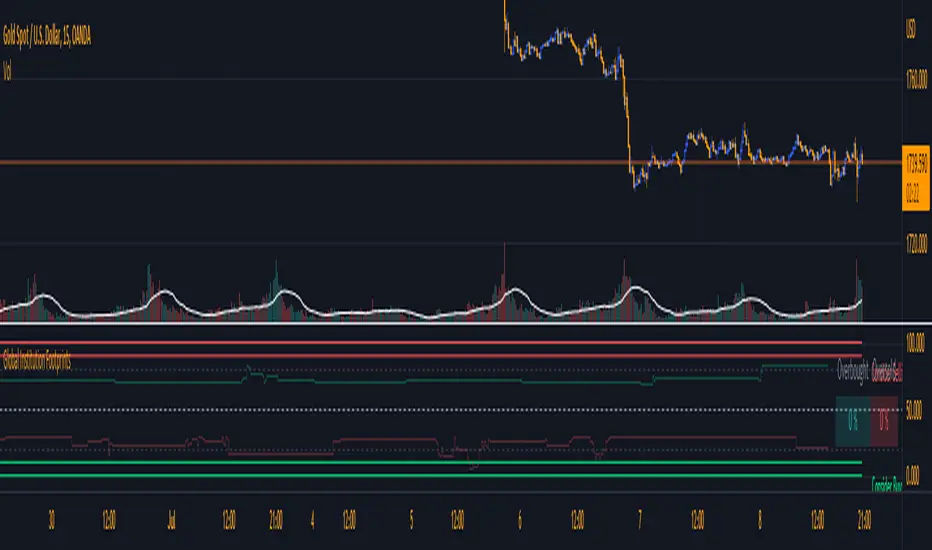
Wyckoff + Ichimoku = Institutional Footprints ( Trade with the banks)
Indicator use Wyckoff pattern ( APD ) and Ichimoku pattern ( Phase ).... or Bermuda Triangle Pattern