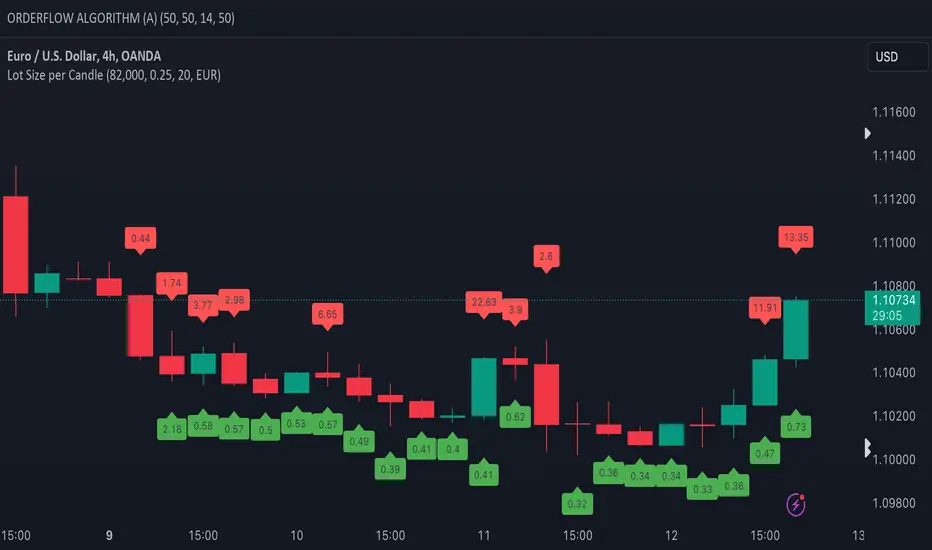
Lot Size per CandleThis script indicates the lotsize based on your accountsize and risk per trade.
You have the option to select account in EUR or USD. You can set account size and risk%.
Valid for next combination of currencies:
EUR
JPY
GBP
AUD
CHF
CAD
XAUUSD
Cari skrip untuk "xauusd实时行情"
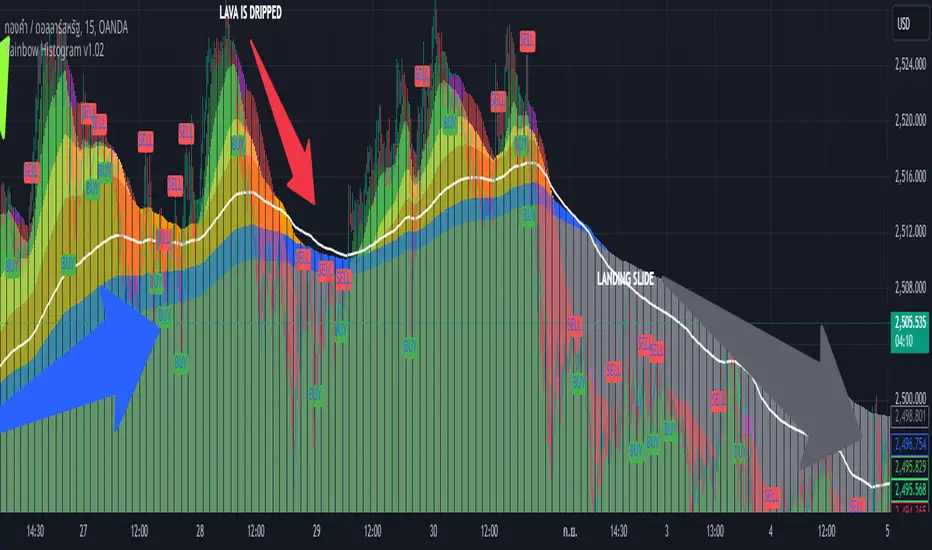
Rainbow Histogram v1.01Sure! Here’s a compelling English version of the article for your TradingView post:
---
### 🌈 **Introducing Rainbow Histogram: A Fusion of EMA and MA for Enhanced Trading Analysis**
**Hello Traders,**
I’m excited to introduce a fresh concept that combines technical analysis techniques into a new indicator called **Rainbow Histogram**. This innovative tool blends Exponential Moving Averages (EMA) and Moving Averages (MA) to provide you with a powerful and accurate tool for making trading decisions.
#### **🎨 What is Rainbow Histogram?**
The Rainbow Histogram is designed to help you identify market trends and signal precise entry and exit points by blending EMA and MA into a colorful "Rainbow" display. This visual approach enhances your ability to spot trend strength and direction with clarity.
#### **📈 How Does Rainbow Histogram Work?**
1. **Exponential Moving Average (EMA):** Captures short-term trends and reacts quickly to price changes.
2. **Moving Average (MA):** Tracks long-term trends and provides a broader view of the market direction.
**Rainbow Histogram** uses the combination of EMA and MA to create a histogram that shows the difference between these two averages in distinct colors. This makes it easy to visualize trend changes and market momentum.
#### **🔧 Setting It Up**
1. **EMA:** Adjust the EMA settings based on your trading timeframe and strategy (e.g., EMA 9, EMA 21).
2. **MA:** Set the MA parameters to capture long-term trends (e.g., MA 50, MA 200).
#### **🌟 Why Use Rainbow Histogram?**
- **Simplified Analysis:** Quickly identify trends and their strength with a clear visual representation.
- **Distinct Colors:** Differentiate between EMA and MA with vibrant colors for easy interpretation.
- **Precise Signals:** Get clear buy and sell signals based on histogram changes.
#### **📥 Get Started**
Add **Rainbow Histogram** to your TradingView charts by searching for the script in TradingView’s library or set it up manually using the recommended settings.
#### **📝 In Summary**
**Rainbow Histogram** is a unique tool that simplifies trend analysis and enhances accuracy by merging EMA and MA into a single, colorful indicator. Use this tool to refine your trading strategy and make more informed financial decisions.
If you have any questions or feedback about **Rainbow Histogram**, feel free to comment below or send me a message!
**Happy Trading!** 🌟
---
I hope this version effectively captures attention and engages your audience!
All Divergences with trend / SL - Uncle SamThanks to the main inspiration behind this strategy and the hard work of:
"Divergence for many indicators v4 by LonesomeTheBlue"
The "All Divergence" strategy is a versatile approach for identifying and acting upon various divergences in the market. Divergences occur when price and an indicator move in opposite directions, often signaling potential reversals. This strategy incorporates both regular and hidden divergences across multiple indicators (MACD, Stochastics, CCI, etc.) for a comprehensive analysis.
Key Features:
Comprehensive Divergence Analysis: The strategy scans for regular and hidden divergences across a variety of indicators, increasing the probability of identifying potential trade setups.
Trend Filter: To enhance accuracy, a moving average (MA) trend filter is integrated. This ensures trades align with the overall market trend, reducing the risk of false signals.
Customizable Risk Management: Users can adjust parameters for long/short stop-loss and take-profit levels to match their individual risk tolerance.
Additional Risk Management (Optional): An experimental MA-based risk management feature can be enabled to close positions if the market shows consecutive closes against the trend.
Clear Visuals: The script plots pivot points, divergence lines, and stop-loss levels on the chart for easy reference.
Strategy Settings (Defaults):
Enable Long/Short Strategy: True
Long/Short Stop Loss %: 2%
Long/Short Take Profit %: 5%
Enable MA Trend: True
MA Type: HMA (Hull Moving Average)
MA Length: 500
Use MA Risk Management: False (Experimental)
MA Risk Exit Candles: 2 (If enabled)
Pivot Period: 9
Source for Pivot Points: Close
Backtest Details (Example):
The strategy has been backtested on XAUUSD 1H (Goold/USD 1 hour timeframe) with a starting capital of $1,000. The backtest period covers around 2 years. A commission of 0.02% per trade and a 0.1% slippage per trade were factored in to simulate real-world trading costs.
Disclaimer:
This strategy is for educational and informational purposes only. Backtested results are not indicative of future performance. Use this strategy at your own risk. Always conduct your own analysis and consider consulting a financial professional before making any trading decisions.
Important Notes:
The default settings are a good starting point, but feel free to experiment to find optimal parameters for your specific trading style and market.
The MA-based risk management is an experimental feature. Use it with caution and thoroughly test it before deploying in live trading.
Backtest results can vary depending on the market, timeframe, and specific settings used. Always consider slippage and commission fees when evaluating a strategy's potential profitability.

Sniper Entry using RSI confirmationThis is a sniper entry indicator that provides Buy and Sell signals using other Indicators to give the best possible Entries (note: Entries will not be 100 percent accurate and analysis should be done to support an entry)
Moving Average Crossovers:
The indicator uses two moving averages: a short-term SMA (Simple Moving Average) and a long-term SMA.
When the short-term SMA crosses above the long-term SMA, it generates a buy signal (indicating potential upward momentum).
When the short-term SMA crosses below the long-term SMA, it generates a sell signal (indicating potential downward momentum).
RSI Confirmation:
The indicator incorporates RSI (Relative Strength Index) to confirm the buy and sell signals generated by the moving average crossovers.
RSI is used to gauge the overbought and oversold conditions of the market.
A buy signal is confirmed if RSI is below a specified overbought level, indicating potential buying opportunity.
A sell signal is confirmed if RSI is above a specified oversold level, indicating potential selling opportunity.
Dynamic Take Profit and Stop Loss:
The indicator calculates dynamic take profit and stop loss levels based on the Average True Range (ATR).
ATR is used to gauge market volatility, and the take profit and stop loss levels are adjusted accordingly.
This feature helps traders to manage their risk effectively by setting appropriate profit targets and stop loss levels.
Combining the information provided by these, the indicator will provide an entry point with a provided take profit and stop loss. The indicator can be applied to different asset classes. Risk management must be applied when using this indicator as it is not 100% guaranteed to be profitable.
Goodluck!

Advanced Gold Scalping Strategy with RSI Divergence# Advanced Gold Scalping Strategy with RSI Divergence
## Overview
This Pine Script implements an advanced scalping strategy for gold (XAUUSD) trading, primarily designed for the 1-minute timeframe. The strategy utilizes the Relative Strength Index (RSI) indicator along with its moving average to identify potential trade setups based on divergences between price action and RSI movements.
## Key Components
### 1. RSI Calculation
- Uses a customizable RSI length (default: 60)
- Allows selection of the source for RSI calculation (default: close price)
### 2. Moving Average of RSI
- Supports multiple MA types: SMA, EMA, SMMA (RMA), WMA, VWMA, and Bollinger Bands
- Customizable MA length (default: 3)
- Option to display Bollinger Bands with adjustable standard deviation multiplier
### 3. Divergence Detection
- Implements both bullish and bearish divergence identification
- Uses pivot high and pivot low points to detect divergences
- Allows for customization of lookback periods and range for divergence detection
### 4. Entry Conditions
- Long Entry: Bullish divergence when RSI is below 40
- Short Entry: Bearish divergence when RSI is above 60
### 5. Trade Management
- Stop Loss: Customizable, default set to 11 pips
- Take Profit: Customizable, default set to 33 pips
### 6. Visualization
- Plots RSI line and its moving average
- Displays horizontal lines at 30, 50, and 70 RSI levels
- Shows Bollinger Bands when selected
- Highlights divergences with "Bull" and "Bear" labels on the chart
## Input Parameters
- RSI Length: Adjusts the period for RSI calculation
- RSI Source: Selects the price source for RSI (close, open, high, low, hl2, hlc3, ohlc4)
- MA Type: Chooses the type of moving average applied to RSI
- MA Length: Sets the period for the moving average
- BB StdDev: Adjusts the standard deviation multiplier for Bollinger Bands
- Show Divergence: Toggles the display of divergence labels
- Stop Loss: Sets the stop loss distance in pips
- Take Profit: Sets the take profit distance in pips
## Strategy Logic
1. **RSI Calculation**:
- Computes RSI using the specified length and source
- Calculates the chosen type of moving average on the RSI
2. **Divergence Detection**:
- Identifies pivot points in both price and RSI
- Checks for higher lows in RSI with lower lows in price (bullish divergence)
- Checks for lower highs in RSI with higher highs in price (bearish divergence)
3. **Trade Entry**:
- Enters a long position when a bullish divergence is detected and RSI is below 40
- Enters a short position when a bearish divergence is detected and RSI is above 60
4. **Position Management**:
- Places a stop loss order at the entry price ± stop loss pips (depending on the direction)
- Sets a take profit order at the entry price ± take profit pips (depending on the direction)
5. **Visualization**:
- Plots the RSI and its moving average
- Draws horizontal lines for overbought/oversold levels
- Displays Bollinger Bands if selected
- Shows divergence labels on the chart for identified setups
## Usage Instructions
1. Apply the script to a 1-minute XAUUSD (Gold) chart in TradingView
2. Adjust the input parameters as needed:
- Increase RSI Length for less frequent but potentially more reliable signals
- Modify MA Type and Length to change the sensitivity of the RSI moving average
- Adjust Stop Loss and Take Profit levels based on current market volatility
3. Monitor the chart for Bull (long) and Bear (short) labels indicating potential trade setups
4. Use in conjunction with other analysis and risk management techniques
## Considerations
- This strategy is designed for short-term scalping and may not be suitable for all market conditions
- Always backtest and forward test the strategy before using it with real capital
- The effectiveness of divergence-based strategies can vary depending on market trends and volatility
- Consider using additional confirmation signals or filters to improve the strategy's performance
Remember to adapt the strategy parameters to your risk tolerance and trading style, and always practice proper risk management.

Lot Size Calculator - Acero FXENGLISH DESCRIPTION:
Easy get your lot size (by Acero FX)
---------------------------
We use this transaction sizes:
Forex = 1
XAUUSD = 0.001
US100, US30 or other index = 10
---------------------------
Automatic Information for calculations:
Currency used: USD
Instrument: Detected Automatically
---------------------------
Manual Inputs:
Choose your Balance amount in "Tamaño de Cuenta"
Choose your Risk Type in "Tipo de Riesgo" between Percentage or Amount
Choose your method to calculate your Lot Size in "Calcular Usando..." between Pips or Entry and SL price
---------------------------
Table Shows:
Title: Lot Size Calc 5.0 - Acero FX
Instrument: .................
Lot Size: ..............
Entry Price: .............
Stop Loss Price: .............
Pips: ...............
Risk ($): ...............
Risk (%): ............
Transaction Size: ..............
---------------------------
Important Disclaimers:
-Minor pairs may have some differences between other calculators.
-JPY pairs use USDJPY open price of the day
DESCRIPCIÓN EN ESPAÑOL
Calcula fácilmente tu lote (Diseñado por Acero FX)
---------------------
Usamos estos tamaños de transacción:
Forex = 1
XAUUSD = 0,001
US100, US30 u otros índices = 10
---------------------
Información automática para cálculos:
Moneda utilizada: USD
Instrumento: Detectado automáticamente
---------------------
Entradas manuales:
Elige el monto de tu Saldo en "Tamaño de Cuenta"
Elige el Tipo de Riesgo en "Tipo de Riesgo" entre Porcentaje o Monto
Elige el método para calcular el tamaño de stu lote en "Calcular Usando..." entre Pips o Entrada y precio SL
---------------------
La tabla muestra:
Título: Calc. Tamaño de Lote 5.0 - Acero FX
Instrumento: .................
Lotaje: ..............
Entrada: .............
Stop Loss: .............
Pips: .................
Riesgo ($): .................
Riesgo (%): ............
Tamaño del contrato (tamaño de la transacción): .................
---------------------
Descargos de responsabilidad importantes:
-Los pares menores pueden tener algunas diferencias entre otras calculadoras.
-Los pares JPY utilizan el precio de apertura del día USDJPY

Williams Percent Range with Trendlines and BreakoutsHere is my "Williams Percent Range with Trendlines and Breakouts" indicator, a simple yet powerful tool for traders. This indicator combines the classic Williams %R oscillator, which helps identify overbought and oversold levels, with added trendlines for easier trend analysis at a glance.
It's designed to make spotting potential breakouts easier by drawing attention to significant price movements. With customizable settings for the Williams %R period and trendline sensitivity, it's a flexible tool for various symbols and trading styles.
Whether you're looking to refine your trading strategy or just need a clearer view of market trends, this indicator should offer a straight forward approach to hopefully enhance your trading decisions.
Disclaimer: This indicator is intended for educational and informational purposes only. Always conduct your own research and analysis before making trading decisions.

Divergence AnalyzerUnlock the potential of your trading strategy with the Divergence Analyzer, a sophisticated indicator designed to identify divergence patterns between two financial instruments. Whether you're a seasoned trader or just starting, this tool provides valuable insights into market trends and potential trading opportunities.
Key Features:
1. Versatility in Symbol Selection:
- Choose from a wide range of symbols for comparison, including popular indices like XAUUSD and SPX.
- Seamlessly toggle between symbols to analyze divergences and make informed trading decisions.
2. Flexible Calculation Options:
- Customizable options allow you to use a different symbol for calculation instead of the chart symbol.
- Fine-tune your analysis by selecting specific symbols for comparison based on your trading preferences.
3. Logarithmic Scale Analysis:
- Utilizes logarithmic scales for accurate representation of price movements.
- Linear regression coefficients are calculated on the logarithmic scale, providing a comprehensive view of trend strength.
4. Dynamic Length and Smoothing:
- Adjust the length parameter to adapt the indicator to different market conditions.
- Smoothed linear regression with exponential moving averages enhances clarity and reduces noise.
5. Standard Deviation Normalization:
- Normalizes standard deviations over 200 periods, offering a standardized view of price volatility.
- Easily compare volatility levels across different symbols for effective divergence analysis.
6. Color-Coded Divergence Visualization:
- Clearly distinguish positive and negative divergences with customizable color options.
- Visualize divergence deltas with an intuitive color scheme for quick and effective interpretation.
7. Symbol Information Table:
- An included table provides at-a-glance information about the selected symbols.
- Identify Symbol 1 and Symbol 2, along with their corresponding positive and negative divergence colors.
How to Use:
1. Select symbols for analysis using the user-friendly inputs.
2. Customize calculation options based on your preferences.
3. Analyze the divergence delta plot for clear visual indications.
4. Refer to the symbol information table for a quick overview of selected instruments.
Empower your trading strategy with the Divergence Analyzer and gain a competitive edge in the dynamic world of financial markets. Start making more informed decisions today!

Flat Combo DetectorFlat Combo Detector (FCD)
Introduction:
The Flat Combo Detector is a unique tool crafted to aid traders in identifying potential trend reversals. Unlike standard indicators that primarily focus on moving averages or oscillators, the FCD bases its signals on specific candlestick patterns that manifest at crucial trend pivot points.
I use it mostly on OANDA:XAUUSD Gold
How It Works:
The logic of the Flat Combo Detector revolves around the formation of consecutive bearish and bullish candles with particular attributes:
Bearish to Bullish Transition:
Primary Candle : A bearish candle where the close is lower than the open and its close is equal to its low.
Following Candle: A bullish candle where the close is higher than the open, and the open approximates its low (within a user-defined tolerance).
Signal : A green triangle plotted below the price bar, indicating a potential shift from a bearish to bullish trend.
Bullish to Bearish Transition:
Primary Candle: A bullish candle where the close is higher than the open and equals its high.
Following Candle : A bearish candle where the close is lower than the open, and the open approximates its high (within a user-defined tolerance).
Signal : A red triangle plotted above the price bar, indicating a potential transition from a bullish to bearish trend.
Usage Guidance:
For traders unfamiliar with Pine Script, using this indicator is straightforward. Once added to the chart, look for the green and red triangle signals. A green triangle below a price bar suggests a possible bullish reversal, while a red triangle above a price bar hints at a potential bearish reversal. Always consider these signals in conjunction with other technical analysis tools and the broader market context to optimize decision-making.
Associated Strategy:
I've also developed a trading strategy that utilizes these specific entry points identified by the FCD. If you find the signals from this indicator helpful, you might also be interested in exploring the strategy for a comprehensive trading approach. Always remember to backtest and validate any strategy before live trading.
Chart Presentation:
The published chart associated with this script has been kept clean to ensure clarity. Users will only observe the main price bars/candles along with the green and red triangle signals generated by the FCD.
Conclusion:
The Flat Combo Detector provides traders with a fresh perspective on trend reversal points. Its focus on specific candlestick patterns makes it a valuable tool, especially when used in combination with other technical indicators. Always ensure to practice prudent risk management and consult multiple analysis methods before making trading decisions.
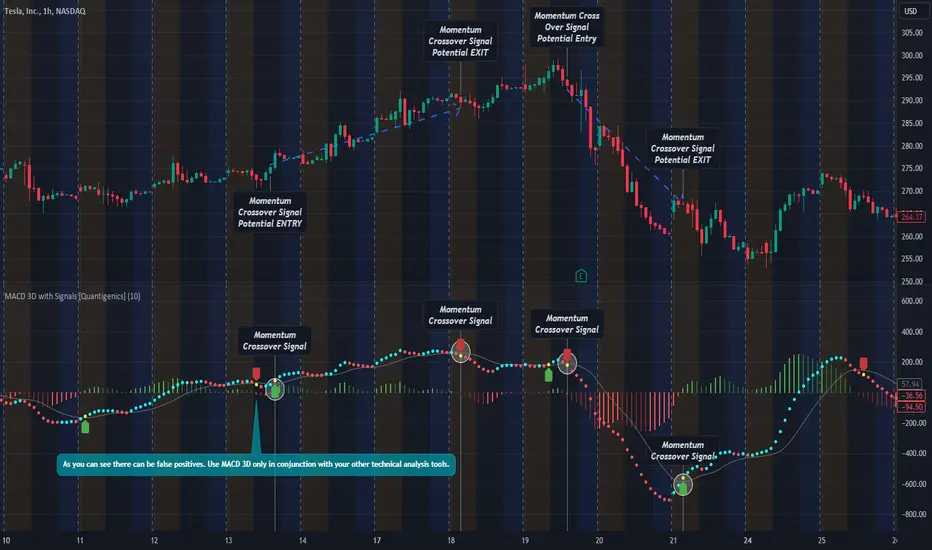
MACD 3D with Signals [Quantigenics]Quantigenics MACD 3D with Buy Sell Signals is a MACD-based trading indicator that aims to identify market trends and potential turning points, for Buy/Sell opportunities, by leveraging price data and volatility.
Unlike the traditional MACD indicator, the average price is calculated from the high, low, and close prices, from which a specialized MACD value is derived. This MACD value, combined with an average and standard deviation, takes into account volatility, and is used to generate an upper and lower boundary.
The indicator color-codes market trends: aqua indicates upward trends (signifying increased buying pressure), red suggests downward trends (increased selling pressure). When the MACD value crosses above the upper boundary or falls below the lower boundary, the color changes to yellow indicating a possible reversal point and "Momentum Crossover Signals" can be plotted at this point. "Standard Signal" arrows can also plotted when the MACD 3D changes from auqa to red and vice-versa.
A trendline is drawn at the median value, providing a baseline for comparison. A differential value, which measures the distance between the MACD value and the median line, provides additional insight into the price's deviation from this baseline (divergences from the underlying price can be spotted using this data as well). The differential is color-coded: green when MACD is above the median, and red when it's below, with darker shades representing a decreasing gap.
Alerts can be set to trigger with the "Standard Signal" arrows appearing after MACD 3D changes from auqa to red and vice-versa and when the "Momentum Crossover Signal" arrows appear when the MACD value crosses above the upper boundary or falls below the lower boundary indicating a potential reversal. Providing immediate notifications which can be especially helpful in larger time frames where it may take time for a trade setup to develop.
CME_MINI:NQ1!
OANDA:XAUUSD
Enjoy the MACD 3D indicator. Happy Trading!
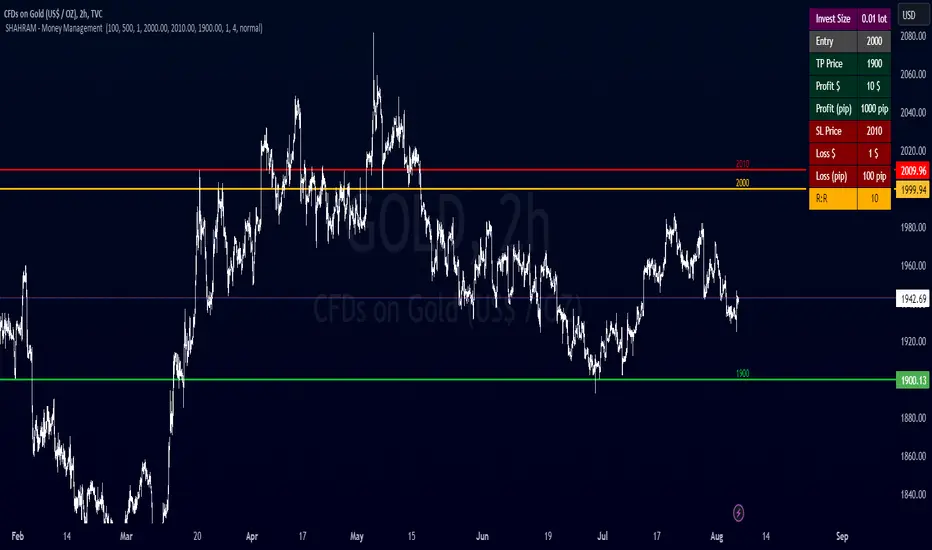
SHAHRAM - Money Management This indiator will help you to calculate your position size for managing the risk calculator.
Features :
Click-able Price Entry & SL & TP
calculations works on Forex, CFD, Stock, Futures and Crypto markets.
Usage:
Step 1: Set your entry price
Step 2: Set your stop loss
Step 3: Set your Target
Step 4: Choose the symbol, forex will be automatically detected
Step 5: Fill in your balance and set your risk settings
Parameters
- Set symbol: Forex (auto detection), US100, US30, BTC, XAUUSD, NGAS, XBRUSD, XTIUSD, AUS200, US500, OIL, GOLD, SILVER,...
- Account balance
- Risk in %
- Contract size
- Levels: Stop loss, Entry, Target
- Display settings for the Trading Panel
Trading panel
- Show Live P/L
- Show Risk to reward
- Show lot size
- Show risk in %
- Show account balance
- Show money at risk (no commissions included)
You need change the lot size in Account Setting of this indicator For Gold,Oil... and Other Symbol like as different pip value.
Simply choose your entry level and stop level than target price on the chart and the indicator will calculate your invest size and other documents. You can change your account risk and base currency units in the settings along with changing the scaling of the calculation to adjust the results with the lot sizing units of your broker. This allows the calculator to be used with CFDs, forex, Gold, etc.. Hope it helps in your trading it has been the single most useful tool in my trading as it has helped me always keep my risk locked up and on point that is why I released it.
Copyright BY : @shahramlife
indiator will help you to calculate your position size for managing the risk calculator.
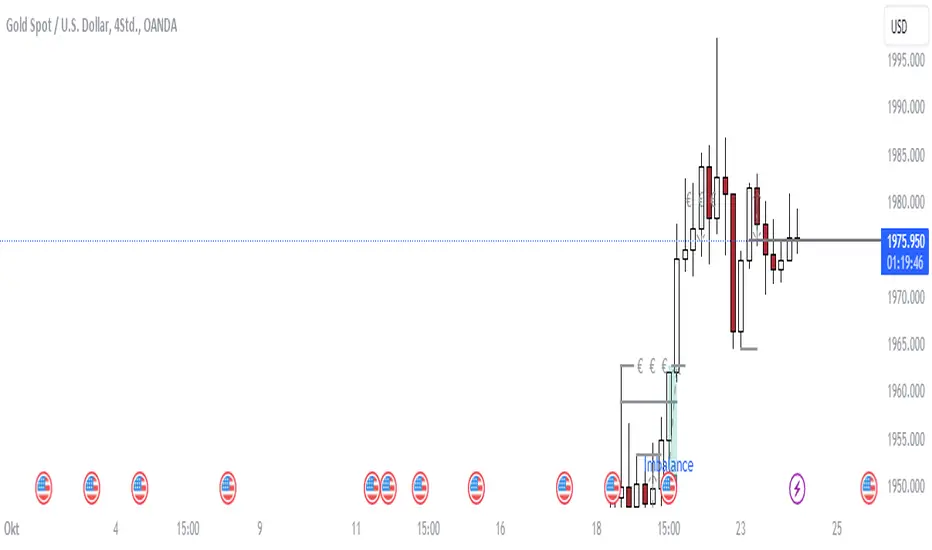
XAUXXXThis simple script is meant to get around the limitations some data providers have, in terms of the length of historical data they choose to provide traders. Inspired by OANDA's XAUCAD pair only having data as far back as 2005, whereas XAUUSD has data back to to the 19th century.
By taking the OHLC data from XAUUSD and multiplying it by the price of USD in a desired currency you are able to see further back in time, the limitation now being the length of FX data available instead of the price of Precious metal / currency pair. As shown in the chart you can now see the price of Gold in CAD as far back as the late 1960s, a nearly half century of data uncovered for all to see!

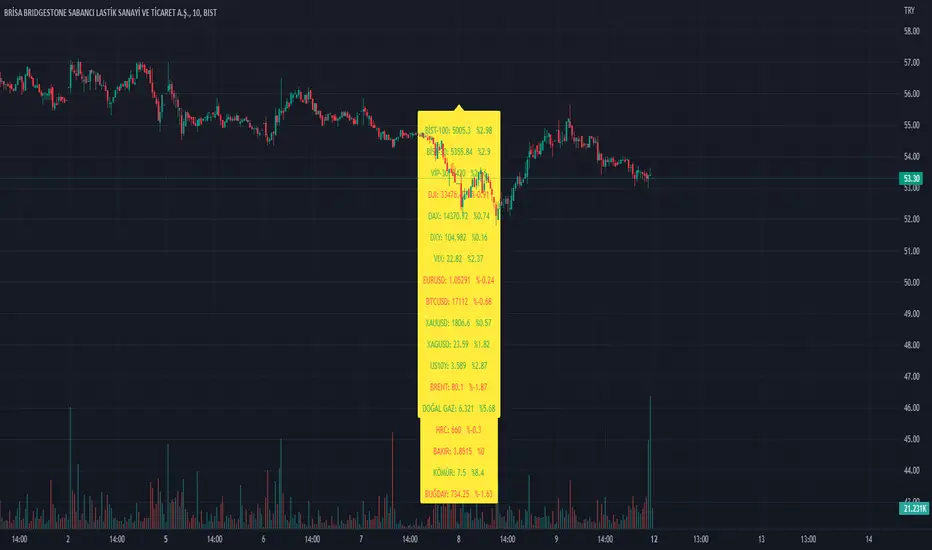
Index_and_Commodity_PricesThis indicator shows real-time current day-to-day performance of 18 different indices and commodities . Here is the list of different sector ETFs that this indicator tracks
/////INDEX//////
1. BİST-100 - XU0100 - TR- Index
2. BİST-30 - XU030 - TR - Index
3. VİOP-30 - XU030D1! - Index
4. DJI - Dow Jones - Index
5. DAX - DAX Index
6. VIX - Volatilite S&P Index
//////FOREX MARKET/////
7. DXY - U.S. Dollar Index
8. EURUSD -
9. BTCUSD -
10. XAUUSD -
11. XAGUSD -
//////COMMODITY///////
12. BR1! - Brent
13. NG1! - Natural Gas
14. HRC1! -
15. ZW1! -
16. HG1! -
17. DJUSCL -
///////OTHER///////
18. US10Y -
Point of Control V2 The genesis of this project was to create a POC library that would be available to deliver volume profile information via pine to other scripts of indicators and strategies.
This is a republish of an invite only script to open access
This is the indicator version of the library function.
A few points of significance:
- Allows the choice of reset of the study period, day/week or bars. This is simple enough to expand to other conditions
- Bar count resets starting from the beginning of the data set (bar index =0) vs bars back from the end of the data set
- A 'period' in this context is the time between resets - the start of the POC (eg. start of Day or Week) until it resets (for example at the beginning of a next day or week)
- Automates the determination of the increment level rather than the user specifying ticks or price brackets
- Does not allow for setting the # of rows and then calculating the implied price increment levels
- When a period is complete it is often useful to look back at the POCs of historical periods, or extend them forward.
- This script will find the historical POCs around the current price and display them rather than extend all the historical POC lines to the right
- This script also looks across all the period POCs and identifies the master POC or what I call the Grand POC, and also the next 3 runner up POCs
This indicator is also available as a library.
BINANCE:BTCUSDT NSE:NIFTY OANDA:XAUUSD NASDAQ:AAPL TVC:USOIL

CHN BUY SELLCHN BUY SELL is formed from two RSI indicators, those are RSI 14 and RSI 7 . I use RSI 14 to determine the trend and RSI 7 to find entry points.
+ Long (BUY) Signal:
- RSI 14 will give a "BUY" signal, then RSI 7 will give entry point to LONG when the candle turns yellow.
+ Short (SELL) Signal:
- RSI 14 will give a "EXIT" signal, then RSI 7 will give entry point to SHORT when the candle turns purple.
+ About Take Profit and Stop Loss:
- With Gold, I usually set Stop Loss and Take Profit at 50 pips
- With currency pairs, I usually keep my Stop Loss and Take Profit at 30 pips
- With crypto, I usually keep Stop Loss and Take Profit at 1.5%
Recommended to use in time frame M15 and above .
This method can be used to trade Forex, Gold and Crypto.
My idea is formed on the view that when the price is moving strongly, the RSI 14 will tell us what the current trend is through a "BUY" or "EXIT" signal. When RSI 14 reaches the oversold area it will form a "BUY" signal and when it reaches the overbought area it will give an "EXIT" signal. I believe that when the price reaches the oversold or overbought area, the price momentum has also decreased and is about to reverse.
After receiving a signal from RSI 14, my job is to wait for an Entry signal from RSI 7. When RSI 7 reaches the overbought area, a yellow candle will appear and that's when we enter a LONG order. When the RSI 7 reaches the oversold area, a purple candle will appear and that's when we enter a SHORT order.

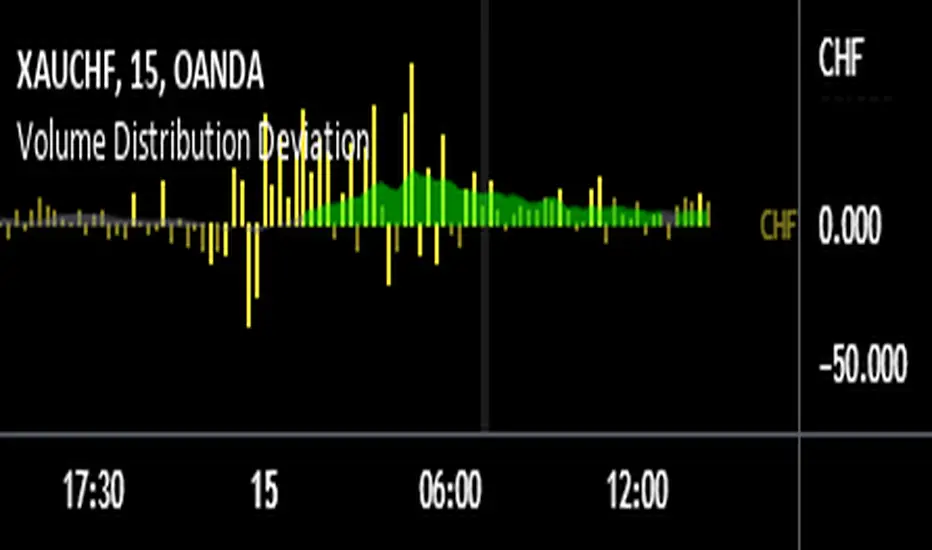
Volume Distribution DeviationThis indicator explores the question - "Does a currency's PERCENTAGE of trading volume verses other currencies show an insight into market sentiment?"
Specifically, it calculates the average market share based on the same time of day for a given number of days back (10 days by default) for trades involving the selected currency then presents fluctuations from that average as a percentage.
For example, assume that currencies involving EUR (EURUSD, EURAUD, EURCAD etc…) on average account for 20% of trading volume at 8am GMT (London open) however today at London open EUR crosses account for 30% at London open – 50% higher than usual. Does this information give us a heads up for market sentiment for the next few hours? And what if EUR volume was 50% higher than average and USD was 30% lower than average – should we focus on EUR and pass on USD that session?
Note that the indicator is not presenting information regarding volume quantity – it is showing you interest in that currency within the volume occurring that day. I already have an indicator that compares volume quantity to average volume quantity for that time of day, this takes the concept a little further and shows the normalised deviations from that average. So if USD volume was up 50% and NZD was up 50% they will show as equal on the indicator even though the actual traded volume of USD is probably x10 higher.
I find the 15 minute timeframe gives the most meaningful data. I use an 8 window chart and display the deviations for each currency (NZD, AUD, JPY, CHF, EUR, GBP, CAD, USD). If you set to 'Automatic' the indicator will automatically chose the currency based on the currency you crossed with gold (OANDA:XAUNZD, OANDA:XAUAUD, OANDA:XAUJPY, OANDA:XAUCHF, OANDA:XAUEUR, OANDA:XAUGBP, OANDA:XAUCAD, OANDA:XAUUSD). I tend to look at the average deviation rather than an isolated spike.
There are features in the indicator to try to summarise and highlight impactful data - highlighted deviations over a set tolerance (10% by default) and the SMA of the deviations.
Good luck
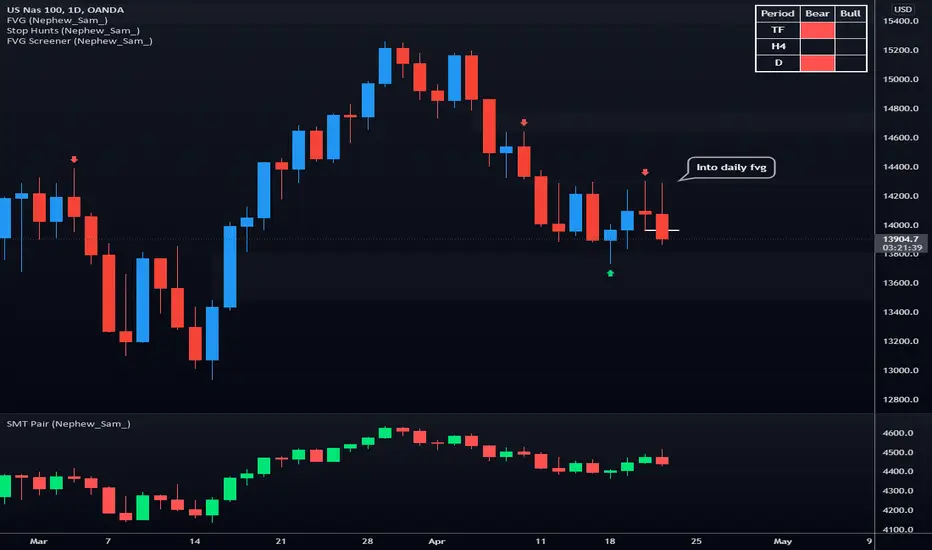
SMT Pair (Nephew_Sam_)// This source code is subject to the terms of the Mozilla Public License 2.0 at mozilla.org
// © Nephew_Sam_
--------------------------------------------------------------
This code for version is entirely different from the previous two SMT divergence indicators that I had published in terms of effeciency.
There is an option to have upto 10 custom pairs and 1 default pair (if outside the 10) for your SMT/correlated pair.
The divergence lines are not perfect and is still under development.
--------------------------------------------------------------
This indicator shows a secondary SMT/correlated pair at them bottom pane as a line or bar chart and draws lines if there are any divergences between the primary and secondary pair.
ie .
GBPUSD - EURUSD
EURUSD - DXY (inversed)
XAUUSD - XAGUSD
Options:
1. Show the secondary pair in lines or candlesticks
2. Divergences between pivot points (I'm yet to implement last pivot to live price)
3. Set 10 primary-smt pairs + a default pair for every other.
4. For every pair there is an option to inverse the price of the smt pair
(Hover over the tips in the indicator settings to learn more)
Wave Chart v1##Wave Chart v1##
For analyzing Neo-wave theory
Plot the market's highs and lows in real-time order.
Then connect the highs and lows
with a diagonal line. Next, the last plot of one day (or bar) is connected with a straight line to the
first plot of the next day (or bar).
##How To Use##
if you want a weekly chart you drop the time frame to the daily chart.
Then you set the range to 7(if the market opens 7 days per week).
Then you click "highlight the bar that runs to plot" and you must shift the highlight to the last day that the weekly chart bar close(Sunday / Friday)
##Example 1
Weekly chart BTCUSDT on BINANCE
first open daily chart, set range = 7 and Bars_shift = 3 (shift highlight to Sunday)
##Example 2
Weekly chart XAUUSD on FXOPEN
first open daily chart, set range = 5 (market open 5 days per week) and Bars_shift = 1 (shift highlight to Friday)
##Note##
If the market has a special holiday Wave Chart may be inaccurate.

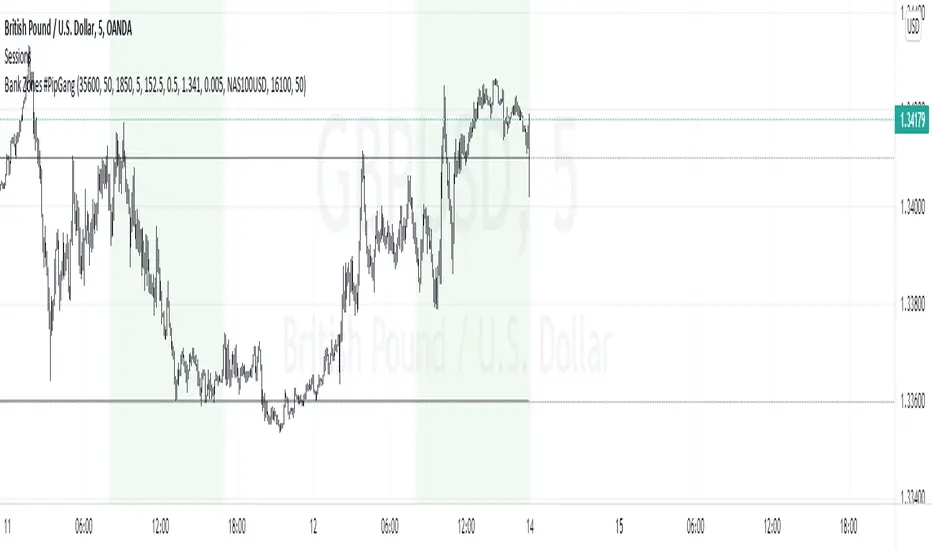
Bank Zones #PipGangHello Traders,
If you trade Forex and Indices this indicator will help you identify Buying and Selling levels that Banks are interested in. These levels are displayed on all time frames. Colors of the lines can be customized.
I also added code to show two EMA's, just uncomment the code to show them. :-)
How to use this indicator.
Show Bank Zones - this will enable/disable horizonal lines on the chart.
Price - enter bank zone price.
Increment By - plots three horizonal lines in pips above and below bank zone price.
Note: Decimal placement is KEY, this may vary by symbol.
Sample Settings:
US30USD
Price 35600.0
IncrementBy 50 (equals 50 pips)
XAUUSD
Price 1850.000
IncrementBy 5 (equals 50 pips)
GBPJPY
Price 152.500
IncrementBy .5 (equals 50 pips)
GBPUSD
Price 1.34100
IncrementBy .005 (equals 50 pips)
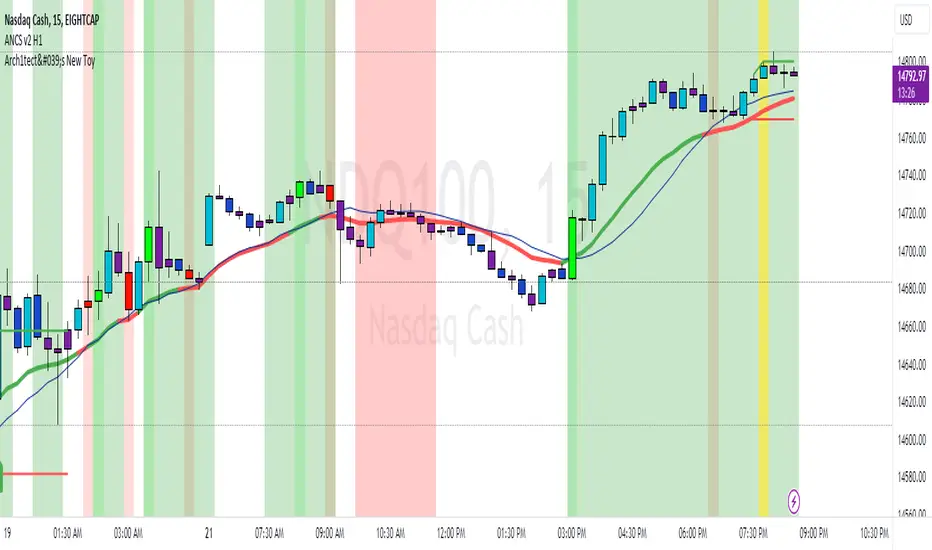
Arch1tect's New ToyDescription:
Arch1tect's New Toy tries to predict market trends by simply utilising 2 moving averages crossovers.
How it works:
Buy signals are triggered when the faster MA crosses over the slower MA from the downside to the upside.
Sell signals are triggered when the faster MA crosses under the slower MA from the upside to the downside.
How to use:
Take buys when buy signal is triggered AND close existing sell position
Take sells when sell signal is triggered AND close existing buy position
Note:
Settings are optimised for XAUUSD on the M1 chart.
Extra:
Alerts are included.
You can toggle between EMA , WMA and SMA to your liking.
Strategy Tester version:
Arch1tect's New Toy (Strategy Tester Version)Description:
The version of Arch1tect's New Toy indicator with Strategy Tester added.
This indicator tries to predict market trends by simply utilising 2 moving averages crossovers.
How it works:
Buy signals are triggered when the faster MA crosses over the slower MA from the downside to the upside.
Sell signals are triggered when the faster MA crosses under the slower MA from the upside to the downside.
How to use:
Take buys when buy signal is triggered AND close existing sell position
Take sells when sell signal is triggered AND close existing buy position
Note:
Settings are optimised for XAUUSD on the M1 chart.
Extra:
Alerts are included.
You can toggle between EMA, WMA and SMA to your liking.
Indicator version:

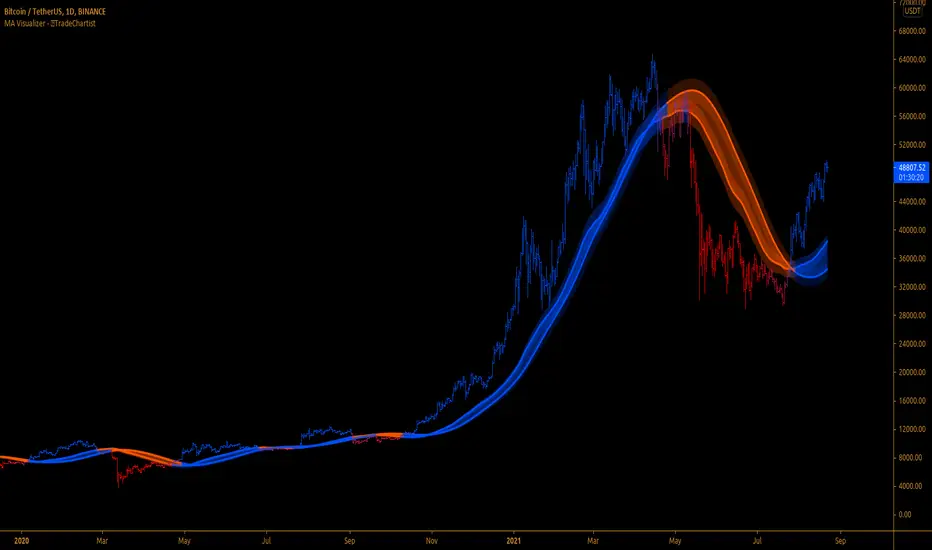
MA Visualizer™TradeChartist MA Visualizer is a Moving Average based indicator aimed to visualize price action in relation to the Moving Average in a visually engaging way.
===================================================================================================================
█ MA Visualizer Features
11 different Moving Averages to choose from the settings to visualize based on MA Visualizer Length (Default - 55 period SMA).
2 Smoothing options (default - 0, 0 uses MA length as Smoothing factor, 1 uses no Smoothing).
4 colour themes to choose from and option to adjust Visualizer Vibrance.
█ Example Charts
1. 1hr chart of OANDA:XAUUSD using 55 period WMA.
2. 15m chart of OANDA:EURUSD using 144 period Tillson T3 MA.
3. 4 hr chart of OANDA:US30USD using 55 period SMMA.
===================================================================================================================
Best Practice: Test with different settings first using Paper Trades before trading with real money
===================================================================================================================
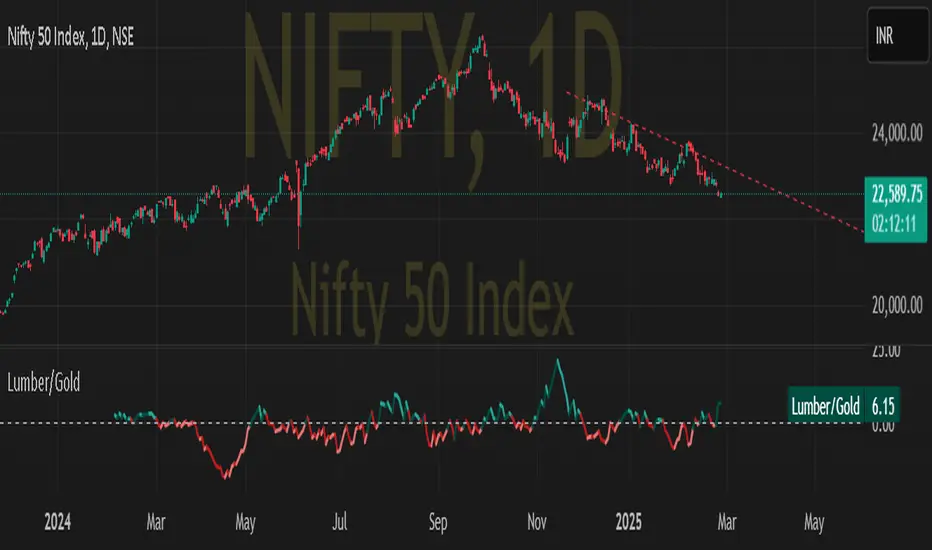
Lumber to Gold ratioDISCRIPTION:-
Lumber to gold ratio helps to predict up upcomming market correction as investors are flocking towards safe heaven.
USE CASE SCENARIO:-
If the ratio is above the zero horizontal line it is a risk of scenario
If the ratio plunge below zero it might show imminent market correction.