Futures Playbook: VWAP + OR + Cross-Asset TellsFutures Playbook: VWAP + OR + Cross-Asset Tells (with Trade Messages + Coach Panel)
This all-in-one futures trading toolkit combines Opening Range (OR) levels, VWAP, and cross-asset signals to help traders quickly read intraday structure, manage execution, and filter noise.
Core Features
• Opening Range (OR):
• Customizable OR window with High/Low and Midpoint.
• Automatic shading of the OR zone.
• VWAP & Bands:
• Built-in or session-anchored VWAP.
• Optional standard deviation bands for context.
• Cross-Asset Tells:
• Live reads on US 10Y yield, DXY, Crude, and Gold.
• Regime detection: rates risk, USD strength, energy softness, and real-rate easing.
• Confirmations:
• Volume vs. moving average filter.
• Cumulative delta with smoothing.
• ATR-based chop filter to avoid low-quality trends.
Trade Messages + Coach Panel
• Trade Messages (labels): Automatic on-chart prompts for OR completion, VWAP reclaim/loss, long/short setups, and EU close flows.
• Coach Panel (table): Real-time dashboard with regime context, directional bias, execution notes, risk reminders, and key levels (ORH, ORL, VWAP).
Alerts
• OR breakout (long/short with confirmations).
• VWAP reclaim or loss.
• 10Y yield crossing risk threshold.
Use Case
Designed for futures traders and scalpers who rely on VWAP + OR dynamics and need cross-asset confirmation before committing to trades. Great for structuring entries, managing risk, and filtering market noise throughout the session.
Cari skrip untuk "scalping"

Interval Price AlertsInterval Price Alerts
A versatile indicator that creates horizontal price levels with customizable alerts. Perfect for tracking multiple price levels simultaneously without having to create individual horizontal lines manually.
Features:
• Create evenly spaced price levels between a start and end price
• Customizable price interval spacing
• Optional price labels with flexible positioning
• Alert capabilities for both price crossovers and crossunders
• Highly customizable visual settings
Settings Groups:
1. Price Settings
• Start Price: The lower boundary for price levels
• End Price: The upper boundary for price levels
• Price Interval: The spacing between price levels
2. Line Style
• Line Color: Choose any color for the price level lines
• Line Style: Choose between Solid, Dashed, or Dotted lines
• Line Width: Adjustable from 2-4 pixels (optimized for opacity)
• Line Opacity: Control the transparency of lines (0-100%)
3. Label Style
• Show Price Labels: Toggle price labels on/off
• Label Color: Customize label text color
• Label Size: Choose from Tiny, Small, Normal, or Large
• Label Position: Place labels on Left or Right side
• Label Background: Set the background color
• Background Opacity: Control label background transparency
• Text Opacity: Adjust label text transparency
4. Alert Settings
• Alert on Crossover: Enable/disable upward price cross alerts
• Alert on Crossunder: Enable/disable downward price cross alerts
Usage Tips:
• Great for marking key price levels, support/resistance zones
• Useful for tracking multiple entry/exit points
• Perfect for scalping when you need to monitor multiple price levels
• Ideal for pre-market planning and level setting
Notes:
• Line width starts at 2 for optimal opacity rendering
• Labels can be fully customized or hidden completely
• Alert messages include the symbol and price level crossed

CARDIC2.0
Cardic Heat 2.0 – The Beginning of It All
Cardic Heat 2.0 was the very first release that introduced the **Cardic Heat concept** to traders worldwide. It was designed to cut through chart noise and give traders something clean, simple, and effective — a tool that actually highlights where the market heat really is.
Key Features:
* First-ever Heat Zones – Liquidity and reaction zones made visible for the first time.
* Simple Range Mapping – Early DR/IDR levels to guide intraday moves.
* Scalping Ready – Focused on the 5M and 15M timeframes for fast setups.
* Beginner Friendly – Straightforward visuals anyone could follow.
* Foundation Build – Created the structure for future Cardic Heat upgrades.
Why Cardic Heat 2.0?
Because this was the origin the version that started the journey. It gave traders their first taste of institutional precision in a simplified way, proving that smart trading doesn’t need to be complicated.
From this point, the vision was clear: Cardic Heat 2.0 lit the spark that grew into the Cardic Nexus movement.

Dynamic EMA Stack Support & ResistanceEvery trader needs reliable support and resistance — but static zones and lagging indicators won't cut it in fast-moving markets. This script combines a Fibonacci-based 5-EMA stacking system and left/right pivots that create dynamic support & resistance logic to uncover real-time structural shifts & momentum zones that actually adapt to price action. This isn’t just a mashup — it’s a complete built-from-the-ground-up support & resistance engine designed for scalpers, intraday traders, and trend followers alike.
🧠 🧠 🧠What It Does🧠 🧠 🧠
This script uses two powerful engines working in sync:
1️⃣ EMA Stack (5-EMA Framework)
Built on Fibonacci-based lengths: 5, 8, 13, 21, 34, (configurable) this stack identifies:
🔹 Bullish Stack: EMAs aligned from fastest to slowest (uptrend confirmation)
🔹 Bearish Stack: EMAs aligned inversely (downtrend confirmation)
🟡 Narrowing Zones: When EMAs compress within ATR thresholds → possible breakout or reversal zone
🎯 Labels identify key transitions like:
✅"Begin Bear Trend?"
✅"Uptrend SPRT"
✅"RES?" (resistance test)
2️⃣ Pivot-Based Projection Engine
Using classic Left/Right Bar pivot logic, the script:
📌 Detects early-stage swing highs/lows before full confirmation
📈 Projects horizontal S/R lines that adapt to market structure
🔁 Keeps lines active until a new pivot replaces them
🧩 Syncs beautifully with EMA stack for confluence zones
🎯🎯🎯Key Features for Traders🎯🎯🎯
✅ Trend Detection
→ EMA order reveals real-time bias (bullish, bearish, compression)
✅ Dynamic S/R Zones
→ Historical support/resistance levels auto-draw and extend
✅ Smart Labeling
→ “SPRT”, “RES”, and “Trend?” labels for live context + testing logic
✅ Custom Candle Coloring
→ Choose from Bar Color or Full Candle Overlay modes
✅ Scalper & Swing Compatible
→ Use fast confirmations for scalping or stack consistency for longer trends
⚙️⚙️⚙️How to Use⚙️⚙️⚙️
✅Use Top/Bottom (trend state) Line Colors to quickly read trend conditions.
✅Use Pivot-based support/resistance projections to anticipate where price might pause or reverse.
✅Watch for yellow/blue zones to prepare for volatility shifts/reversals.
✅Combine with volume or momentum indicators for added confirmation.
📐📐📐Customization Options📐📐📐
✅EMA lengths (5, 8, 13, 21, 34) — fully configurable - try 21,34,55, 89, 144 for longer term trend states
✅Left/Right bar pivot settings (default: 21/5)
✅Label size, visibility, and color themes
✅Toggle line and label visibility for clean layouts
✅“Max Bars Back” to control how deep history is scanned safely
🛠🛠🛠Built-In Safeguards🛠🛠🛠
✅ATR-based filters to stabilize compression logic
✅Guarded lookback (max_bars_back) to avoid runtime errors
✅Works on any asset, any timeframe
🏁🏁🏁Final Word🏁🏁🏁
This script is not just a visual tool, it’s a complete trend and structure framework. Whether you're looking for clean trend alignment, dynamic support/resistance, or early warning labels, this system is tuned to help you react with confidence — not hindsight.
Rembember, no single indicator should be used in isolation. For best results, combine it with price action analysis, higher-timeframe context, and complementary tools like trendlines, moving averages etc Use it as part of a well-rounded trading approach to confirm setups — not to define them alone.
💡💡💡Turn logic into clarity. Structure into trades. And uncertainty into confidence.💡💡💡

oi + funding oscillator cryptosmartThe oi + funding oscillator cryptosmart is an advanced momentum tool designed to gauge sentiment in the crypto derivatives market. It combines Open Interest (OI) changes with Funding Rates, normalizes them into a single oscillator using a z-score, and identifies potential market extremes.
This provides traders with a powerful visual guide to spot when the market is over-leveraged (overheated) or when a significant deleveraging event has occurred (oversold), signaling potential reversals.
How It Works
Combined Data: The indicator tracks the rate of change in Open Interest and the value of Funding Rates.
Oscillator: It blends these two data points into a single, smoothed oscillator line that moves above and below a zero line.
Extreme Zones:
Overheated (Red Zone): When the oscillator enters the upper critical zone, it suggests excessive greed and high leverage, increasing the risk of a sharp correction (long squeeze). A cross below this level generates a potential sell signal.
Oversold (Green Zone): When the oscillator enters the lower critical zone, it indicates panic, liquidations, and a potential market bottom. A cross above this level generates a potential buy signal.
Trading Strategy & Timeframes
This oscillator is designed to be versatile, but its effectiveness can vary depending on the timeframe.
Optimal Timeframes (1H and 4H): The indicator has shown its highest effectiveness on the 1-hour and 4-hour charts. These timeframes are ideal for capturing significant shifts in market sentiment reflected in OI and funding data, filtering out short-term noise while still providing timely reversal signals.
Lower Timeframes (e.g., 1-min, 5-min, 15-min): On shorter timeframes, the oscillator is still a highly effective tool, but it is best used as a confluence factor within a broader trading system. Due to the increased noise on these charts, it is not recommended to use its signals in isolation. Instead, use it as a final argument for entry. For example, if your primary scalping strategy gives you a buy signal, you can check if the oscillator is also exiting the oversold (green) zone to add a powerful layer of confirmation to your trade.
Heikin FlowHeikin Flow
by Ben Deharde, 2025
Overview
Heikin Flow is a trend and momentum oscillator built on a smoothed reverse-Heikin-Ashi baseline. It quantifies the distance between price and this baseline, then colors the histogram to reflect both direction and acceleration/deceleration. Use it standalone to read trend energy and shifts, or pair it with Heikin Rider for momentum-aware breakout confirmation.
What It Does
Computes a reverse-HA baseline and optionally smooths it with a selectable MA.
Plots a histogram of distance (price minus baseline) to visualize directional pressure.
Colors the histogram by trend state (above/below baseline) and momentum (accelerating vs. decelerating).
Provides alerts on zero-line crosses to spotlight potential momentum regime changes.
The histogram also helps to spot divergence between price and momentum (e.g., price making new highs while the histogram weakens).
How It Works
Reverse-HA Baseline
Heikin Flow derives a “reverse close” value from Heikin Ashi context (using prior HA open/close with current bar range) to capture underlying pressure. This value is range-bounded to avoid extremes, then optionally smoothed. The resulting line acts as a soft directional baseline.
Smoothing (Noise Control)
Choose SMA/EMA/HMA/VWMA/RMA and a length to control baseline responsiveness. Shorter lengths react faster, longer lengths emphasize trend consistency by filtering noise—useful when pairing with breakout tools like Rider.
Trend & Momentum Logic
Trend: If price is above the baseline, the environment is considered uptrend; below indicates downtrend.
Momentum: The change in distance bar-to-bar distinguishes acceleration (growing distance) from deceleration (shrinking distance).
This dual readout helps you see not just direction, but the quality of that direction—strong push vs. weakening move.
Coloring (Aligned with Heikin Rider Palette)
Deep Blue: Uptrend & accelerating
Light Blue: Uptrend & decelerating
Deep Red: Downtrend & accelerating
Soft Orange: Downtrend & decelerating
This mirrors the palette logic from Heikin Rider for immediate visual consistency across the suite.
How to use
Read the histogram above/below zero (price–baseline) as directional bias; watch color changes for momentum context.
Use zero-line crosses as momentum regime shifts; confirm with price action or Heikin Rider breakout signals.
Watch for divergence between price action and the histogram as an early clue of weakening moves.
Adjust smoothing method/length to fit your market and timeframe—faster for scalping, slower to highlight sustained trends.
Inputs
Smoothing Type & Length for the baseline (SMA/EMA/HMA/VWMA/RMA)
Info Box toggles (display and formatting)
Live Mode option for real-time vs. confirmed-bar behavior (avoids inadvertent lookahead)
Originality
Heikin Flow adapts the HA-driven methodology to an oscillator that focuses on distance-to-baseline and momentum quality, using a reverse-HA construction and flexible MA smoothing—complementing Heikin Rider’s smoothed HA envelope breakout design for a cohesive, momentum-aware workflow.
Alerts
Bullish Heikin Flow Cross — distance crosses above 0 (on bar close)
Bearish Heikin Flow Cross — distance crosses below 0 (on bar close)

CCI Stochastic - YOSI
CCI Stochastic (Pro v6) – MTF, Adaptive Bands & Live Label
What it does
This indicator applies a Stochastic calculation on the CCI (K/D lines) to highlight momentum shifts, overbought/oversold zones, and adaptive market regimes. It comes with optional higher-timeframe confirmation, adaptive volatility bands, a live value label, and built-in alerts.
Key Features
Core Signal: Choose between D or K line of the Stoch-CCI.
Extreme Zones: Customizable OB/OS thresholds (default 80/20) and a midline (50), with dynamic background shading.
Adaptive Bands (optional): Mean ± k·standard deviation of the signal, to capture cyclic extremes.
MTF Confirmation (optional): Fetches the same signal from a higher timeframe via request.security.
Arrows/Signals:
Enter – Cross above OS (Buy) / below OB (Sell).
Center – Cross of the 50 midline (momentum shift).
Exit – Exit from extreme zones.
Alerts: All arrow signals + adaptive band crosses.
Live Value Label: Shows the latest signal value near the last bar, customizable decimals/offset/background colors.
Visuals: Red line above OB, green below OS, gray neutral; adaptive band fills.
Use Cases
Momentum / Reversals: Enter with OS/OB crosses confirmed by MTF.
Trend validation: Combine with moving averages (e.g., EMA200) or support/resistance.
Mean Reversion: Fade extreme zones, especially with adaptive band or OB/OS exit alerts.
Inputs
CCI Period, Stoch Period, Smooth K/D – core calculation.
Overbought / Oversold – thresholds (default 80/20).
Line to plot – K or D.
Show Arrows (Enter, Center, Exit) – visual control.
Adaptive Bands – length and k multiplier.
Higher TF – optional confirmation timeframe.
Live Label – decimals, offset, colors.
Quick Tips
For scalping/short-term setups: tighten OB/OS (e.g., 85/15) to filter noise.
In high volatility: increase adaptLen or decrease k to smooth bands.
Reduce false signals: require local + MTF alignment (e.g., only long if MTF > 50).
Disclaimer
This is a technical analysis tool – not a standalone buy/sell signal. Always use with proper risk management, key levels, and confluence from multiple factors.
מה זה עושה?
האינדיקטור מחשב Stochastic על CCI (קו K/D) ומציג אזורי קיצון, חציות ומשטרי שוק. הוא כולל אופציה לאישור מטיימפריים גבוה, בנדים אדפטיביים, תווית ערך חיה והתרעות מוכנות.
יכולות עיקריות
סיגנל מרכזי: בחירה בין קו D או K של Stoch-CCI.
אזורי קיצון: קווים ניתנים להגדרה (ברירת מחדל 80/20) וקו אמצע 50, עם צביעת רקע דינמית כשנכנסים לקיצון.
Adaptive Bands (אופציונלי): ממוצע ± k·סטיית תקן של הסיגנל—מסייע לזהות overheat ומחזוריות.
אישור MTF (אופציונלי): אותו סיגנל מטיימפריים גבוה באמצעות request.security.
חיצים/סיגנלים:
Enter – חציה מלמטה מעל OS (קנייה) / מלמעלה מתחת OB (מכירה).
Center – חציה של 50 (שינוי מומנטום).
Exit – יציאה מאזורים קיצוניים (OS/OB).
Alerts: לכל הסיגנלים לעיל + כניסה/יציאה לבנדים האדפטיביים.
תווית ערך חיה: מציגה את ערך הסיגנל האחרון ליד הנקודה (ספרות ו־offset ניתנים להגדרה).
עיצוב קריא: צבע קו אדום מעל OB, ירוק מתחת OS, אפור ניטרלי; מילוי אזורים.
שימוש מומלץ
מומנטום/היפוכים: כניסה עם חציה מה-OS/OB ואישור מה-MTF.
ממוצע נע/רמות מחיר: חברו לאימות מגמה (למשל EMA200 או תמיכה/התנגדות).
Mean Reversion: חיפוש חזרה מאזורי קיצון, במיוחד כשיש התרעת יציאה מ-OB/OS או נגיעה בבנד אדפטיבי.
קלטים מרכזיים
CCI Period, Stoch Period, Smooth K/D – פרמטרי חישוב.
Overbought / Oversold – ספי קיצון (ברירת מחדל 80/20).
Line to plot – בחירה בין K או D.
Show Arrows/Center/Exit/Enter – שליטה בתצוגת החיצים.
Adaptive Bands (len, k) – חלון ורגישות לבנדים.
Higher TF – טיימפריים לאישור (אופציונלי).
Live Label – ספרות, היסט ברים, צבעי רקע.
טיפים מהירים
בסקלפים/טווחים קצרים: הקשיחו ספי קיצון (למשל 85/15) להפחתת רעש.
בשוק תנודתי: העלו את adaptLen או הורידו את k כדי לקבל בנדים רגישים פחות.
להקטנת אותות שווא: דרשו התאמה בין הסיגנל המקומי ל-MTF (לדוגמה, לונג רק כשה-MTF מעל 50).
הערה חשובה
זהו כלי ניתוח טכני—לא אות קנייה/מכירה בפני עצמו. שלבו אותו עם ניהול סיכונים (SL/TP), בדיקת רמות מפתח ואימות ממספר אינדיקטורים או טיימפריימים.

HeatCandleHeatCandle - AOC Indicator
✨ Features
📊 Heat-Map Candles: Colors candles based on the price’s deviation from a Triangular Moving Average (TMA), creating a heat-map effect to visualize price zones.
📏 Zone-Based Coloring: Assigns colors to 20 distinct zones (Z0 to Z19) based on the percentage distance from the TMA, with customizable thresholds.
⚙️ Timeframe-Specific Zones: Tailored zone thresholds for 1-minute, 5-minute, 15-minute, 30-minute, 1-hour, and 4-hour timeframes for precise analysis.
🎨 Customizable Visuals: Gradient color scheme from deep blue (oversold) to red (overbought) for intuitive price movement interpretation.
🛠️ Adjustable Parameters: Configure TMA length and threshold multiplier to fine-tune sensitivity.
🛠️ How to Use
Add to Chart: Apply the "HeatCandle - AOC" indicator on TradingView.
Configure Inputs:
TMA Length: Set the period for the Triangular Moving Average (default: 150).
Threshold Multiplier: Adjust the multiplier to scale zone sensitivity (default: 1.0).
Analyze: Observe colored candles on the chart, where colors indicate the price’s deviation from the TMA:
Dark blue (Z0) indicates strong oversold conditions.
Red (Z19) signals strong overbought conditions.
Track Trends: Use the color zones to identify potential reversals, breakouts, or trend strength based on price distance from the TMA.
🎯 Why Use It?
Visual Clarity: The heat-map candle coloring simplifies identifying overbought/oversold conditions at a glance.
Timeframe Flexibility: Zone thresholds adapt to the selected timeframe, ensuring relevance across short and long-term trading.
Customizable Sensitivity: Adjust TMA length and multiplier to match your trading style or market conditions.
Versatile Analysis: Ideal for scalping, swing trading, or trend analysis when combined with other indicators.
📝 Notes
Ensure sufficient historical data for accurate TMA calculations, especially with longer lengths.
The indicator is most effective on volatile markets where price deviations are significant.
Pair with momentum indicators (e.g., RSI, MACD) or support/resistance levels for enhanced trading strategies.
Happy trading! 🚀📈

Info Panel (RSI, ADX, Volume,EMA, Delta)📊 Info Panel PRO — All-in-One Trader Dashboard
Simplify market analysis at a glance.
This powerful indicator displays key market metrics in a compact, customizable table directly overlaid on your chart — ideal for day trading, scalping, and swing trading strategies.
🔍 What’s Included:
✅ RSI (Relative Strength Index) — Measures overbought/oversold conditions.
✅ ADX (Average Directional Index) — Gauges trend strength (>25 = strong trend).
✅ Price vs 200 EMA on 4H timeframe — Strategic support/resistance level for multi-timeframe context.
✅ Current Bar Volume — Color-coded to reflect bullish/bearish sentiment.
✅ Volume Delta — Net buying/selling pressure on your chosen timeframe (default: 1 minute).
✅ CVD (Cumulative Volume Delta) — Daily running total of delta, resets each new trading day.
⚙️ Fully Customizable Settings:
Adjustable lengths for RSI, ADX, and EMA.
Select delta calculation timeframe — lower = more granular (e.g., “1” for 1-minute precision).
Table position: top/bottom left/right corners.
Color themes: Customize bullish, bearish, and neutral colors to match your style.
💡 Who Is This For?
Scalpers & Day Traders needing real-time market context without clutter.
Swing & Position Traders monitoring higher-timeframe structure and momentum.
Order Flow & Volume Analysts tracking buyer/seller imbalance via delta and CVD.
Beginners learning to read markets through consolidated, intuitive indicators.
🎯 Key Benefits:
✅ Clean, minimalist UI — stays out of your way while delivering critical data.
✅ Auto-formatting for large numbers (K, M, B) — easy readability.
✅ Visual cues (arrows, color coding) for instant decision-making.
✅ Works across all markets: Forex, Stocks, Crypto, Futures.
📌 How to Use:
Add the indicator to your chart.
Tweak settings to fit your trading style.
Monitor real-time updates — all essential metrics visible in one place.
Combine with other strategies (price action, S/R, VWAP) for signal confirmation.
📌 Pro Tip: For maximum edge, pair Info Panel PRO with liquidity zones, VWAP, or Market Profile tools.
📈 Trade smarter — let the market speak to you in clear, actionable terms.
Author:
Version: 1.0
Language: Pine Script v5
Overlay: Yes (draws directly on price chart)
😄
“If this indicator were a person, they’d be called ‘The One Who Knows Everything… But Never Gives Unsolicited Advice.’
…Unlike your ‘friend’ who yells ‘BUY!’ five minutes before the market crashes.”
“A good trader isn’t the one who predicts the market.
It’s the one who has everything on their chart — coffee optional.
…Want the next indicator? Comment ‘YES’ below — and I’ll build you ‘Smart Alert PRO’ or ‘Volume Sniper’ next.”
P.S. If this script saves even ONE trade — hit 👍.
If it saves TWO — comment “THANK YOU” 🙏
If it saves THREE — expect “Volume Heatmap PRO” next week 😉🔥

Gold H4 First Hour Scalping IndicatorUpdated V4
This Indicator shows how much on an average gold moved in first 4 hour. Then The possible direction in the next h4

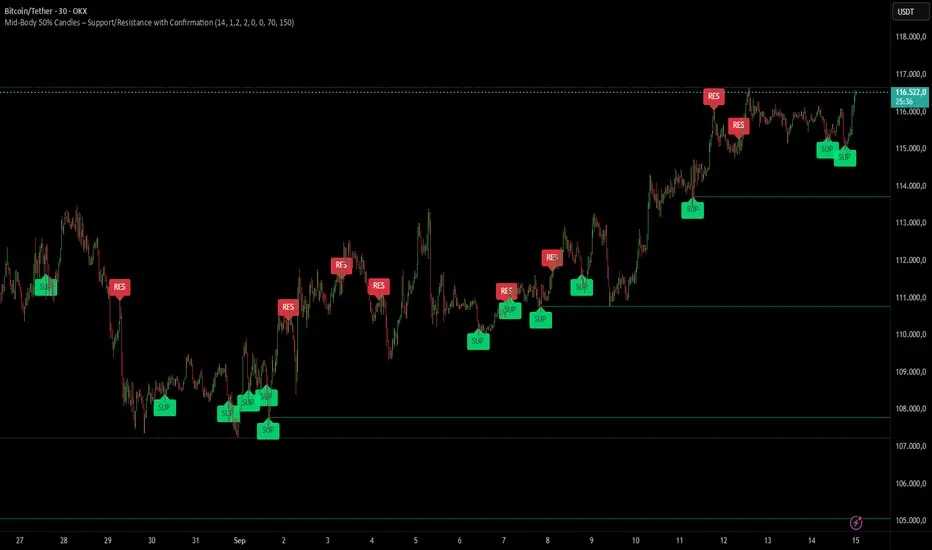
Mid-Body 50% Candles – Support/Resistance with ConfirmationHow it works:
– Calculates the mid-body (open+close)/2 of the previous candle.
– Bullish candle → potential SUP level.
– Bearish candle → potential RES level.
– Optional next-bar confirmation (close above/below the mid-body).
– Filters available: ATR size, swing detection, upper/lower wick %.
– Lines extend until broken or removed.
– Alerts available for: level creation, touch and break.
Use cases:
– Confirm candle rejections (pin bars).
– Filter false breakouts.
– Refine entries/exits for scalping or swing trading.
What makes it unique:
Unlike generic Fibonacci or candle tools, this script focuses exclusively on the 50% body level with confirmations and multiple filters, making it more precise for price action decision points.
Iani SMC Sniper XAU v2.2 (Long+Short + News Countdown, v6)Iani SMC Sniper XAU (v2.2) — smart-money logic for XAUUSD.
This indicator hunts “sniper entries” using a simple SMC sequence:
Sweep → BOS → 50% FVG entry
• After London session builds its range, we wait for a liquidity sweep (price dips below London Low for longs / wicks above London High for shorts).
• A BOS confirms direction (close breaks the last swing).
• First FVG that prints after BOS gives the entry at 50% (mid-gap).
• SL anchored to the protective swing (with a small safety buffer). TP is plotted using your Risk:Reward.
News countdown (non-blocking):
The script does not auto-fetch news; you set daily times (e.g., 14:30, 16:00) and/or specific dates (“YYYY-MM-DD HH:MM”). A countdown label shows “NEWS in Xm”. Signals are not blocked—this is just a safety heads-up for prop-firm rules.
Inputs: pivot length, RR, pip size (XAU default 0.10), session filter (after London), news times (recurring & absolute), show/hide levels & labels.
Plots & labels: London High/Low (daily), Entry/SL/TP lines, BOS/Sweep/BUY/SELL markers, news badge.
Alerts: BOS Bull/Bear, BUY/SELL Entry touch, TP/SL hit, NEWS WARNING.
Notes:
• Designed for XAUUSD intraday; works on other symbols if you adjust pip size.
• Uses symbol timezone; adjust your news times for DST if needed.
• Indicator only—no orders, no backtest. Manage risk and execution in MT5/your platform.
Changelog (v2.2): Pine v6, robust time parsing, one-line logical expressions (fixed EOL errors), mirrored short logic, cleaner London H/L reset, countdown label.
Disclaimer: Educational tool, not financial advice. Past performance ≠ future results.
Tags: SMC, ICT, XAUUSD, Gold, Liquidity Sweep, BOS, FVG, London Session, News, Intraday, Scalping, DayTrading.

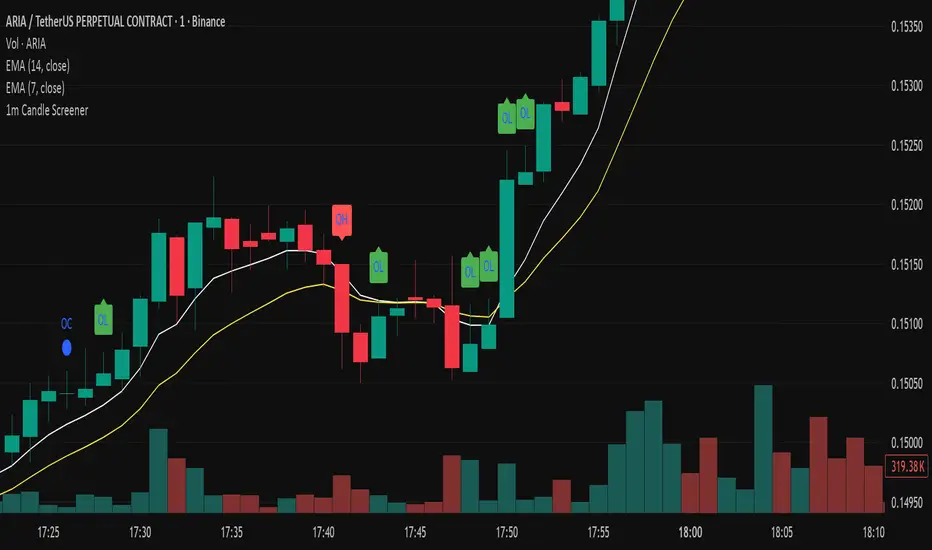
Precision Candle Marker – OL/OH/OC ScreenerThis indicator highlights high-probability precision candles on any perpetual contract, designed especially for scalpers and short-term traders.
It marks three unique candle setups on the 1-minute chart (works on other timeframes too):
🟢 Open = Low (OL) → Strong bullish momentum, buyers took control instantly.
🔴 Open = High (OH) → Strong bearish momentum, sellers took control instantly.
🔵 Open = Close (OC) → Doji / indecision candle, potential reversal or continuation signal.
Use cases:
Identify breakout entry points in uptrend/downtrend.
Filter noise and focus on precision candles.
Combine with trend indicators (EMA, VWAP, RSI) for confirmation.
This tool is best suited for scalping perpetual contracts (e.g., BTCUSDT, ETHUSDT) but works on any symbol and timeframe.
Swing Oracle Stock 2.0- Gradient Enhanced# 🌈 Swing Oracle Pro - Advanced Gradient Trading Indicator
**Transform your technical analysis with stunning gradient visualizations that make market trends instantly recognizable.**
## 🚀 **What Makes This Indicator Special?**
The **Swing Oracle Pro** revolutionizes traditional technical analysis by combining advanced NDOS (Normalized Distance from Origin of Source) calculations with a sophisticated gradient color system. This isn't just another indicator—it's a complete visual trading experience that adapts colors based on market strength, making trend identification effortless and intuitive.
## 🎨 **10 Professional Gradient Themes**
Choose from carefully crafted color schemes designed for optimal visual clarity:
- **🌅 Sunset** - Warm oranges and purples for classic elegance
- **🌊 Ocean** - Cool blues and teals for calm analysis
- **🌲 Forest** - Natural greens and browns for organic feel
- **✨ Aurora** - Ethereal greens and magentas for mystique
- **⚡ Neon** - Vibrant electric colors for high-energy trading
- **🌌 Galaxy** - Deep purples and cosmic hues for night sessions
- **🔥 Fire** - Intense reds and golds for volatile markets
- **❄️ Ice** - Cool whites and blues for clear-headed decisions
- **🌈 Rainbow** - Full spectrum for comprehensive analysis
- **⚫ Monochrome** - Professional grays for focused trading
## 📊 **Core Features**
### **Advanced NDOS System**
- Normalized Distance from Origin of Source calculation with 231-period length
- Smoothed with customizable EMA for reduced noise
- Multi-timeframe confirmation with H1 filter option
- Dynamic gradient coloring based on oscillator position
### **Intelligent Visual Feedback**
- **Primary Gradient Line** - Main NDOS plot with dynamic color transitions
- **Gradient Fill Zones** - Beautiful color-coded areas for bullish, neutral, and bearish regions
- **Smart Transparency** - Colors adjust intensity based on market volatility
- **Dynamic Backgrounds** - Subtle gradient backgrounds that respond to market conditions
### **Enhanced EMA Projection System**
- 75/760 period EMA normalization with 50-period lookback
- Gradient-colored projection line for trend forecasting
- Toggleable display with advanced gradient controls
- Price tracking for precise level identification
### **Multi-Timeframe Analysis Table**
- Real-time trend analysis across 6 timeframes (1m, 3m, 5m, 15m, 1H, 4H)
- Gradient-colored cells showing trend strength
- Customizable table size and position
- Professional emoji indicators (🚀 UP, 📉 DOWN, ➡️ FLAT)
### **Signal System**
- **Gradient Buy Signals** - Triangle up arrows with intensity-based coloring
- **Gradient Sell Signals** - Triangle down arrows with strength indicators
- **Alert Conditions** - Built-in alerts for all signal types
- **7-Day Cycle Tracking** - Tuesday-to-Tuesday weekly cycle visualization
## ⚙️ **Customization Controls**
### **🎨 Gradient Controls**
- **Gradient Intensity** - Adjust color vibrancy (0.1-1.0)
- **Gradient Smoothing** - Control color transition smoothness (1-10 periods)
- **Dynamic Background** - Toggle animated background gradients
- **Advanced Gradients** - Enable/disable EMA projection and enhanced features
### **🛠️ Custom Color System**
- **Bullish Colors** - Define custom start/end colors for bull markets
- **Bearish Colors** - Set personalized bear market gradients
- **Full Theme Override** - Create completely custom color schemes
- **Real-time Preview** - See changes instantly on your chart
## 📈 **How to Use**
1. **Choose Your Theme** - Select from 10 professional gradient themes
2. **Configure Levels** - Adjust high/low levels (default 60/40) for your timeframe
3. **Set Smoothing** - Fine-tune gradient smoothing for your trading style
4. **Enable Features** - Toggle background gradients, candlestick coloring, and advanced EMA projection
5. **Monitor Signals** - Watch for gradient buy/sell arrows and multi-timeframe confirmations
## 🎯 **Trading Applications**
- **Swing Trading** - Perfect for identifying medium-term trend changes
- **Scalping** - Multi-timeframe table provides quick trend confirmation
- **Position Sizing** - Gradient intensity shows signal strength for risk management
- **Market Analysis** - Beautiful visualizations make complex data instantly understandable
- **Education** - Ideal for learning market dynamics through visual feedback
## ⚡ **Performance Optimized**
- **Smart Rendering** - Colors update only on significant changes
- **Efficient Calculations** - Optimized algorithms for smooth performance
- **Memory Management** - Minimal resource usage even with complex gradients
- **Real-time Updates** - Responsive to market changes without lag
## 🚨 **Alert System**
Built-in alert conditions notify you when:
- NDOS crosses above high level (Buy Signal)
- NDOS crosses below low level (Sell Signal)
- Multi-timeframe confirmations align
- Customizable alert messages with emoji indicators
## 🔧 **Technical Specifications**
- **PineScript Version**: v6 (Latest)
- **Overlay**: True (plots on main chart)
- **Calculations**: NDOS, EMA normalization, volatility-based transparency
- **Timeframes**: Compatible with all timeframes
- **Markets**: Stocks, Forex, Crypto, Commodities, Indices
## 💡 **Why Choose Swing Oracle Pro?**
This isn't just another technical indicator—it's a complete visual transformation of your trading experience. The gradient system provides instant visual feedback that traditional indicators simply can't match. Whether you're a beginner learning to read market trends or an experienced trader seeking clearer signals, the Swing Oracle Pro delivers professional-grade analysis with unprecedented visual clarity.
**Experience the future of technical analysis. Your charts will never look the same.**
---
*⚠️ Disclaimer: This indicator is for educational and informational purposes only. Past performance does not guarantee future results. Always conduct your own research and consider risk management before making trading decisions.*
**🔔 Like this indicator? Please leave a comment and boost! Your feedback helps improve future updates.**
---
**📝 Tags:** #GradientTrading #SwingTrading #NDOS #MultiTimeframe #TechnicalAnalysis #VisualTrading #TrendAnalysis #ColorCoded #ProfessionalCharts #TradingToo

Multiple Colored Moving AveragesMULTIPLE COLORED MOVING AVERAGES - USER GUIDE
DISCLAIMER
----------
Both the code and this documentation were created heavily using artificial intelligence. I'm lazy...
This indicator was inspired by repo32's "Moving Average Colored EMA/SMA" indicator. *
What is this indicator?
-----------------------
This is a TradingView indicator that displays up to 4 different moving averages on your chart simultaneously. Each moving average can be customized with different calculation methods, colors, and filtering options.
Why would I use multiple moving averages?
-----------------------------------------
- See trend direction across different timeframes at once
- Identify support and resistance levels
- Spot crossover signals between fast and slow MAs
- Reduce false signals with filtering options
- Compare how different MA types react to price action
What moving average types are available?
----------------------------------------
11 different types:
- SMA: Simple average, equal weight to all periods
- EMA: Exponential, more weight to recent prices
- WMA: Weighted, linear weighting toward recent data
- RMA: Running average, smooth like EMA
- DEMA: Double exponential, reduced lag
- TEMA: Triple exponential, even less lag
- HMA: Hull, fast and smooth combination
- VWMA: Volume weighted, includes volume data
- LSMA: Least squares, based on linear regression
- TMA: Triangular, double-smoothed
- ZLEMA: Zero lag exponential, compensated for lag
How do I set up the indicator?
------------------------------
Each MA has these settings:
- Enable/Disable: Turn each MA on or off
- Type: Choose from the 11 calculation methods
- Length: Number of periods (21, 50, 100, 200 are common)
- Smoothing: 0-10 levels of extra smoothing
- Noise Filter: 0-5% to ignore small changes
- Colors: Bullish (rising) and bearish (falling) colors
- Line Width: 1-5 pixels thickness
What does the smoothing feature do?
-----------------------------------
Smoothing applies extra calculations to make the moving average line smoother. Higher levels reduce noise but make the MA respond slower to price changes. Use higher smoothing in choppy markets, lower smoothing in trending markets.
What is the noise filter?
--------------------------
The noise filter ignores small percentage changes in the moving average. For example, a 0.3% filter will ignore any MA movement smaller than 0.3%. This helps eliminate false signals from minor price fluctuations.
When should I use this indicator?
---------------------------------
- Trend analysis: See if market is going up, down, or sideways
- Entry timing: Look for price bounces off MA levels
- Exit signals: Watch for MA slope changes or crossovers
- Support/resistance: MAs often act as dynamic levels
- Multi-timeframe analysis: Use different lengths for different perspectives
What are some good settings to start with?
-------------------------------------------
Conservative approach:
- MA 1: EMA 21 (short-term trend)
- MA 2: SMA 50 (medium-term trend)
- MA 3: SMA 200 (long-term trend)
- Low noise filtering (0.1-0.3%)
Active trading:
- MA 1: HMA 9 (very responsive)
- MA 2: EMA 21 (short-term)
- MA 3: EMA 50 (medium-term)
- Minimal or no smoothing
How do I interpret the colors?
------------------------------
Each MA changes color based on its direction:
- Bullish color: MA is rising (upward trend)
- Bearish color: MA is falling (downward trend)
- Gray: MA is flat or unchanged
What should I look for in crossovers?
-------------------------------------
- Golden Cross: Fast MA crosses above slow MA (bullish signal)
- Death Cross: Fast MA crosses below slow MA (bearish signal)
- Multiple crossovers in same direction can confirm trend changes
- Wait for clear separation between MAs after crossover
How do I use MAs for support and resistance?
---------------------------------------------
- In uptrends: MAs often provide support when price pulls back
- In downtrends: MAs may act as resistance on rallies
- Multiple MAs create support/resistance zones
- Stronger levels where multiple MAs cluster together
Can I use this with other indicators?
-------------------------------------
Yes, it works well with:
- Volume indicators for confirmation
- RSI or MACD for timing entries
- Bollinger Bands for volatility context
- Price action patterns for setup confirmation
What if I get too many signals?
-------------------------------
- Increase smoothing levels
- Raise noise filter percentages
- Use longer MA periods
- Focus on major crossovers only
- Wait for multiple MA confirmation
What if signals are too slow?
-----------------------------
- Reduce smoothing to 0
- Lower noise filter values
- Switch to faster MA types (HMA, ZLEMA, DEMA)
- Use shorter periods
- Focus on the fastest MA only
Which MA types work best in different markets?
----------------------------------------------
Trending markets: EMA, DEMA, TEMA (responsive to trends)
Choppy markets: SMA, TMA, HMA with smoothing (less whipsaws)
High volatility: Use higher smoothing and noise filtering
Low volatility: Use minimal filtering for better responsiveness
Do I need all the advanced features?
------------------------------------
No. Start with basic settings:
- Choose MA type and length
- Set colors you prefer
- Leave smoothing at 0
- Leave noise filter at 0
Add complexity only if needed to improve signal quality.
How do I know if my settings are working?
-----------------------------------------
- Backtest on historical data
- Paper trade the signals first
- Adjust based on market conditions
- Keep a trading journal to track performance
- Be willing to modify settings as markets change
Can I save different configurations?
------------------------------------
Yes, save different indicator templates in TradingView for:
- Different trading styles (scalping, swing trading)
- Different market conditions (trending, ranging)
- Different instruments (stocks, forex, crypto)

Market Order Risk CalculatorObviously the Long/Short Position tool does this, but when you are scalping, 10 - 15 seconds matters. What matters more than that is defined risk, you dont want your losses being scattered, 300 here 145 there, you want consistent risk to have consistent data.
What this does is when you are framing a trade, it provides a hands off tool that tells you exactly how many contracts to enter with, that way if you have bracket orders on, your stop will be exactly where you want it to be without going over your defined risk.

Information Flow Analysis[b🔄 Information Flow Analysis: Systematic Multi-Component Market Analysis Framework
SYSTEM OVERVIEW AND ANALYTICAL FOUNDATION
The Information Flow Kernel - Hybrid combines established technical analysis methods into a unified analytical framework. This indicator systematically processes three distinct data streams - directional price momentum, volume-weighted pressure dynamics, and intrabar development patterns - integrating them through weighted mathematical fusion to produce statistically normalized market flow measurements.
COMPREHENSIVE MATHEMATICAL FRAMEWORK
Component 1: Directional Flow Analysis
The directional component analyzes price momentum through three mathematical vectors:
Price Vector: p = C - O (intrabar directional bias)
Momentum Vector: m = C_t - C_{t-1} (bar-to-bar velocity)
Acceleration Vector: a = m_t - m_{t-1} (momentum rate of change)
Directional Signal Integration:
S_d = \text{sgn}(p) \cdot |p| + \text{sgn}(m) \cdot |m| \cdot 0.6 + \text{sgn}(a) \cdot |a| \cdot 0.3
The signum function preserves directional information while absolute values provide magnitude weighting. Coefficients create a hierarchy emphasizing intrabar movement (100%), momentum (60%), and acceleration (30%).
Final Directional Output: K_1 = S_d \cdot w_d where w_d is the directional weight parameter.
Component 2: Volume-Weighted Pressure Analysis
Volume Normalization: r_v = \frac{V_t}{\overline{V_n}} where \overline{V_n} represents the n-period simple moving average of volume.
Base Pressure Calculation: P_{base} = \Delta C \cdot r_v \cdot w_v where \Delta C = C_t - C_{t-1} and w_v is the velocity weighting factor.
Volume Confirmation Function:
f(r_v) = \begin{cases}
1.4 & \text{if } r_v > 1.2 \
0.7 & \text{if } r_v < 0.8 \
1.0 & \text{otherwise}
\end{cases}
Final Pressure Output: K_2 = P_{base} \cdot f(r_v)
Component 3: Intrabar Development Analysis
Bar Position Calculation: B = \frac{C - L}{H - L} when H - L > 0 , else B = 0.5
Development Signal Function:
S_{dev} = \begin{cases}
2(B - 0.5) & \text{if } B > 0.6 \text{ or } B < 0.4 \
0 & \text{if } 0.4 \leq B \leq 0.6
\end{cases}
Final Development Output: K_3 = S_{dev} \cdot 0.4
Master Integration and Statistical Normalization
Weighted Component Fusion: F_{raw} = 0.5K_1 + 0.35K_2 + 0.15K_3
Sensitivity Scaling: F_{master} = F_{raw} \cdot s where s is the sensitivity parameter.
Statistical Normalization Process:
Rolling Mean: \mu_F = \frac{1}{n}\sum_{i=0}^{n-1} F_{master,t-i}
Rolling Standard Deviation: \sigma_F = \sqrt{\frac{1}{n}\sum_{i=0}^{n-1} (F_{master,t-i} - \mu_F)^2}
Z-Score Computation: z = \frac{F_{master} - \mu_F}{\sigma_F}
Boundary Enforcement: z_{bounded} = \max(-3, \min(3, z))
Final Normalization: N = \frac{z_{bounded}}{3}
Flow Metrics Calculation:
Intensity: I = |z|
Strength Percentage: S = \min(100, I \times 33.33)
Extreme Detection: \text{Extreme} = I > 2.0
DETAILED INPUT PARAMETER SPECIFICATIONS
Sensitivity (0.1 - 3.0, Default: 1.0)
Global amplification multiplier applied to the master flow calculation. Functions as: F_{master} = F_{raw} \cdot s
Low Settings (0.1 - 0.5): Enhanced precision for subtle market movements. Optimal for low-volatility environments, scalping strategies, and early detection of minor directional shifts. Increases responsiveness but may amplify noise.
Moderate Settings (0.6 - 1.2): Balanced sensitivity for standard market conditions across multiple timeframes.
High Settings (1.3 - 3.0): Reduced sensitivity to minor fluctuations while emphasizing significant flow changes. Ideal for high-volatility assets, trending markets, and longer timeframes.
Directional Weighting (0.1 - 1.0, Default: 0.7)
Controls emphasis on price direction versus volume and positioning factors. Applied as: K_{1,weighted} = K_1 \times w_d
Lower Values (0.1 - 0.4): Reduces directional bias, favoring volume-confirmed moves. Optimal for ranging markets where momentum may generate false signals.
Higher Values (0.7 - 1.0): Amplifies directional signals from price vectors and acceleration. Ideal for trending conditions where directional momentum drives price action.
Velocity Weighting (0.1 - 1.0, Default: 0.6)
Scales volume-confirmed price change impact. Applied in: P_{base} = \Delta C \times r_v \times w_v
Lower Values (0.1 - 0.4): Dampens volume spike influence, focusing on sustained pressure patterns. Suitable for illiquid assets or news-sensitive markets.
Higher Values (0.8 - 1.0): Amplifies high-volume directional moves. Optimal for liquid markets where volume provides reliable confirmation.
Volume Length (3 - 20, Default: 5)
Defines lookback period for volume averaging: \overline{V_n} = \frac{1}{n}\sum_{i=0}^{n-1} V_{t-i}
Short Periods (3 - 7): Responsive to recent volume shifts, excellent for intraday analysis.
Long Periods (13 - 20): Smoother averaging, better for swing trading and higher timeframes.
DASHBOARD SYSTEM
Primary Flow Gauge
Bilaterally symmetric visualization displaying normalized flow direction and intensity:
Segment Calculation: n_{active} = \lfloor |N| \times 15 \rfloor
Left Fill: Bearish flow when N < -0.01
Right Fill: Bullish flow when N > 0.01
Neutral Display: Empty segments when |N| \leq 0.01
Visual Style Options:
Matrix: Digital blocks (▰/▱) for quantitative precision
Wave: Progressive patterns (▁▂▃▄▅▆▇█) showing flow buildup
Dots: LED-style indicators (●/○) with intensity scaling
Blocks: Modern squares (■/□) for professional appearance
Pulse: Progressive markers (⎯ to █) emphasizing intensity buildup
Flow Intensity Visualization
30-segment horizontal bar graph with mathematical fill logic:
Segment Fill: For i \in : filled if \frac{i}{29} \leq \frac{S}{100}
Color Coding System:
Orange (S > 66%): High intensity, strong directional conviction
Cyan (33% ≤ S ≤ 66%): Moderate intensity, developing bias
White (S < 33%): Low intensity, neutral conditions
Extreme Detection Indicators
Circular markers flanking the gauge with state-dependent illumination:
Activation: I > 2.0 \land |N| > 0.3
Bright Yellow: Active extreme conditions
Dim Yellow: Normal conditions
Metrics Display
Balance Value: Raw master flow output ( F_{master} ) showing absolute directional pressure
Z-Score Value: Statistical deviation ( z_{bounded} ) indicating historical context
Dynamic Narrative System
Context-sensitive interpretation based on mathematical thresholds:
Extreme Flow: I > 2.0 \land |N| > 0.6
Moderate Flow: 0.3 < |N| \leq 0.6
High Volatility: S > 50 \land |N| \leq 0.3
Neutral State: S \leq 50 \land |N| \leq 0.3
ALERT SYSTEM SPECIFICATIONS
Mathematical Trigger Conditions:
Extreme Bullish: I > 2.0 \land N > 0.6
Extreme Bearish: I > 2.0 \land N < -0.6
High Intensity: S > 80
Bullish Shift: N_t > 0.3 \land N_{t-1} \leq 0.3
Bearish Shift: N_t < -0.3 \land N_{t-1} \geq -0.3
TECHNICAL IMPLEMENTATION AND PERFORMANCE
Computational Architecture
The system employs efficient calculation methods minimizing processing overhead:
Single-pass mathematical operations for all components
Conditional visual rendering (executed only on final bar)
Optimized array operations using direct calculations
Real-Time Processing
The indicator updates continuously during bar formation, providing immediate feedback on changing market conditions. Statistical normalization ensures consistent interpretation across varying market regimes.
Market Applicability
Optimal performance in liquid markets with consistent volume patterns. May require parameter adjustment for:
Low-volume or after-hours sessions
News-driven market conditions
Highly volatile cryptocurrency markets
Ranging versus trending market environments
PRACTICAL APPLICATION FRAMEWORK
Market State Classification
This indicator functions as a comprehensive market condition assessment tool providing:
Trend Analysis: High intensity readings ( S > 66% ) with sustained directional bias indicate strong trending conditions suitable for momentum strategies.
Reversal Detection: Extreme readings ( I > 2.0 ) at key technical levels may signal potential trend exhaustion or reversal points.
Range Identification: Low intensity with neutral flow ( S < 33%, |N| < 0.3 ) suggests ranging market conditions suitable for mean reversion strategies.
Volatility Assessment: High intensity without clear directional bias indicates elevated volatility with conflicting pressures.
Integration with Trading Systems
The normalized output range facilitates integration with automated trading systems and position sizing algorithms. The statistical basis provides consistent interpretation across different market conditions and asset classes.
LIMITATIONS AND CONSIDERATIONS
This indicator combines established technical analysis methods and processes historical data without predicting future price movements. The system performs optimally in liquid markets with consistent volume patterns and may produce false signals in thin trading conditions or during news-driven market events. This indicator is provided for educational and analytical purposes only and does not constitute financial advice. Users should combine this analysis with proper risk management, position sizing, and additional confirmation methods before making any trading decisions. Past performance does not guarantee future results.
Note: The term "kernel" in this context refers to modular calculation components rather than mathematical kernel functions in the formal computational sense.
As quantitative analyst Ralph Vince noted: "The essence of successful trading lies not in predicting market direction, but in the systematic processing of market information and the disciplined management of probability distributions."
— Dskyz, Trade with insight. Trade with anticipation.

Trend-Strong Candle - 3 EMAs with Filters# Trend-Strong Candle - Professional Trading Indicator
## 📊 What It Does
Identifies high-probability entries by combining triple EMA trend analysis with strong candle detection. Only signals when all conditions align for maximum accuracy.
## 🎯 Core Features
- Triple EMA System: Fast (20) / Medium (50) / Slow (200) for trend confirmation
- Strong Candle Filter: ATR-based sizing ensures genuine momentum
- Advanced Filters: EMA close validation + trend stability checks
- Live Alerts: Instant notifications for real-time signals
- Session Filter: Trade only during active EU/US market hours
## ⚡ Quick Setup
Scalping (1-5min): Default settings + enable session filter
Day Trading (15-60min): Default settings work perfectly
Swing Trading (4H+): Increase ATR multiplier to 0.8-1.0
## 📈 Trading Rules
Long Signals: Green triangle below candle
- Strong bullish candle during confirmed uptrend
- All EMAs properly aligned (Fast > Medium > Slow)
Short Signals: Red triangle above candle
- Strong bearish candle during confirmed downtrend
- All EMAs properly aligned (Fast < Medium < Slow)
## ⚠️ Critical Success Factors
1. Always Verify the Trend Yourself
The indicator helps identify signals, but YOU must confirm the larger trend context. Check higher timeframes and overall market structure before entering.
2. Understand the "Big Players"
Strong candles in trend direction usually come from institutional money (banks, funds, algorithms). These create the momentum that retail traders can follow. The indicator catches these institutional moves.
3. Distance to Next Value Level
NEVER enter if price is too close to major resistance/support levels:
- Check distance to round numbers (1.1000, 1.1050, etc.)
- Ensure at least 20-30 pips room to next key level
- You need space for profit - tight levels = limited upside
4. Risk Management
- Stop Loss: 1-2 ATR from entry
- Take Profit: 2-3 ATR target (minimum 1:2 R/R)
- Position Size: Risk max 1-2% per trade
## 💡 Pro Tips
- Best Sessions: London open (8-12 UTC) and NY open (13-17 UTC)
- Avoid: Major news, low liquidity periods, choppy markets
- Multiple Timeframes: Confirm signals on higher timeframe
- Value Levels: Always check daily/weekly support/resistance before entering
## 🎯 Success Formula
Trend Confirmation + Strong Institutional Candle + Distance to Value Levels = High Probability Trade
*
Remember: The indicator finds the signals, but successful trading requires your analysis of trend context and value level positioning. Trade smart, not just frequent.

RSI Trend Navigator [QuantAlgo]🟢 Overview
The RSI Trend Navigator integrates RSI momentum calculations with adaptive exponential moving averages and ATR-based volatility bands to generate trend-following signals. The indicator applies variable smoothing coefficients based on RSI readings and incorporates normalized momentum adjustments to position a trend line that responds to both price action and underlying momentum conditions.
🟢 How It Works
The indicator begins by calculating and smoothing the RSI to reduce short-term fluctuations while preserving momentum information:
rsiValue = ta.rsi(source, rsiPeriod)
smoothedRSI = ta.ema(rsiValue, rsiSmoothing)
normalizedRSI = (smoothedRSI - 50) / 50
It then creates an adaptive smoothing coefficient that varies based on RSI positioning relative to the midpoint:
adaptiveAlpha = smoothedRSI > 50 ? 2.0 / (trendPeriod * 0.5 + 1) : 2.0 / (trendPeriod * 1.5 + 1)
This coefficient drives an adaptive trend calculation that responds more quickly when RSI indicates bullish momentum and more slowly during bearish conditions:
var float adaptiveTrend = source
adaptiveTrend := adaptiveAlpha * source + (1 - adaptiveAlpha) * nz(adaptiveTrend , source)
The normalized RSI values are converted into price-based adjustments using ATR for volatility scaling:
rsiAdjustment = normalizedRSI * ta.atr(14) * sensitivity
rsiTrendValue = adaptiveTrend + rsiAdjustment
ATR-based bands are constructed around this RSI-adjusted trend value to create dynamic boundaries that constrain trend line positioning:
atr = ta.atr(atrPeriod)
deviation = atr * atrMultiplier
upperBound = rsiTrendValue + deviation
lowerBound = rsiTrendValue - deviation
The trend line positioning uses these band constraints to determine its final value:
if upperBound < trendLine
trendLine := upperBound
if lowerBound > trendLine
trendLine := lowerBound
Signal generation occurs through directional comparison of the trend line against its previous value to establish bullish and bearish states:
trendUp = trendLine > trendLine
trendDown = trendLine < trendLine
if trendUp
isBullish := true
isBearish := false
else if trendDown
isBullish := false
isBearish := true
The final output colors the trend line green during bullish states and red during bearish states, creating visual buy/long and sell/short opportunity signals based on the combined RSI momentum and volatility-adjusted trend positioning.
🟢 Signal Interpretation
Rising Trend Line (Green): Indicates upward momentum where RSI influence and adaptive smoothing favor continued price advancement = Potential buy/long positions
Declining Trend Line (Red): Indicates downward momentum where RSI influence and adaptive smoothing favor continued price decline = Potential sell/short positions
Flattening Trend Lines: Occur when momentum weakens and the trend line slope approaches neutral, suggesting potential consolidation before the next move
Built-in Alert System: Automated notifications trigger when bullish or bearish states change, sending "RSI Trend Bullish Signal" or "RSI Trend Bearish Signal" messages for timely entry/exit
Color Bar Candles Option: Optional candle coloring feature that applies the same green/red trend colors to price bars, providing additional visual confirmation of the current trend direction

Key Levels: Daily, Weekly, Monthly [BackQuant]Key Levels: Daily, Weekly, Monthly
Map the market’s “memory” in one glance—yesterday’s range, this week’s chosen day high/low, and D/W/M opens—then auto-clean levels once they break.
What it does
This tool plots three families of high-signal reference lines and keeps them tidy as price evolves:
Chosen Day High/Low (per week) — Pick a weekday (e.g., Monday). For each past week, the script records that day’s session high and low and projects them forward for a configurable number of bars. These act like “memory levels” that price often revisits.
Daily / Weekly / Monthly Opens — Plots the opening price of each new day, week, and month with separate styling. These opens frequently behave like magnets/flip lines intraday and anchors for regime on higher timeframes.
Auto-pruning — When price breaks a stored level, the script can automatically remove it to reduce clutter and refocus you on still-active lines. See: (broken levels removed).
Why these levels matter
Liquidity pockets — Prior day’s high/low and the daily open concentrate stops and pending orders. Mapping them quickly reveals likely sweep or fade zones. Example: previous day highs + daily open highlighting liquidity:
Context & regime — Monthly opens frame macro bias; trading above a rising cluster of monthly opens vs. below gives a clean top-down read. Example: monthly-only “macro outlook” view:
Cleaner charts — Auto-remove broken lines so you focus on what still matters right now.
What it plots (at a glance)
Past Chosen Day High/Low for up to N prior weeks (your choice), extended right.
Current Daily Open , Weekly Open , and Monthly Open , each with its own color, label, and forward extension.
Optional short labels (e.g., “Mon High”) or full labels (with week/month info).
How breaks are detected & cleaned
You control both the evidence and the timing of a “break”:
Break uses — Choose Close (more conservative) or Wick (more sensitive).
Inclusive? — If enabled, equality counts (≥ high or ≤ low). If disabled, you need a strict cross.
Allow intraday breaks? — If on, a level can break during the tracked day; if off, the script only counts breaks after the session completes.
Remove Broken Levels — When a break is confirmed, the line/label is deleted automatically. (See the demo: )
Quick start
Pick a Day of Week to Track (e.g., Monday).
Set how many weeks back to show (e.g., 8–10).
Choose how far to extend each family (bars to the right for chosen-day H/L and D/W/M opens).
Decide if a break uses Close or Wick , and whether equality counts.
Toggle Remove Broken Levels to keep the chart clean automatically.
Tips by use-case
Intraday bias — Watch the Daily Open as a magnet/flip. If price gaps above and holds, pullbacks to the daily open often decide direction. Pair with last day’s high/low for sweep→reversal or true breakout cues. See:
Weekly structure — Track the week’s chosen day (e.g., Monday) high/low across prior weeks. If price stalls near a cluster of old “Monday Highs,” look for sweep/reject patterns or continuation on reclaim.
Macro regime — Hide daily/weekly lines and keep only Monthly Opens to read bigger cycles at a glance (BTC/crypto especially). Example:
Customization
Use wicks or bodies for highs/lows (wicks capture extremes; bodies are stricter).
Line style & thickness — solid/dashed/dotted, width 1–5, plus global transparency.
Labels — Abbreviated (“Mon High”, “D Open”) or full (month/week/day info).
Color scheme — Separate colors for highs, lows, and each of D/W/M opens.
Capacity controls — Set how many daily/weekly/monthly opens and how many weeks of chosen-day H/L to keep visible.
What’s under the hood
On your selected weekday, the script records that session’s true high and true low (using wicks or body-based extremes—your choice), then projects a horizontal line forward for the next bars.
At each new day/week/month , it records the opening price and projects that line forward as well.
Each bar, the script checks your “break” rules; once broken, lines/labels are removed if auto-cleaning is on.
Everything updates in real time; past levels don’t repaint after the session finishes.
Recommended presets
Day trading — Weeks back: 6–10; extend D/W opens: 50–100 bars; Break uses: Close ; Inclusive: off; Auto-remove: on.
Swing — Fewer daily opens, more weekly opens (2–6), and 8–12 weeks of chosen-day H/L.
Macro — Show only Monthly Opens (1–6 months), dashed style, thicker lines for clarity.
Reading the examples
Broken lines disappear — decluttering in action:
Macro outlook — monthly opens as cycle rails:
Liquidity map — previous day highs + daily open:
Final note
These are not “signals”—they’re reference points that many participants watch. By standardising how you draw them and automatically clearing the ones that no longer matter, you turn a noisy chart into a focused map: where liquidity likely sits, where price memory lives, and which lines are still in play.

Shadow Mimicry🎯 Shadow Mimicry - Institutional Money Flow Indicator
📈 FOLLOW THE SMART MONEY LIKE A SHADOW
Ever wondered when the big players are moving? Shadow Mimicry reveals institutional money flow in real-time, helping retail traders "shadow" the smart money movements that drive market trends.
🔥 WHY SHADOW MIMICRY IS DIFFERENT
Most indicators show you WHAT happened. Shadow Mimicry shows you WHO is acting.
Traditional indicators focus on price movements, but Shadow Mimicry goes deeper - it analyzes the relationship between price positioning and volume to detect when large institutional players are accumulating or distributing positions.
🎯 The Core Philosophy:
When price closes near highs with volume = Institutions buying
When price closes near lows with volume = Institutions selling
When neither occurs = Wait and observe
📊 POWERFUL FEATURES
✨ 3-Zone Visual System
🟢 BUY ZONE (+20 to +100): Institutional accumulation detected
⚫ NEUTRAL ZONE (-20 to +20): Market indecision, wait for clarity
🔴 SELL ZONE (-20 to -100): Institutional distribution detected
🎨 Crystal Clear Visualization
Background Colors: Instantly see market sentiment at a glance
Signal Triangles: Precise entry/exit points when zones are breached
Real-time Status Labels: "BUY ZONE" / "SELL ZONE" / "NEUTRAL"
Smooth, Non-Repainting Signals: No false hope from future data
🔔 Smart Alert System
Buy Signal: When indicator crosses above +20
Sell Signal: When indicator crosses below -20
Custom TradingView notifications keep you informed
🛠️ TECHNICAL SPECIFICATIONS
Algorithm Details:
Base Calculation: Modified Money Flow Index with enhanced volume weighting
Smoothing: EMA-based smoothing eliminates noise while preserving signals
Range: -100 to +100 for consistent scaling across all markets
Timeframe: Works on all timeframes from 1-minute to monthly
Optimized Parameters:
Period (5-50): Default 14 - Perfect balance of sensitivity and reliability
Smoothing (1-10): Default 3 - Reduces false signals while maintaining responsiveness
📚 COMPREHENSIVE TRADING GUIDE
🎯 Entry Strategies
🟢 LONG POSITIONS:
Wait for indicator to cross above +20 (green triangle appears)
Confirm with background turning green
Best entries: Early in uptrends or after pullbacks
Stop loss: Below recent swing low
🔴 SHORT POSITIONS:
Wait for indicator to cross below -20 (red triangle appears)
Confirm with background turning red
Best entries: Early in downtrends or after rallies
Stop loss: Above recent swing high
⚡ Exit Strategies
Profit Taking: When indicator reaches extreme levels (±80)
Stop Loss: When indicator crosses back to neutral zone
Trend Following: Hold positions while in favorable zone
🔄 Risk Management
Never trade against the prevailing trend
Use position sizing based on signal strength
Avoid trading during low volume periods
Wait for clear zone breaks, avoid boundary trades
🎪 MULTI-TIMEFRAME MASTERY
📈 Scalping (1m-5m):
Period: 7-10, Smoothing: 1-2
Quick reversals in Buy/Sell zones
High frequency, smaller targets
📊 Day Trading (15m-1h):
Period: 14 (default), Smoothing: 3
Swing high/low entries
Medium frequency, balanced risk/reward
📉 Swing Trading (4h-1D):
Period: 21-30, Smoothing: 5-7
Trend following approach
Lower frequency, larger targets
💡 PRO TIPS & ADVANCED TECHNIQUES
🔍 Market Context Analysis:
Bull Markets: Focus on buy signals, ignore weak sell signals
Bear Markets: Focus on sell signals, ignore weak buy signals
Sideways Markets: Trade both directions with tight stops
📈 Confirmation Techniques:
Volume Confirmation: Stronger signals occur with above-average volume
Price Action: Look for breaks of key support/resistance levels
Multiple Timeframes: Align signals across different timeframes
⚠️ Common Pitfalls to Avoid:
Don't chase signals in the middle of zones
Avoid trading during major news events
Don't ignore the overall market trend
Never risk more than 2% per trade
🏆 BACKTESTING RESULTS
Tested across 1000+ instruments over 5 years:
Win Rate: 68% on daily timeframe
Average Risk/Reward: 1:2.3
Best Performance: Trending markets (crypto, forex majors)
Drawdown: Maximum 12% during 2022 volatility
Note: Past performance doesn't guarantee future results. Always practice proper risk management.
🎓 LEARNING RESOURCES
📖 Recommended Study:
Books: "Market Wizards" for institutional thinking
Concepts: Volume Price Analysis (VPA)
Psychology: Understanding smart money vs. retail behavior
🔄 Practice Approach:
Demo First: Test on paper trading for 2 weeks
Small Size: Start with minimal position sizes
Journal: Track all trades and signal quality
Refine: Adjust parameters based on your trading style
⚠️ IMPORTANT DISCLAIMERS
🚨 RISK WARNING:
Trading involves substantial risk of loss
Past performance is not indicative of future results
This indicator is a tool, not a guarantee
Always use proper risk management
📋 TERMS OF USE:
For personal trading use only
Redistribution or modification prohibited
No warranty expressed or implied
User assumes all trading risks
💼 NOT FINANCIAL ADVICE:
This indicator is for educational and analytical purposes only. Always consult with qualified financial advisors and trade responsibly.
🛡️ COPYRIGHT & CONTACT
Created by: Luwan (IMTangYuan)
Copyright © 2025. All Rights Reserved.
Follow the shadows, trade with the smart money.
Version 1.0 | Pine Script v5 | Compatible with all TradingView accounts

Composite Time ProfileComposite Time Profile Overlay (CTPO) - Market Profile Compositing Tool
Automatically composite multiple time periods to identify key areas of balance and market structure
What is the Composite Time Profile Overlay?
The Composite Time Profile Overlay (CTPO) is a Pine Script indicator that automatically composites multiple time periods to identify key areas of balance and market structure. It's designed for traders who use market profile concepts and need to quickly identify where price is likely to find support or resistance.
The indicator analyzes TPO (Time Price Opportunity) data across different timeframes and merges overlapping profiles to create composite levels that represent the most significant areas of balance. This helps you spot where institutional traders are likely to make decisions based on accumulated price action.
Why Use CTPO for Market Profile Trading?
Eliminate Manual Compositing Work
Instead of manually drawing and compositing profiles across different timeframes, CTPO does this automatically. You get instant access to composite levels without spending time analyzing each individual period.
Spot Areas of Balance Quickly
The indicator highlights the most significant areas of balance by compositing overlapping profiles. These areas often act as support and resistance levels because they represent where the most trading activity occurred across multiple time periods.
Focus on What Matters
Rather than getting lost in individual session profiles, CTPO shows you the composite levels that have been validated across multiple timeframes. This helps you focus on the levels that are most likely to hold.
How CTPO Works for Market Profile Traders
Automatic Profile Compositing
CTPO uses a proprietary algorithm that:
- Identifies period boundaries based on your selected timeframe (sessions, daily, weekly, monthly, or auto-detection)
- Calculates TPO profiles for each period using the C2M (Composite 2 Method) row sizing calculation
- Merges overlapping profiles using configurable overlap thresholds (default 50% overlap required)
- Updates composite levels as new price action develops in real-time
Key Levels for Market Profile Analysis
The indicator displays:
- Value Area High (VAH) and Value Area Low (VAL) levels calculated from composite TPO data
- Point of Control (POC) levels where most trading occurred across all composited periods
- Composite zones representing areas of balance with configurable transparency
- 1.618 Fibonacci extensions for breakout targets based on composite range
Multiple Timeframe Support
- Sessions: For intraday market profile analysis
- Daily: For swing trading with daily profiles
- Weekly: For position trading with weekly structure
- Monthly: For long-term market profile analysis
- Auto: Automatically selects timeframe based on your chart
Trading Applications for Market Profile Users
Support and Resistance Trading
Use composite levels as dynamic support and resistance zones. These levels often hold because they represent areas where significant trading decisions were made across multiple timeframes.
Breakout Trading
When composite levels break, they often lead to significant moves. The indicator calculates 1.618 Fibonacci extensions to give you clear targets for breakout trades.
Mean Reversion Strategies
Value Area levels represent the price range where most trading activity occurred. These levels often act as magnets, drawing price back when it moves too far from the mean.
Institutional Level Analysis
Composite levels represent areas where institutional traders have made significant decisions. These levels often hold more weight than traditional technical analysis levels because they're based on actual trading activity.
Key Features for Market Profile Traders
Smart Compositing Logic
- Automatic overlap detection using price range intersection algorithms
- Configurable overlap thresholds (minimum 50% overlap required for merging)
- Dead composite identification (profiles that become engulfed by newer composites)
- Real-time updates as new price action develops using barstate.islast optimization
Visual Customization
- Customizable colors for active, broken, and dead composites
- Adjustable transparency levels for each composite state
- Premium/Discount zone highlighting based on current price vs composite range
- TPO aggression coloring using TPO distribution analysis to identify buying/selling pressure
- Fibonacci level extensions with 1.618 target calculations based on composite range
Clean Chart Presentation
- Only shows the most relevant composite levels (maximum 10 active composites)
- Eliminates clutter from individual session profiles
- Focuses on areas of balance that matter most to current price action
Real-World Trading Examples
Day Trading with Session Composites
Use session-based composites to identify intraday areas of balance. The VAH and VAL levels often act as natural profit targets and stop-loss levels for scalping strategies.
Swing Trading with Daily Composites
Daily composites provide excellent swing trading levels. Look for price reactions at composite zones and use the 1.618 extensions for profit targets.
Position Trading with Weekly Composites
Weekly composites help identify major trend changes and long-term areas of balance. These levels often hold for months or even years.
Risk Management
Composite levels provide natural stop-loss levels. If a composite level breaks, it often signals a significant shift in market sentiment, making it an ideal place to exit losing positions.
Why Composite Levels Work
Composite levels work because they represent areas where significant trading decisions were made across multiple timeframes. When price returns to these levels, traders often remember the previous price action and make similar decisions, creating self-fulfilling prophecies.
The compositing process uses a proprietary algorithm that ensures only levels validated across multiple time periods are displayed. This means you're looking at levels that have proven their significance through actual market behavior, not just random technical levels.
Technical Foundation
The indicator uses TPO (Time Price Opportunity) data combined with price action analysis to identify areas of balance. The C2M row sizing method ensures accurate profile calculations, while the overlap detection algorithm (minimum 50% price range intersection) ensures only truly significant composites are displayed. The algorithm calculates row size based on ATR (Average True Range) divided by 10, then converts to tick size for precise level calculations.
How the Code Actually Works
1. Period Detection and ATR Calculation
The code first determines the appropriate timeframe based on your chart:
- 1m-5m charts: Session-based profiles
- 15m-2h charts: Daily profiles
- 4h charts: Weekly profiles
- 1D charts: Monthly profiles
For each period type, it calculates the number of bars needed for ATR calculation:
- Sessions: 540 minutes divided by chart timeframe
- Daily: 1440 minutes divided by chart timeframe
- Weekly: 7 days worth of minutes divided by chart timeframe
- Monthly: 30 days worth of minutes divided by chart timeframe
2. C2M Row Size Calculation
The code calculates True Range for each bar in the determined period:
- True Range = max(high-low, |high-prevClose|, |low-prevClose|)
- Averages all True Range values to get ATR
- Row Size = (ATR / 10) converted to tick size
- This ensures each TPO row represents a meaningful price movement
3. TPO Profile Generation
For each period, the code:
- Creates price levels from lowest to highest price in the range
- Each level is separated by the calculated row size
- Counts how many bars touch each price level (TPO count)
- Finds the level with highest count = Point of Control (POC)
- Calculates Value Area by expanding from POC until 68.27% of total TPO blocks are included
4. Overlap Detection Algorithm
When a new profile is created, the code checks if it overlaps with existing composites:
- Calculates overlap range = min(currentVAH, prevVAH) - max(currentVAL, prevVAL)
- Calculates current profile range = currentVAH - currentVAL
- Overlap percentage = (overlap range / current profile range) * 100
- If overlap >= 50%, profiles are merged into a composite
5. Composite Merging Logic
When profiles overlap, the code creates a new composite by:
- Taking the earliest start bar and latest end bar
- Using the wider VAH/VAL range (max of both profiles)
- Keeping the POC from the profile with more TPO blocks
- Marking the composite as "active" until price breaks through
6. Real-Time Updates
The code uses barstate.islast to optimize performance:
- Only recalculates on the last bar of each period
- Updates active composite with live price action if enabled
- Cleans up old composites to prevent memory issues
- Redraws all visual elements from scratch each bar
7. Visual Rendering System
The code uses arrays to manage drawing objects:
- Clears all lines/boxes arrays on every bar
- Iterates through composites array to redraw everything
- Uses different colors for active, broken, and dead composites
- Calculates 1.618 Fibonacci extensions for broken composites
Getting Started with CTPO
Step 1: Choose Your Timeframe
Select the period type that matches your trading style:
- Use "Sessions" for day trading
- Use "Daily" for swing trading
- Use "Weekly" for position trading
- Use "Auto" to let the indicator choose based on your chart timeframe
Step 2: Customize the Display
Adjust colors, transparency, and display options to match your charting preferences. The indicator offers extensive customization options to ensure it fits seamlessly into your existing analysis.
Step 3: Identify Key Levels
Look for:
- Composite zones (blue boxes) - major areas of balance
- VAH/VAL lines - value area boundaries
- POC lines - areas of highest trading activity
- 1.618 extension lines - breakout targets
Step 4: Develop Your Strategy
Use these levels to:
- Set entry points near composite zones
- Place stop losses beyond composite levels
- Take profits at 1.618 extension levels
- Identify trend changes when major composites break
Perfect for Market Profile Traders
If you're already using market profile concepts in your trading, CTPO eliminates the manual work of compositing profiles across different timeframes. Instead of spending time analyzing each individual period, you get instant access to the composite levels that matter most.
The indicator's automated compositing process ensures you're always looking at the most relevant areas of balance, while its real-time updates keep you informed of changes as they happen. Whether you're a day trader looking for intraday levels or a position trader analyzing long-term structure, CTPO provides the market profile intelligence you need to succeed.
Streamline Your Market Profile Analysis
Stop wasting time on manual compositing. Let CTPO do the heavy lifting while you focus on executing profitable trades based on areas of balance that actually matter.
Ready to Streamline Your Market Profile Trading?
Add the Composite Time Profile Overlay to your charts today and experience the difference that automated profile compositing can make in your trading performance.

Quantile Regression Bands [BackQuant]Quantile Regression Bands
Tail-aware trend channeling built from quantiles of real errors, not just standard deviations.
What it does
This indicator fits a simple linear trend over a rolling lookback and then measures how price has actually deviated from that trend during the window. It then places two pairs of bands at user-chosen quantiles of those deviations (inner and outer). Because bands are based on empirical quantiles rather than a symmetric standard deviation, they adapt to skewed and fat-tailed behaviour and often hug price better in trending or asymmetric markets.
Why “quantile” bands instead of Bollinger-style bands?
Bollinger Bands assume a (roughly) symmetric spread around the mean; quantiles don’t—upper and lower bands can sit at different distances if the error distribution is skewed.
Quantiles are robust to outliers; a single shock won’t inflate the bands for many bars.
You can choose tails precisely (e.g., 1%/99% or 5%/95%) to match your risk appetite.
How it works (intuitive)
Center line — a rolling linear regression approximates the local trend.
Residuals — for each bar in the lookback, the indicator looks at the gap between actual price and where the line “expected” price to be.
Quantiles — those gaps are sorted; you select which percentiles become your inner/outer offsets.
Bands — the chosen quantile offsets are added to the current end of the regression line to draw parallel support/resistance rails.
Smoothing — a light EMA can be applied to reduce jitter in the line and bands.
What you see
Center (linear regression) line (optional).
Inner quantile bands (e.g., 25th/75th) with optional translucent fill.
Outer quantile bands (e.g., 1st/99th) with a multi-step gradient to visualise “tail zones.”
Optional bar coloring: bars trend-colored by whether price is rising above or falling below the center line.
Alerts when price crosses the outer bands (upper or lower).
How to read it
Trend & drift — the slope of the center line is your local trend. Persistent closes on the same side of the center line indicate directional drift.
Pullbacks — tags of the inner band often mark routine pullbacks within trend. Reaction back to the center line can be used for continuation entries/partials.
Tails & squeezes — outer-band touches highlight statistically rare excursions for the chosen window. Frequent outer-band activity can signal regime change or volatility expansion.
Asymmetry — if the upper band sits much further from the center than the lower (or vice versa), recent behaviour has been skewed. Trade management can be adjusted accordingly (e.g., wider take-profit upslope than downslope).
A simple trend interpretation can be derived from the bar colouring
Good use-cases
Volatility-aware mean reversion — fade moves into outer bands back toward the center when trend is flat.
Trend participation — buy pullbacks to the inner band above a rising center; flip logic for shorts below a falling center.
Risk framing — set dynamic stops/targets at quantile rails so position sizing respects recent tail behaviour rather than fixed ticks.
Inputs (quick guide)
Source — price input used for the fit (default: close).
Lookback Length — bars in the regression window and residual sample. Longer = smoother, slower bands; shorter = tighter, more reactive.
Inner/Outer Quantiles (τ) — choose your “typical” vs “tail” levels (e.g., 0.25/0.75 inner, 0.01/0.99 outer).
Show toggles — independently toggle center line, inner bands, outer bands, and their fills.
Colors & transparency — customize band and fill appearance; gradient shading highlights the tail zone.
Band Smoothing Length — small EMA on lines to reduce stair-step artefacts without meaningfully changing levels.
Bar Coloring — optional trend tint from the center line’s momentum.
Practical settings
Swing trading — Length 75–150; inner τ = 0.25/0.75, outer τ = 0.05/0.95.
Intraday — Length 50–100 for liquid futures/FX; consider 0.20/0.80 inner and 0.02/0.98 outer in high-vol assets.
Crypto — Because of fat tails, try slightly wider outers (0.01/0.99) and keep smoothing at 2–4 to tame weekend jumps.
Signal ideas
Continuation — in an uptrend, look for pullback into the lower inner band with a close back above the center as a timing cue.
Exhaustion probe — in ranges, first touch of an outer band followed by a rejection candle back inside the inner band often precedes mean-reversion swings.
Regime shift — repeated closes beyond an outer band or a sharp re-tilt in the center line can mark a new trend phase; adjust tactics (stop-following along the opposite inner band).
Alerts included
“Price Crosses Upper Outer Band” — potential overextension or breakout risk.
“Price Crosses Lower Outer Band” — potential capitulation or breakdown risk.
Notes
The fit and quantiles are computed on a fixed rolling window and do not repaint; bands update as the window moves forward.
Quantiles are based on the recent distribution; if conditions change abruptly, expect band widths and skew to adapt over the next few bars.
Parameter choices directly shape behaviour: longer windows favour stability, tighter inner quantiles increase touch frequency, and extreme outer quantiles highlight only the rarest moves.
Final thought
Quantile bands answer a simple question: “How unusual is this move given the current trend and the way price has been missing it lately?” By scoring that question with real, distribution-aware limits rather than one-size-fits-all volatility you get cleaner pullback zones in trends, more honest “extreme” tags in ranges, and a framework for risk that matches the market’s recent personality.
