Momentum Probability Oscillator [SS]This is the momentum based probability indicator.
What it does?
This takes the average of MFI, Stochastics and RSI and plots it out as an independent oscillator.
It then tracks bullish vs bearish instances. Bullish is defined as a greater move from open to high than open to low and inverse for bearish.
It stores this data and these averages and plots these levels as a graph.
The graph depicts the max bullish values at the top, the min bearish values at the bottom and the averages in between:
It will plot the average "threshold" value in yellow:
The threshold value is key. A ticker trading above the threshold is generally bullish. Below is bearish.
The threshold value frequently acts as support and resistance levels (see below):
Resistance:
Support:
The indicator also shows you the amount of time a ticker has spent in each region, over a defined lookback period (defaulted to 500):
When you see that cumulatively, more time has been spent in a bullish range or a bearish range, it can help you ascertain the prevailing sentiment at that time.
The indicator will also calculate the average price range based on the underlying oscillator value. It does this through use of ATR based techniques, as its not usually possible to calculate a price from an oscillator:
This is intended as a general reference and not a precise target, as it is using ATR as opposed to the actual technical value itself.
As this is an oscillator, you can use it to look for divergences as well. The advantage to having it formulated in this way is:
a) You get the power of all 3 indicators (stochastics, MFI and RSI) in one and
b) You are adding context to the underlying technical reading. The indicator is plotting out the average, max and min ranges for the selected ticker and performing assessments based on these ranges that add context to the current PA.
You also have the ability to see the specific technical levels associated with each specific technical indicator. If you open up the settings menu and select "Show Table", this will appear:
This will show you the exact values of each of the technicals the indicator is using in its range assessment.
And that is basically the bulk of the indicator!
I use this predominately on the smaller timeframes, especially when there is a lot of chop, to ascertain the overall sentiment.
I also will reference it on the 1 hour to see what the prevailing sentiment is and whether the stock is at an area of technical resistance or support. For example, here is what I referenced on SPY today:
QUICK NOTE:
It works best with RTH (regular trading hours) turned on and ETH (extended trading hours) turned off!
That's it!
Hopefully you like it and leave your comments and suggestions below!
Cari skrip untuk "oscillator"

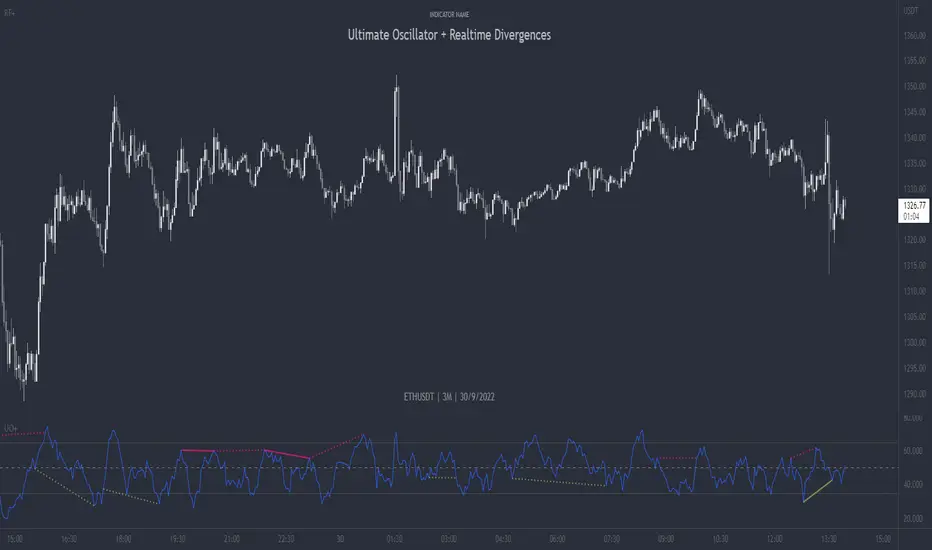
Ultimate Oscillator + Realtime DivergencesUltimate Oscillator (UO) + Realtime Divergences + Alerts + Lookback periods.
This version of the Ultimate Oscillator adds the following 5 additional features to the stock UO by Tradingview:
- Optional divergence lines drawn directly onto the oscillator in realtime
- Configurable alerts to notify you when divergences occur, as well as centerline crossovers.
- Configurable lookback periods to fine tune the divergences drawn in order to suit different trading styles and timeframes.
- Background colouring option to indicate when the UO has crossed the centerline, or optionally when both the UO and an external oscillator, which can be linked via the settings, have both crossed their centerlines.
- Alternate timeframe feature allows you to configure the oscillator to use data from a different timeframe than the chart it is loaded on.
This indicator adds additional features onto the stock Ultimate Oscillator by Tradingview, whose core calculations remain unchanged. Namely the configurable option to automatically and clearly draw divergence lines onto the oscillator for you as they occur in realtime. It also has the addition of unique alerts, so you can be notified as divergences occur without spending all day watching the charts. Furthermore, this version of the Ultimate Oscillator comes with configurable lookback periods, which can be configured in order to adjust the length of the divergences, in order to suit shorter or higher timeframe trading approaches.
The Ultimate Oscillator
Tradingview describes the Ultimate Oscillator as follows:
“The Ultimate Oscillator indicator (UO) indicator is a technical analysis tool used to measure momentum across three varying timeframes. The problem with many momentum oscillators is that after a rapid advance or decline in price, they can form false divergence trading signals. For example, after a rapid rise in price, a bearish divergence signal may present itself, however price continues to rise. The ultimate Oscillator attempts to correct this by using multiple timeframes in its calculation as opposed to just one timeframe which is what is used in most other momentum oscillators.”
More information on the history, use cases and calculations of the Ultimate Oscillator can be found here: www.tradingview.com
What are divergences?
Divergence is when the price of an asset is moving in the opposite direction of a technical indicator, such as an oscillator, or is moving contrary to other data. Divergence warns that the current price trend may be weakening, and in some cases may lead to the price changing direction.
There are 4 main types of divergence, which are split into 2 categories;
regular divergences and hidden divergences. Regular divergences indicate possible trend reversals, and hidden divergences indicate possible trend continuation.
Regular bullish divergence: An indication of a potential trend reversal, from the current downtrend, to an uptrend.
Regular bearish divergence: An indication of a potential trend reversal, from the current uptrend, to a downtrend.
Hidden bullish divergence: An indication of a potential uptrend continuation.
Hidden bearish divergence: An indication of a potential downtrend continuation.
Setting alerts.
With this indicator you can set alerts to notify you when any/all of the above types of divergences occur, on any chart timeframe you choose.
Configurable lookback values.
You can adjust the default lookback values to suit your prefered trading style and timeframe. If you like to trade a shorter time frame, lowering the default lookback values will make the divergences drawn more sensitive to short term price action.
How do traders use divergences in their trading?
A divergence is considered a leading indicator in technical analysis , meaning it has the ability to indicate a potential price move in the short term future.
Hidden bullish and hidden bearish divergences, which indicate a potential continuation of the current trend are sometimes considered a good place for traders to begin, since trend continuation occurs more frequently than reversals, or trend changes.
When trading regular bullish divergences and regular bearish divergences, which are indications of a trend reversal, the probability of it doing so may increase when these occur at a strong support or resistance level . A common mistake new traders make is to get into a regular divergence trade too early, assuming it will immediately reverse, but these can continue to form for some time before the trend eventually changes, by using forms of support or resistance as an added confluence, such as when price reaches a moving average, the success rate when trading these patterns may increase.
Typically, traders will manually draw lines across the swing highs and swing lows of both the price chart and the oscillator to see whether they appear to present a divergence, this indicator will draw them for you, quickly and clearly, and can notify you when they occur.
Disclaimer: This script includes code from the stock UO by Tradingview as well as the Divergence for Many Indicators v4 by LonesomeTheBlue.
Super Momentum OscillatorA new momentum oscillator. I uploaded this previously but it got deleted I believe because apparently my chart was too cluttered.
Hopefully this is good enough... made some updates as well since then.
What you have is six (!) momentum oscillators that can be weighed together however you please. They are centered on 0 with a fill so its also easy to overlay them (as shown).
Since momentum oscillators vary heavily chart to chart, in terms of resolution, I added that as an option so you can keep the hlines as they are.
Can be useful for spotting higher time frame moves on lower time frames without any of the repaint or needing 6 chart screens. Also a solid improvement over the indicators where people just throw a dozen different length plots together and you have no idea where to look in the end. IMO, at least.
Mix and match high and low lengths however you please.
Also it looks wicked with rasta colors. SMOke (super momentum oscillator kills everything)... your way into financial freedom, mon!

Kaufman Adaptive Correlation OscillatorIntroduction
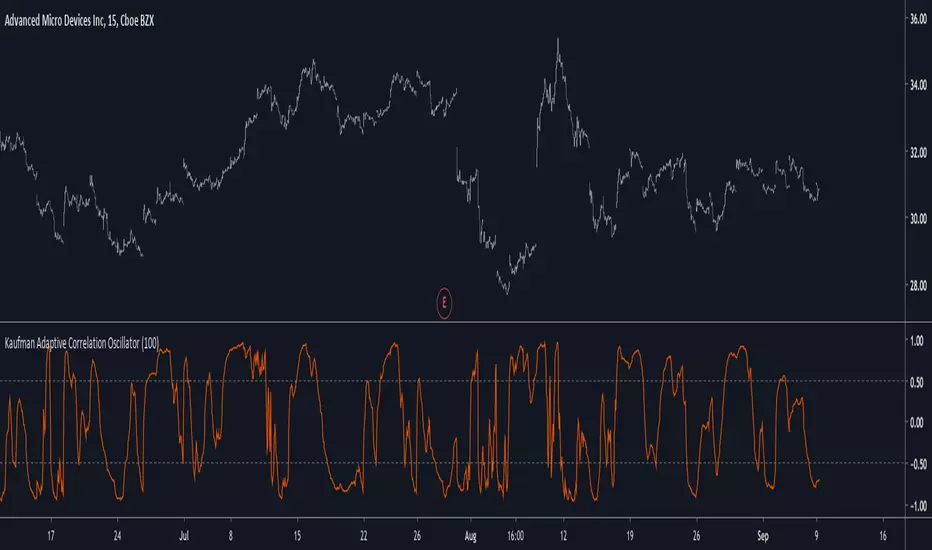
The correlation oscillator is a technical indicator that measure the linear relationship between the market closing price and a simple increasing line, the indicator is in a (-1,1) range and rise when price is up-trending and fall when price is down-trending. Another characteristic of the indicator is its inherent smoothing which provide a noise free (to some extent) oscillator.
Such indicator use simple moving averages as well as estimates of the standard deviation for its calculation, but we can easily make it adaptive, this is why i propose this new technical indicator that create an adaptive correlation oscillator based on the Kaufman adaptive moving average.
The Indicator
The length parameter control the period window of the moving average, larger periods return smoother results while having a low kurtosis, which mean that values will remain around 1 or -1 a longer period of time. Pre-filtering apply a Kaufman adaptive moving average to the input, which allow for a smoother output.
No pre-filtering in orange, pre-filtering in yellow, period = 100 for both oscillators.
If you are not aware of the Kaufman adaptive moving average, such moving average return more reactive results when price is trending and smoother results when price is ranging, this also apply for the proposed indicator.
Conclusion
Classical correlation coefficients could use this approach, therefore the linear relationships between any variables could be measured. The fact that the indicator is adaptive add a certain potential, however such combination make the indicator have the drawback of kama + the correlation oscillator, which might appear at certain points.
Thanks for reading !
Wavelet & Fourier Smoothed Volume zone oscillator (W&)FSVZO Indicator id:
USER;e7a774913c1242c3b1354334a8ea0f3c
(only relevant to those that use API requests)
MEANINGFUL DESCRIPTION:
The Volume Zone oscillator breaks up volume activity into positive and negative categories. It is positive when the current closing price is greater than the prior closing price and negative when it's lower than the prior closing price. The resulting curve plots through relative percentage levels that yield a series of buy and sell signals, depending on level and indicator direction.
The Wavelet & Fourier Smoothed Volume Zone Oscillator (W&)FSVZO is a refined version of the Volume Zone Oscillator, enhanced by the implementation of the Discrete Fourier Transform. Its primary function is to streamline price data and diminish market noise, thus offering a clearer and more precise reflection of price trends.
By combining the Wavalet and Fourier aproximation with Ehler's white noise histogram, users gain a comprehensive perspective on volume-related market conditions.
HOW TO USE THE INDICATOR:
The default period is 2 but can be adjusted after backtesting. (I suggest 5 VZO length and NoiceR max length 8 as-well)
The VZO points to a positive trend when it is rising above the 0% level, and a negative trend when it is falling below the 0% level. 0% level can be adjusted in setting by adjusting VzoDifference. Oscillations rising below 0% level or falling above 0% level result in natural trend.
ORIGINALITY & USFULLNESS:
Personal combination of Fourier and Wavalet aproximation of a price which results in less noise Volume Zone Oscillator.
The Wavelet Transform is a powerful mathematical tool for signal analysis, particularly effective in analyzing signals with varying frequency or non-stationary characteristics. It dissects a signal into wavelets, small waves with varying frequency and limited duration, providing a multi-resolution analysis. This approach captures both frequency and location information, making it especially useful for detecting changes or anomalies in complex signals.
The Discrete Fourier Transform (DFT) is a mathematical technique that transforms discrete data from the time domain into its corresponding representation in the frequency domain. This process involves breaking down a signal into its individual frequency components, thereby exposing the amplitude and phase characteristics inherent in each frequency element.
This indicator utilizes the concept of Ehler's Universal Oscillator and displays a histogram, offering critical insights into the prevailing levels of market noise. The Ehler's Universal Oscillator is grounded in a statistical model that captures the erratic and unpredictable nature of market movements. Through the application of this principle, the histogram aids traders in pinpointing times when market volatility is either rising or subsiding.
DETAILED DESCRIPTION:
My detailed description of the indicator and use cases which I find very valuable.
What is oscillator?
Oscillators are chart indicators that can assist a trader in determining overbought or oversold conditions in ranging (non-trending) markets.
What is volume zone oscillator?
Price Zone Oscillator measures if the most recent closing price is above or below the preceding closing price.
Volume Zone Oscillator is Volume multiplied by the 1 or -1 depending on the difference of the preceding 2 close prices and smoothed with Exponential moving Average.
What does this mean?
If the VZO is above 0 and VZO is rising. We have a bullish trend. Most likely.
If the VZO is below 0 and VZO is falling. We have a bearish trend. Most likely.
Rising means that VZO on close is higher than the previous day.
Falling means that VZO on close is lower than the previous day.
What if VZO is falling above 0 line?
It means we have a high probability of a bearish trend.
Thus the indicator returns 0 when falling above 0 (or rising bellow 0) and we combine higher and lower timeframes to gauge the trend.
In the next Image you can see that trend is positive on 4h, neutral on 12h and positive on 1D. That means trend is positive.
I am sorry, the chart is a bit messy. The idea is to use the indicator over more than 1 Timeframe.
What is approximation and smoothing?
They are mathematical concepts for making a discrete set of numbers a
continuous curved line.
Fourier and Wavelet approximation of a close price are taken from aprox library.
Key Features:
You can tailor the indicator to your preferences with adjustable parameters such as VZO length, noise reduction settings, and smoothing length.
Volume Zone Oscillator (VZO) shows market sentiment with the VZO, enhanced with Exponential Moving Average (EMA) smoothing for clearer trend identification.
Noise Reduction leverages Euler's White noise capabilities for effective noise reduction in the VZO, providing a cleaner and more accurate representation of market dynamics.
Choose between the traditional Fast Fourier Transform (FFT), the innovative Double Discrete Fourier Transform (DTF32) and Wavelet soothed Fourier soothed price series to suit your analytical needs.
Image of Wavelet transform with FAST settings, Double Fourier transform with FAST settings. Improved noice reduction with SLOW settings, and standard FSVZO with SLOW settings:
Fast setting are setting by default:
VZO length = 2
NoiceR max Length = 2
Slow settings are:
VZO length = 5 or 7
NoiceR max Length = 8
As you can see fast setting are more volatile. I suggest averaging fast setting on 4h 12h 1d 2d 3d 4d W and M Timeframe to get a clear view on market trend.
What if I want long only when VZO is rising and above 15 not 0?
You have set Setting VzoDifference to 15. That reduces the number of trend changes.
Example of W&FSVZO with VzoDifference 15 than 0:
VZO crossed 0 line but not 15 line and that's why Indicator returns 0 in one case an 1 in another.
What is Smooth length setting?
A way of calculating Bullish or Bearish FSVZO.
If smooth length is 2 the trend is rising if:
rising = VZO > ta.ema(VZO, 2)
Meaning that we check if VZO is higher that exponential average of the last 2 elements.
If smooth length is 1 the trend is rising if:
rising = VZO_ > VZO_
Rising is boolean value, meaning TRUE if rising and FALSE if falling.
Mathematical equations presented in Pinescript:
Fourier of the real (x axis) discrete:
x_0 = array.get(x, 0) + array.get(x, 1) + array.get(x, 2)
x_1 = array.get(x, 0) + array.get(x, 1) * math.cos( -2 * math.pi * _dir / 3 ) - array.get(y, 1) * math.sin( -2 * math.pi * _dir / 3 ) + array.get(x, 2) * math.cos( -4 * math.pi * _dir / 3 ) - array.get(y, 2) * math.sin( -4 * math.pi * _dir / 3 )
x_2 = array.get(x, 0) + array.get(x, 1) * math.cos( -4 * math.pi * _dir / 3 ) - array.get(y, 1) * math.sin( -4 * math.pi * _dir / 3 ) + array.get(x, 2) * math.cos( -8 * math.pi * _dir / 3 ) - array.get(y, 2) * math.sin( -8 * math.pi * _dir / 3 )
Euler's Noice reduction with both close and Discrete Furrier approximated price.
w = (dft1*src - dft1 *src ) / math.sqrt(math.pow(math.abs(src- src ),2) + math.pow(math.abs(dft1 - dft1 ),2))
filt := na(filt ) ? 0 : c1 * (w*dft1 + nz(w *dft1 )) / 2.0 /math.abs(dft1 -dft1 ) + c2 * nz(filt ) - c3 * nz(filt )
Usecase:
First option:
Select the preferred version of DFT and noise reduction settings based on your analysis requirements.
Leverage the script to identify Bullish and Bearish trends, shown with green and red triangle.
Combine Different Timeframes to accurately determine market trend.
Second option:
Pull the data with API sockets to automate your trading journey.
plot(close, title="ClosePrice", display=display.status_line)
plot(open, title="OpenPrice", display=display.status_line)
plot(greencon ? 1 : redcon ? -1 : 0, title="position", display=display.status_line)
Use ClosePrice, OpenPrice and "position" titles to easily read and backtest your strategy utilising more than 1 Time Frame.
Indicator id:
USER;e7a774913c1242c3b1354334a8ea0f3c
(only relevant to those that use API requests)

+ Klinger OscillatorThis is a version of Stephen J. Klinger's, Klinger Oscillator (sometimes called Klinger Volume Oscillator). I've changed virtually nothing about the indicator itself, but added some lookback inputs for the EMAs the oscillator is derived from (traditionally 34 and 55), and added a few other things, as is my wont.
But what is the Klinger Oscillator? Essentially, the calculation looks at the high, low, and close of the current period, and compares that to the previous period's. If it is greater, it adds volume, and if it is less, it subtracts volume. It then takes an EMA of two different lookback periods of that calculation and subtracts one from the other. That's your oscillator. There is then made a signal line of the oscillator that a trader can use, in combination with the zero line, for taking trades. Investopedia has a good article on it, so if you're looking for more specifics, check there.
What I've done is add a selection of different moving averages that you may choose for the signal line. Usually it's a 13 period EMA, and that comes default, but here you could use an ALMA or HMA, or modular filter, etc. Find something that works for your style/algorithm.
Of course there are all the usual additions of mine with the various ways of coloring the indicator and candles, adjustable Donchian Bands, and alerts. A new addition that I've just added to all my indicators (oscillators, anyway) are divergences. This is more or less just a copy and paste of the divergence indicator available in TradingView. In this case you can set it to plot divergences off either the Klinger or the signal line. Depending on which one you choose you may have to adjust pivot lookbacks, and lookback range. I've kept the settings default from the RSI TradingView version.

+ WaveTrend OscillatorI'm guessing most of you are familir with LazyBear's adaptation of the Wavetrend Oscillator; it's one of the most popular indicators on TradingView. I know others have done adaptations of it, but I thought I might as well, because that's kind of a thing I like doing.
In this version I've added a second Wavetrend plot. This is a thing I like to do. The longer plot gives you a longer timeframe momentum bias, and the shorter plot gives you entries and/or exits. Here we have one plot with a lookback period of 55, and another with the default set to 6 (change this to 14 if you think you might prefer something slower and that will plot similarly to the default RSI settings). With the traditional Wavetrend Oscillator there is a simple moving average on the WTO that is to help provide entries and exits. I've done away with this as there are already two plots, and I felt more would just clutter the indicator. Instead of plotting the SMA I've plotted the crosses along the bottom and top of the indicator. Also, as is not the case in LazyBear's version, this SMA length is adjustable. By default it is set to 3, which is the default setting on the original indicator.
I've also plotted background colors for when there is what I call a momentum shift. If one or the other oscillators crosses the centerline a colored bar is plotted. By default it is turned on for both WTOs, though in practice you might only want it on for the longer one.
I would say use of the indicator is similar to the original WTO or many other oscillators. Buying oversold and selling overbought, but being mindful of the momentum of the market. If the longer WTO is above the centerline it's best to be looking for dips to the centerline, or for an overbought signal by the faster WTO, and vice versa if the longer WTO is below the centerline. That said, you can also adjust the length of the SMA on the faster WTO to fine tune entries or exits, which is kind of how you would trade LazyBear's version. In this case you have that additional confirmation of market momentum.
You can set colored candles to either of the WTO plots via a dropdown menu.
There are alerts for overbought and oversold situations, centerline crosses, and Wavetrend crosses.
That's about it. Hope you enjoy this particular implementation of LazyBear's well known indicator.
Ah yes, last thing: Original version the source is set to hlc3. I've given you the opportunity to change that, so if you prefer using close you can, or whatever you want.

TheATR: Fisher Oscillator.Fisher Oscillator(FO).
The Fisher Oscillator is inspired by John Ehlers "Fisher Transform".
The oscillator highlights when prices have moved to an extreme, based on recent prices.
The FO may help in spotting turning points, in the short-medium trends of an asset, also, it helps in recognizing the asset's trends themselves, giving a picture of mkt conditions affected by less noise.
Fisher Oscillator Components.
Fisher V1 -> Main FO.
Fisher V2 -> Past Candle FO.
0-line threshold -> Directional Component.
How to read the Fisher Oscillator.
The FO is super easy to read by itself.. also, I coded some features which make it even easier to read.
It's suggestions, which we can call "Signals", come from 2 different sources, accessible thanks to the variable "Signals Type".
- 0-Line Crosses:
When the "Fisher V1" upcrosses the oscillator 0-line, the oscillator suggests a Long scenario.
When the "Fisher V1" downcrosses the oscillator 0-line, the oscillator suggests a Short scenario.
- Classic Lines Crosses:
When the "Fisher V1" upcrosses the "Fisher V2", the oscillator suggests a Long scenario.
When the "Fisher V1" downcrosses the "Fisher V2", the oscillator suggests a Short scenario.
Users will be able to recognise these Signals visually, thanks to some color customisation to the "Fisher V1" line, and thanks to the ability of the oscillator of plotting Signals.
TheATR Documentation regarding TheATR: Fisher Oscillator.
Researching and backtesting the FO, I noticed it's skill of being able to dynamically identify trend reversals with a nice degree of reliability.
Also, the FO's able to keep up with trends up to their tops/bottoms, as it's very responsive.
This makes the FO a trend-following oscillator in my personal view, because its nature of being very fast in detecting reversals will lead to many false reversals as well.
On the other face of this coin, if we look at the FO as a source for confirmations for a trend-following strategy, may be very useful.
To conclude, I would use the FO as a confirmation oscillator, in a trend-following strategy that needs to have other components.
Thanks for reading,
TheATR.

Oscillators Overlay w/ Divergencies/Alerts by DGTAn oscillator is a technical analysis tool that, simply said, gauge momentum, determine market trend direction and duration. For some oscillators, fluctuations are bounded by some upper and lower band, and traders use them to discover short-term overbought or oversold conditions.
Oscillators are often combined with moving average indicators to signal trend breakouts or reversals
Histogram, is the difference between the oscillator and signal lines, which oscillates above and below a center line and is used as a good indication of an asset's momentum
What to look for
- Signal Line Crossover is the most common signal produced by the oscillators
- Zero Line Crossovers have a very similar premise to Signal Line Crossovers
- Divergence , when the oscillator and actual price are not in agreement, is another signal created by the oscillators
- Overbought and Oversold , with any range-bound oscillator, conditions are a primary signal generated
Oscillators Overlay study
* Presents oscillators on top of the mian chart (price chart)
* A single indicator for many well known and custom oscillators
* Divergence detection
* Alerts for various condtions
The list of oscillators included;
- Awesome Oscillator (AO)
- Chaikin Oscillator (Chaikin Osc)
- Commodity Channel Index (CCI)
- Distance Oscillator
- Elder-Ray Bear and Bull Power
- Elliott Wave Oscillator (EWO)
- Klinger Oscillator
- Money Flow Index (MFI)
- Moving Average Convergence Divergence (MACD)
- Rate Of Change (ROC)
- Relative Strength Index (RSI)
- Stochastic (Stoch)
- Stochastic RSI (Stoch RSI)
- Volume Oscillator (Volume Osc)
- Wave Trend
In technical analysis, investors find oscillators to be important technical tools and consider them more effective when used in conjunction with other means of technical analysis
Disclaimer : Trading success is all about following your trading strategy and the indicators should fit within your trading strategy, and not to be traded upon solely
The script is for informational and educational purposes only. Use of the script does not constitutes professional and/or financial advice. You alone the sole responsibility of evaluating the script output and risks associated with the use of the script. In exchange for using the script, you agree not to hold dgtrd TradingView user liable for any possible claim for damages arising from any decision you make based on use of the script

MAs and Oscillators SummeryHello
This indicator represents the Tradingview screener three rating criteria
Moving Averages Summary: Average of the most important moving averages, except the Ichimoku cloud as it's a very old technology which is not reliable.
Oscillators Summary: Average of the major Oscillators.
Summary rating: which is average of above two indices
It has also an option to view the weekly summary rating with any time frame you are using at the same time

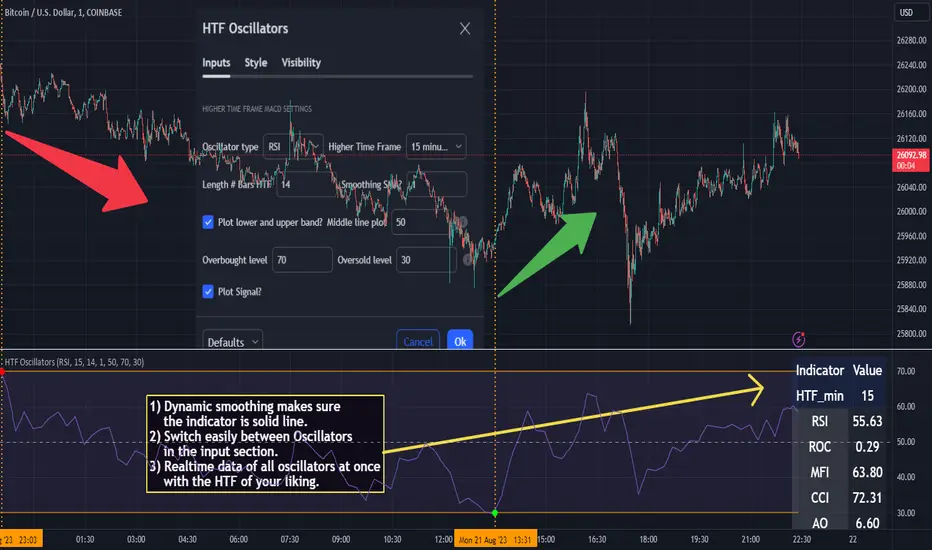
HTF Oscillators RSI/ROC/MFI/CCI/AO - Dynamic SmoothingThe Interplay of Time Frames: A Balanced View
Navigating the markets often involves interpreting trends from multiple angles. The HTF Oscillators with Dynamic Smoothing indicator enables you to do just that. This tool provides the option to integrate smoothed oscillator readings from Higher Time Frames (HTF) into lower time frame charts, such as a 1-minute chart. By doing so, the indicator offers a balanced viewpoint that bridges the gap between micro and macro perspectives, helping you make informed decisions without losing sight of the broader market context.
Features
Multi-Oscillator Support
Choose from a range of popular oscillators like the Relative Strength Index (RSI), Rate of Change (ROC), Money Flow Index (MFI), Commodity Channel Index (CCI), and Awesome Oscillator (AO). These oscillators are commonly used as foundational building blocks in trading strategy scripts by traders worldwide. Switch effortlessly between them, depending on your trading strategy and requirements. To maintain consistency and a familiar user experience, our script adopts the same visual aesthetics that you'll find in Pine Script indicators on TradingView: a sleek purple line for the oscillator and a transparent band filling. These visual elements are not only pleasing to the eye but also widely appreciated by the trading community.
Dynamic Smoothing
The unique dynamic smoothing feature calculates a smoothing factor based on the ratio of minutes between the Higher Time Frame (HTF) and your current time frame. This provides a sleek and responsive oscillator line that still holds the weight of the longer trend. One of the significant advantages of this feature is user experience; when you change your time frame, the HTF-values in your settings will remain consistent. This ensures that you can easily switch between different time frames without losing the insights provided by your selected HTF.
Visual Aids
Visual cues are an essential part of any trading strategy. The indicator not only plots signals to mark overbought and oversold conditions based on the dynamically smoothed oscillator but also provides you with the flexibility to customize your visual experience. You have the option to toggle on/off the display of these signals depending on your specific needs. Additionally, bands can be displayed at overbought and oversold levels, along with a reference middle line. If you switch between different oscillators (available in the parameter settings), remember to manually adjust the bands in the input settings to ensure signals matches with the type of oscillator to your liking.
User-Friendly Settings
We've grouped related settings together, making it easier for you to find what you're looking for. Adjust the oscillator type, length of bars, smoothing settings, and more with just a few clicks.
Information Table
A standout feature of this indicator is the real-time information table, which displays the values of all selected oscillators based on your specified Higher Time Frame (HTF) settings. This can be particularly useful for traders who depend on multiple indicators for their decision-making process. The data presented in the table is synchronized with the HTF options you've configured in the input settings, allowing for a more efficient and quick scan of values from higher time frames.
Educational Corner: The Power of the Information Table and Customization
The table incorporated into this indicator isn't just eye-candy; it's a practical tool designed to elevate your trading strategy. It dynamically displays real-time values of various oscillators for the HTF you've chosen. This is an exemplary use of TradingView's scripting capabilities to blend multiple indicators into a single visual panel, streamlining your analysis and decision-making process.
But here's the best part: You're not limited to what we've created. With some basic understanding of TradingView's scripting language, Pine Script, you can easily adapt this table to include different indicators that suit your unique trading style. The logic in the script is modular and can serve as a foundation for your own customized trading dashboard. So, go ahead, get creative and explore new combinations of indicators that will help you excel in your trading endeavors!
You no longer have to toggle between different charts or indicators to get the information you need; it's all there in one neatly organized table. We encourage you to tap into this feature and make it your own, empowering your trading like never before.
By doing so, you not only gain a more comprehensive toolset, but you also engage more deeply with your trading strategy, understanding its nuances and, ultimately, making more informed decisions.
Conclusion
The HTF Oscillators with Dynamic Smoothing is a versatile and powerful tool that brings together the best of both worlds: the perspective of higher time frames and the granularity of shorter ones. Its feature-rich setting options and real-time information table make it a potential useful addition to your trading toolkit.
Remember, while this indicator offers a comprehensive and smarter way to look at the markets, it is not a foolproof method for predicting market movements. Always use it in conjunction with other analysis methods and risk management strategies.
Any Oscillator Underlay [TTF]We are proud to release a new indicator that has been a while in the making - the Any Oscillator Underlay (AOU) !
Note: There is a lot to discuss regarding this indicator, including its intent and some of how it operates, so please be sure to read this entire description before using this indicator to help ensure you understand both the intent and some limitations with this tool.
Our intent for building this indicator was to accomplish the following:
Combine all of the oscillators that we like to use into a single indicator
Take up a bit less screen space for the underlay indicators for strategies that utilize multiple oscillators
Provide a tool for newer traders to be able to leverage multiple oscillators in a single indicator
Features:
Includes 8 separate, fully-functional indicators combined into one
Ability to easily enable/disable and configure each included indicator independently
Clearly named plots to support user customization of color and styling, as well as manual creation of alerts
Ability to customize sub-indicator title position and color
Ability to customize sub-indicator divider lines style and color
Indicators that are included in this initial release:
TSI
2x RSIs (dubbed the Twin RSI )
Stochastic RSI
Stochastic
Ultimate Oscillator
Awesome Oscillator
MACD
Outback RSI (Color-coding only)
Quick note on OB/OS:
Before we get into covering each included indicator, we first need to cover a core concept for how we're defining OB and OS levels. To help illustrate this, we will use the TSI as an example.
The TSI by default has a mid-point of 0 and a range of -100 to 100. As a result, a common practice is to place lines on the -30 and +30 levels to represent OS and OB zones, respectively. Most people tend to view these levels as distance from the edges/outer bounds or as absolute levels, but we feel a more way to frame the OB/OS concept is to instead define it as distance ("offset") from the mid-line. In keeping with the -30 and +30 levels in our example, the offset in this case would be "30".
Taking this a step further, let's say we decided we wanted an offset of 25. Since the mid-point is 0, we'd then calculate the OB level as 0 + 25 (+25), and the OS level as 0 - 25 (-25).
Now that we've covered the concept of how we approach defining OB and OS levels (based on offset/distance from the mid-line), and since we did apply some transformations, rescaling, and/or repositioning to all of the indicators noted above, we are going to discuss each component indicator to detail both how it was modified from the original to fit the stacked-indicator model, as well as the various major components that the indicator contains.
TSI:
This indicator contains the following major elements:
TSI and TSI Signal Line
Color-coded fill for the TSI/TSI Signal lines
Moving Average for the TSI
TSI Histogram
Mid-line and OB/OS lines
Default TSI fill color coding:
Green : TSI is above the signal line
Red : TSI is below the signal line
Note: The TSI traditionally has a range of -100 to +100 with a mid-point of 0 (range of 200). To fit into our stacking model, we first shrunk the range to 100 (-50 to +50 - cut it in half), then repositioned it to have a mid-point of 50. Since this is the "bottom" of our indicator-stack, no additional repositioning is necessary.
Twin RSI:
This indicator contains the following major elements:
Fast RSI (useful if you want to leverage 2x RSIs as it makes it easier to see the overlaps and crosses - can be disabled if desired)
Slow RSI (primary RSI)
Color-coded fill for the Fast/Slow RSI lines (if Fast RSI is enabled and configured)
Moving Average for the Slow RSI
Mid-line and OB/OS lines
Default Twin RSI fill color coding:
Dark Red : Fast RSI below Slow RSI and Slow RSI below Slow RSI MA
Light Red : Fast RSI below Slow RSI and Slow RSI above Slow RSI MA
Dark Green : Fast RSI above Slow RSI and Slow RSI below Slow RSI MA
Light Green : Fast RSI above Slow RSI and Slow RSI above Slow RSI MA
Note: The RSI naturally has a range of 0 to 100 with a mid-point of 50, so no rescaling or transformation is done on this indicator. The only manipulation done is to properly position it in the indicator-stack based on which other indicators are also enabled.
Stochastic and Stochastic RSI:
These indicators contain the following major elements:
Configurable lengths for the RSI (for the Stochastic RSI only), K, and D values
Configurable base price source
Mid-line and OB/OS lines
Note: The Stochastic and Stochastic RSI both have a normal range of 0 to 100 with a mid-point of 50, so no rescaling or transformations are done on either of these indicators. The only manipulation done is to properly position it in the indicator-stack based on which other indicators are also enabled.
Ultimate Oscillator (UO):
This indicator contains the following major elements:
Configurable lengths for the Fast, Middle, and Slow BP/TR components
Mid-line and OB/OS lines
Moving Average for the UO
Color-coded fill for the UO/UO MA lines (if UO MA is enabled and configured)
Default UO fill color coding:
Green : UO is above the moving average line
Red : UO is below the moving average line
Note: The UO naturally has a range of 0 to 100 with a mid-point of 50, so no rescaling or transformation is done on this indicator. The only manipulation done is to properly position it in the indicator-stack based on which other indicators are also enabled.
Awesome Oscillator (AO):
This indicator contains the following major elements:
Configurable lengths for the Fast and Slow moving averages used in the AO calculation
Configurable price source for the moving averages used in the AO calculation
Mid-line
Option to display the AO as a line or pseudo-histogram
Moving Average for the AO
Color-coded fill for the AO/AO MA lines (if AO MA is enabled and configured)
Default AO fill color coding (Note: Fill was disabled in the image above to improve clarity):
Green : AO is above the moving average line
Red : AO is below the moving average line
Note: The AO is technically has an infinite (unbound) range - -∞ to ∞ - and the effective range is bound to the underlying security price (e.g. BTC will have a wider range than SP500, and SP500 will have a wider range than EUR/USD). We employed some special techniques to rescale this indicator into our desired range of 100 (-50 to 50), and then repositioned it to have a midpoint of 50 (range of 0 to 100) to meet the constraints of our stacking model. We then do one final repositioning to place it in the correct position the indicator-stack based on which other indicators are also enabled. For more details on how we accomplished this, read our section "Binding Infinity" below.
MACD:
This indicator contains the following major elements:
Configurable lengths for the Fast and Slow moving averages used in the MACD calculation
Configurable price source for the moving averages used in the MACD calculation
Configurable length and calculation method for the MACD Signal Line calculation
Mid-line
Note: Like the AO, the MACD also technically has an infinite (unbound) range. We employed the same principles here as we did with the AO to rescale and reposition this indicator as well. For more details on how we accomplished this, read our section "Binding Infinity" below.
Outback RSI (ORSI):
This is a stripped-down version of the Outback RSI indicator (linked above) that only includes the color-coding background (suffice it to say that it was not technically feasible to attempt to rescale the other components in a way that could consistently be clearly seen on-chart). As this component is a bit of a niche/special-purpose sub-indicator, it is disabled by default, and we suggest it remain disabled unless you have some pre-defined strategy that leverages the color-coding element of the Outback RSI that you wish to use.
Binding Infinity - How We Incorporated the AO and MACD (Warning - Math Talk Ahead!)
Note: This applies only to the AO and MACD at time of original publication. If any other indicators are added in the future that also fall into the category of "binding an infinite-range oscillator", we will make that clear in the release notes when that new addition is published.
To help set the stage for this discussion, it's important to note that the broader challenge of "equalizing inputs" is nothing new. In fact, it's a key element in many of the most popular fields of data science, such as AI and Machine Learning. They need to take a diverse set of inputs with a wide variety of ranges and seemingly-random inputs (referred to as "features"), and build a mathematical or computational model in order to work. But, when the raw inputs can vary significantly from one another, there is an inherent need to do some pre-processing to those inputs so that one doesn't overwhelm another simply due to the difference in raw values between them. This is where feature scaling comes into play.
With this in mind, we implemented 2 of the most common methods of Feature Scaling - Min-Max Normalization (which we call "Normalization" in our settings), and Z-Score Normalization (which we call "Standardization" in our settings). Let's take a look at each of those methods as they have been implemented in this script.
Min-Max Normalization (Normalization)
This is one of the most common - and most basic - methods of feature scaling. The basic formula is: y = (x - min)/(max - min) - where x is the current data sample, min is the lowest value in the dataset, and max is the highest value in the dataset. In this transformation, the max would evaluate to 1, and the min would evaluate to 0, and any value in between the min and the max would evaluate somewhere between 0 and 1.
The key benefits of this method are:
It can be used to transform datasets of any range into a new dataset with a consistent and known range (0 to 1).
It has no dependency on the "shape" of the raw input dataset (i.e. does not assume the input dataset can be approximated to a normal distribution).
But there are a couple of "gotchas" with this technique...
First, it assumes the input dataset is complete, or an accurate representation of the population via random sampling. While in most situations this is a valid assumption, in trading indicators we don't really have that luxury as we're often limited in what sample data we can access (i.e. number of historical bars available).
Second, this method is highly sensitive to outliers. Since the crux of this transformation is based on the max-min to define the initial range, a single significant outlier can result in skewing the post-transformation dataset (i.e. major price movement as a reaction to a significant news event).
You can potentially mitigate those 2 "gotchas" by using a mechanism or technique to find and discard outliers (e.g. calculate the mean and standard deviation of the input dataset and discard any raw values more than 5 standard deviations from the mean), but if your most recent datapoint is an "outlier" as defined by that algorithm, processing it using the "scrubbed" dataset would result in that new datapoint being outside the intended range of 0 to 1 (e.g. if the new datapoint is greater than the "scrubbed" max, it's post-transformation value would be greater than 1). Even though this is a bit of an edge-case scenario, it is still sure to happen in live markets processing live data, so it's not an ideal solution in our opinion (which is why we chose not to attempt to discard outliers in this manner).
Z-Score Normalization (Standardization)
This method of rescaling is a bit more complex than the Min-Max Normalization method noted above, but it is also a widely used process. The basic formula is: y = (x – μ) / σ - where x is the current data sample, μ is the mean (average) of the input dataset, and σ is the standard deviation of the input dataset. While this transformation still results in a technically-infinite possible range, the output of this transformation has a 2 very significant properties - the mean (average) of the output dataset has a mean (μ) of 0 and a standard deviation (σ) of 1.
The key benefits of this method are:
As it's based on normalizing the mean and standard deviation of the input dataset instead of a linear range conversion, it is far less susceptible to outliers significantly affecting the result (and in fact has the effect of "squishing" outliers).
It can be used to accurately transform disparate sets of data into a similar range regardless of the original dataset's raw/actual range.
But there are a couple of "gotchas" with this technique as well...
First, it still technically does not do any form of range-binding, so it is still technically unbounded (range -∞ to ∞ with a mid-point of 0).
Second, it implicitly assumes that the raw input dataset to be transformed is normally distributed, which won't always be the case in financial markets.
The first "gotcha" is a bit of an annoyance, but isn't a huge issue as we can apply principles of normal distribution to conceptually limit the range by defining a fixed number of standard deviations from the mean. While this doesn't totally solve the "infinite range" problem (a strong enough sudden move can still break out of our "conceptual range" boundaries), the amount of movement needed to achieve that kind of impact will generally be pretty rare.
The bigger challenge is how to deal with the assumption of the input dataset being normally distributed. While most financial markets (and indicators) do tend towards a normal distribution, they are almost never going to match that distribution exactly. So let's dig a bit deeper into distributions are defined and how things like trending markets can affect them.
Skew (skewness): This is a measure of asymmetry of the bell curve, or put another way, how and in what way the bell curve is disfigured when comparing the 2 halves. The easiest way to visualize this is to draw an imaginary vertical line through the apex of the bell curve, then fold the curve in half along that line. If both halves are exactly the same, the skew is 0 (no skew/perfectly symmetrical) - which is what a normal distribution has (skew = 0). Most financial markets tend to have short, medium, and long-term trends, and these trends will cause the distribution curve to skew in one direction or another. Bullish markets tend to skew to the right (positive), and bearish markets to the left (negative).
Kurtosis: This is a measure of the "tail size" of the bell curve. Another way to state this could be how "flat" or "steep" the bell-shape is. If the bell is steep with a strong drop from the apex (like a steep cliff), it has low kurtosis. If the bell has a shallow, more sweeping drop from the apex (like a tall hill), is has high kurtosis. Translating this to financial markets, kurtosis is generally a metric of volatility as the bell shape is largely defined by the strength and frequency of outliers. This is effectively a measure of volatility - volatile markets tend to have a high level of kurtosis (>3), and stable/consolidating markets tend to have a low level of kurtosis (<3). A normal distribution (our reference), has a kurtosis value of 3.
So to try and bring all that back together, here's a quick recap of the Standardization rescaling method:
The Standardization method has an assumption of a normal distribution of input data by using the mean (average) and standard deviation to handle the transformation
Most financial markets do NOT have a normal distribution (as discussed above), and will have varying degrees of skew and kurtosis
Q: Why are we still favoring the Standardization method over the Normalization method, and how are we accounting for the innate skew and/or kurtosis inherent in most financial markets?
A: Well, since we're only trying to rescale oscillators that by-definition have a midpoint of 0, kurtosis isn't a major concern beyond the affect it has on the post-transformation scaling (specifically, the number of standard deviations from the mean we need to include in our "artificially-bound" range definition).
Q: So that answers the question about kurtosis, but what about skew?
A: So - for skew, the answer is in the formula - specifically the mean (average) element. The standard mean calculation assumes a complete dataset and therefore uses a standard (i.e. simple) average, but we're limited by the data history available to us. So we adapted the transformation formula to leverage a moving average that included a weighting element to it so that it favored recent datapoints more heavily than older ones. By making the average component more adaptive, we gained the effect of reducing the skew element by having the average itself be more responsive to recent movements, which significantly reduces the effect historical outliers have on the dataset as a whole. While this is certainly not a perfect solution, we've found that it serves the purpose of rescaling the MACD and AO to a far more well-defined range while still preserving the oscillator behavior and mid-line exceptionally well.
The most difficult parts to compensate for are periods where markets have low volatility for an extended period of time - to the point where the oscillators are hovering around the 0/midline (in the case of the AO), or when the oscillator and signal lines converge and remain close to each other (in the case of the MACD). It's during these periods where even our best attempt at ensuring accurate mirrored-behavior when compared to the original can still occasionally lead or lag by a candle.
Note: If this is a make-or-break situation for you or your strategy, then we recommend you do not use any of the included indicators that leverage this kind of bounding technique (the AO and MACD at time of publication) and instead use the Trandingview built-in versions!
We know this is a lot to read and digest, so please take your time and feel free to ask questions - we will do our best to answer! And as always, constructive feedback is always welcome!

MTF Oscillator Framework [PineCoders]This framework allows Pine coders to quickly build a complete multi-timeframe oscillator from any calculation producing values around a centerline, whether the values are bounded or not. Insert your calculation in the script and you have a ready-to-publish MTF Oscillator offering a plethora of presentation options and features.
█ HOW TO USE THE FRAMEWORK
1 — Insert your calculation in the `f_signal()` function at the top of the "Helper Functions" section of the script.
2 — Change the script's name in the `study()` declaration statement and the `alertcondition()` text in the last part of the "Plots" section.
3 — Adapt the default value used to initialize the CENTERLINE constant in the script's "Constants" section.
4 — If you want to publish the script, copy/paste the following description in your new publication's description and replace the "OVERVIEW" section with a description of your calculations.
5 — Voilà!
═════════════════════════════════════════════════════════════════════════
█ OVERVIEW
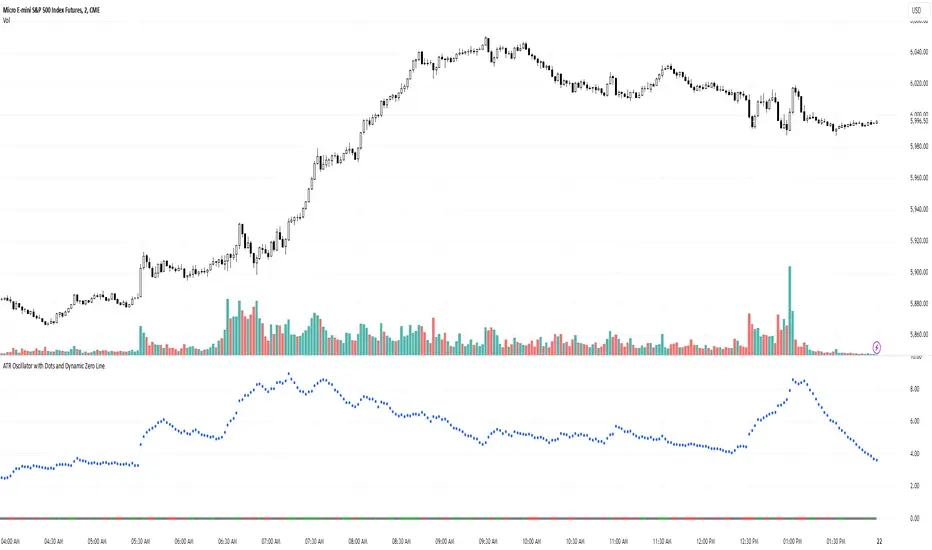
This oscillator calculates a directional value of True Range. When a bar is up, the positive value of True Range is used. A negative value is used when the bar is down. When there is no movement during the bar, a zero value is generated, even if True Range is different than zero. Because the unit of measure of True Range is price, the oscillator is unbounded (it does not have fixed upper/lower bounds).
True Range can be used as a metric for volatility, but by using a signed value, this oscillator will show the directional bias of progressively increasing/decreasing volatility, which can make it more useful than an always positive value of True Range.
The True Range calculation appeared for the first time in J. Welles Wilder's New Concepts in Technical Trading Systems book published in 1978. Wilder's objective was to provide a reliable measure of the effective movement—or range—between two bars, to measure volatility. True Range is also the building block used to calculate ATR (Average True Range), which calculates the average of True Range values over a given period using the `rma` averaging method—the same used in the calculation of another of Wilder's remarkable creations: RSI.
█ CONCEPTS
This oscillator's design stems from a few key concepts.
Relative Levels
Other than the centerline, relative rather than absolute levels are used to identify levels of interest. Accordingly, no fixed levels correspond to overbought/oversold conditions. Relative levels of interest are identified using:
• A Donchian channel (historical highs/lows).
• The oscillator's position relative to higher timeframe values.
• Oscillator levels following points in time where a divergence is identified.
Higher timeframes
Two progressively higher timeframes are used to calculate larger-context values for the oscillator. The rationale underlying the use of timeframes higher than the chart's is that, while they change less frequently than the values calculated at the chart's resolution, they are more meaningful because more work (trader activity) is required to calculate them. Combining the immediacy of values calculated at the chart's resolution to higher timeframe values achieves a compromise between responsiveness and reliability.
Divergences as points of interest rather than directional clues
A very simple interpretation of what constitutes a divergence is used. A divergence is defined as a discrepancy between any bar's direction and the direction of the signal line on that same bar. No attempt is made to attribute a directional bias to divergences when they occur. Instead, the oscillator's level is saved and subsequent movement of the oscillator relative to the saved level is what determines the bullish/bearish state of the oscillator.
Conservative coloring scheme
Several additive coloring conditions allow the bull/bear coloring of the oscillator's main line to be restricted to specific areas meeting all the selected conditions. The concept is built on the premise that most of the time, an oscillator's value should be viewed as mere noise, and that somewhat like price, it only occasionally conveys actionable information.
█ FEATURES
Plots
• Three lines can be plotted. They are named Main line , Line 2 and Line 3 . You decide which calculation to use for each line:
• The oscillator's value at the chart's resolution.
• The oscillator's value at a medium timeframe higher than the chart's resolution.
• The oscillator's value at the highest timeframe.
• An aggregate line calculated using a weighed average of the three previous lines (see the Aggregate Weights section of Inputs to configure the weights).
• The coloring conditions, divergence levels and the Hi/Lo channel always apply to the Main line, whichever calculation you decide to use for it.
• The color of lines 2 and 3 are fixed but can be set in the "Colors" section of Inputs.
• You can change the thickness of each line.
• When the aggregate line is displayed, higher timeframe values are only used in its calculation when they become available in the chart's history,
otherwise the aggregate line would appear much later on the chart. To indicate when each higher timeframe value becomes available,
a small label appears near the centerline.
• Divergences can be shown as small dots on the centerline.
• Divergence levels can be shown. The level and fill are determined by the oscillator's position relative to the last saved divergence level.
• Bull/bear markers can be displayed. They occur whenever a new bull/bear state is determined by the "Main Line Coloring Conditions".
• The Hi/Lo (Donchian) channel can be displayed, and its period defined.
• The background can display the state of any one of 11 different conditions.
• The resolutions used for the higher timeframes can be displayed to the right of the last bar's value.
• Four key values are always displayed in the Data Window (fourth icon down to the right of your chart):
oscillator values for the chart, medium and highest timeframes, and the oscillator's instant value before it is averaged.
Main Line Coloring Conditions
• Nine different conditions can be selected to determine the bull/bear coloring of the main line. All conditions set to "ON" must be met to determine the bull/bear state.
• A volatility state can also be used to filter the conditions.
• When the coloring conditions and the filter do not allow for a bull/bear state to be determined, the neutral color is used.
Signal
• Seven different averages can be used to calculate the average of the oscillator's value.
• The average's period can be set. A period of one will show the instant value of the oscillator,
provided you don't use linear regression or the Hull MA as they do not work with a period of one.
• An external signal can be used as the oscillator's instant value. If an already averaged external value is used, set the period to one in this indicator.
• For the cases where an external signal is used, a centerline value can be set.
Higher Timeframes
• The two higher timeframes are named Medium timeframe and Highest timeframe . They can be determined using one of three methods:
• Auto-steps: the higher timeframes are determined using the chart's resolution. If the chart uses a seconds resolution, for example,
the medium and highest resolutions will be 15 and 60 minutes.
• Multiples: the timeframes are calculated using a multiple of the chart's resolution, which you can set.
• Fixed: the set timeframes do not change with the chart's resolution.
Repainting
• Repainting can be controlled separately for the chart's value and the higher timeframe values.
• The default is a repainting chart value and non-repainting higher timeframe values. The Aggregate line will thus repaint by default,
as it uses the chart's value along with the higher timeframes values.
Aggregate Weights
• The weight of each component of the Aggregate line can be set.
• The default is equal weights for the three components, meaning that the chart's value accounts for one third of the weight in the Aggregate.
High Volatility
• This provides control over the volatility filter used in the Main line's coloring conditions and the background display.
• Volatility is determined to be high when the short-term ATR is greater than the long-term ATR.
Colors
• You can define your own colors for all of the oscillator's plots.
• The default colors will perform well on both white and black chart backgrounds.
Alerts
• An alert can be defined for the script. The alert will trigger whenever a bull/bear marker appears in the indicator's display.
The particular combination of coloring conditions and the display of bull/bear markers when you create the alert will thus determine when the alert triggers.
Once the alerts are created, subsequent changes to the conditions controlling the display of markers will not affect the existing alert(s).
• You can create multiple alerts from this script, each triggering on different conditions.
Backtesting & Trading Engine Signal Line
• An invisible plot named "BTE Signal" is provided. It can be used as an entry signal when connected to the PineCoders Backtesting & Trading Engine as an external input.
It will generate an entry whenever a marker is displayed.
Look first. Then leap.

ArcTan Oscillator [LuxAlgo]The following indicator is a normalized oscillator making use of the arc tangent sigmoid function (ArcTan), this allows to "squarify" the output result, thus visually filtering out certain variations originally in the oscillator. The magnitude of this effect can be controlled by the user. The indicator contains a gradient that shows the possibility of a reversal, with red colors indicating that a reversal might occur.
Settings
Length : Period of the oscillator
Pre-Gain : Changes the amplitude of the oscillator before passing through the ArcTan function, this allows to amplify/reduce the "squarification" effect introduced by this function. In order to make it easier for the user, the setting is in a (-10,10) range, with negative values reducing the amplitude and positive one increasing it.
Src : Source input of the indicator
Usage
The oscillator can be used to determine the direction of the trend by looking at its sign, if the oscillator is positive, market is up-trending, else down-trending, based on this usage the user might not be interested to look at every variations produced by the oscillator, this is where the hyperbolic tangent function and pre-gain setting can be useful, by using an high value of pre-gain the user will be able to only focus on the sign of the oscillator.
Here pre-gain is set to 5, we can see that the oscillator is now easier to visualize. However, the use of sigmoid functions remove useful information for a trader that needs to find divergences, this is where using a negative value of the pre-gain setting will result useful.
Here pre-gain is set to -5.
The indicator makes use of a gradient to show potential reversals, this gradient is determined by the correlation between the oscillator and the price (this is a way to measure potential divergences). If the color is closer to red it means that a potential reversal might occur, it is possible to say in which direction price might go by looking at the sign of the oscillator, so if the gradient is red and the oscillator is negative price might rise. The gradient is not affected by the pre-gain setting.

RSI+Stoch Band Oscillator📈 RSI + Stochastic Band Oscillator
Overview:
The RSI + Stochastic Band Oscillator is a technical indicator that combines the strengths of both the Relative Strength Index (RSI) and the Stochastic Oscillator. Instead of using static thresholds, this indicator dynamically constructs upper and lower bands based on the RSI and Stochastic overbought/oversold zones. It then measures the relative position of the current price within this adaptive range, effectively producing a normalized oscillator.
Key Components:
RSI-Based Dynamic Bands:
Using RSI values and exponential moving averages of price changes, upper and lower dynamic bands are constructed.
These bands adjust based on overbought and oversold levels, offering a more responsive framework than fixed RSI thresholds.
Stochastic-Based Dynamic Bands:
Similarly, Stochastic %K and %D values are used to construct dynamic bands.
These adapt to overbought and oversold levels by recalculating potential high/low values within the lookback window.
Oscillator Calculation:
The oscillator (osc) is computed as the relative position of the current close within the combined upper and lower bands of both RSI and Stochastic.
This value is normalized between 0 and 100, allowing clear identification of extreme conditions.
Visual Features:
The oscillator is plotted as a line between 0 and 100.
Color-filled areas highlight when the oscillator enters extreme zones:
Above 100 with falling momentum: Red zone (potential reversal).
Below 0 with rising momentum: Green zone (potential reversal).
Additional trend conditions (falling/rising RSI, %K, and %D) are used to strengthen reversal signals by confirming momentum shifts.

Oscillator Suite [KFB Quant]Oscillator Suite is a indicator designed to revolutionize your trading strategy. Developed by kikfraben, this innovative tool aggregates eleven powerful oscillators into one intuitive interface, providing you with a comprehensive view of market sentiment like never before.
Originality and Innovation:
Unlike traditional indicators that focus on single aspects of market analysis, Oscillator Suite stands out by integrating multiple oscillators, making it a pioneering solution in technical analysis. This unique approach empowers traders to gain deeper insights into market dynamics and make more informed trading decisions.
Functionality:
Oscillator Suite calculates signals for each selected oscillator based on its specific formula, offering a diverse range of market insights. Whether you're assessing trend strength, market momentum, or price movements, this indicator has you covered.
Aggregated Score:
The indicator combines signals from all chosen oscillators into an aggregated score, providing a holistic assessment of market sentiment. This aggregated score serves as a powerful tool for identifying trends and potential trading opportunities.
Customization and Ease of Use:
With customizable parameters such as colors, smoothing options, and oscillator settings, Oscillator Suite can be tailored to suit your unique trading style and preferences. Its user-friendly interface makes it easy to interpret and act upon the information presented.
How to Use:
Identify Trends: Analyze the aggregated score and individual oscillator signals to identify prevailing market trends.
Confirm Trade Signals: Use multiple oscillator alignments to strengthen the conviction behind trade signals.
Manage Risk: Gain insight into potential reversals or trend continuations to effectively manage risk.
This is not financial advice. Trading is risky & most traders lose money. Past performance does not guarantee future results. This indicator is for informational & educational purposes only.

QQE Weighted Oscillator [LuxAlgo]The QQE (Quantitative Qualitative Estimation) Weighted Oscillator improves on its original version by weighting the RSI based on the indications given by the trailing stop, requiring more effort in order for a cross with the trailing stop to occur.
🔶 USAGE
The QQE Weighted Oscillator is comprised of a smoothed RSI oscillator and a trailing stop derived from this same RSI. The oscillator can be used to indicate whether the market is overbought/oversold as well as an early indication of trend reversals thanks to the leading nature of the RSI.
Using higher Factor values will return a longer-term trailing stop.
Like with a regular RSI divergence can be indicative of a reversal.
Further weighting will control how much "effort" is required for the trailing stop to cross the RSI. For example. For example, an RSI above the trailing stop will require a higher degree of negative price variations in order for a potential cross to occur when using higher weights.
This can cause higher weightings to return more cyclical and smoother results.
🔶 SETTINGS
Length: Length of the RSI oscillator.
Factor: Multiplicative factor used for the trailing stop calculation.
Smooth: Degree of smoothness of the RSI oscillator.
Weight: Degree of weighting used for the RSI calculation.

Divergence Indicator (any oscillator)A modification of the TV builtin "Divergence indicator" (Version 10) that can be applied to any indicator, and can be plotted on price as well.
Usage:
Add your favorite oscillator, RSI, Klinger, TSI, CMF, or anything else to a chart.
Click the little ... (More) on the oscillator.
Then add this indicator "Divergence Indicator (any oscillator)" on your oscillator of choice.
Click the settings on this indicator and make sure the source is set to the right plot from your oscillator.
Watch for it to plot divergences...
Add this indicator a second time on the price chart (and select the same oscillator plot), but check the box "plot on price (rather than on indicator)""
See you divergence plotted on price (as well as on the oscillator)

L1 Mid-Term Swing Oscillator v1Level: 1
Background
Oscillators are widely used set of technical analysis indicators. They are popular primarily for their ability to alert of a possible trend change before that change manifests itself in price and volume . They should work best in times of sideways markets.
Function
L1 Short-Mid-Long-Term Swing Oscillator puts three terms of oscillators to cover short-term, middle-term and long-term oscillators at the same time. By resonating all these three oscillators, short-term scalping signal and middle term swing signal are disclosed. You can see both short and mid term signal under one indicator which give you more confidence to follow the trend.
Key Signal
I didn't handle the key signals well. I piled up all the useful signals I found, and it is really difficult to classify them one by one. I feel tired when I think about this problem. Therefore, the code of the overall signal is rather confusing, sorry.
Pros and Cons
Pros:
1. Three oscillators are used to cover short, mid, long term oscillations.
2. Short-Mid term resonance can be observed to have higher confidence level.
3. Use single indicator for scalping and swing trading is possible.
Cons:
1. No deep dive into very accurate long and short entries.
2. A trade off between sensitivity and stability may be needed by traders' subjective judge.
Remarks
I enjoyed the fun of put three different oscillator together to cover short, mid, long terms. But how to use them perfectly is really more brainstorming.
Readme
In real life, I am a prolific inventor. I have successfully applied for more than 60 international and regional patents in the past 12 years. But in the past two years or so, I have tried to transfer my creativity to the development of trading strategies. Tradingview is the ideal platform for me. I am selecting and contributing some of the hundreds of scripts to publish in Tradingview community. Welcome everyone to interact with me to discuss these interesting pine scripts.
The scripts posted are categorized into 5 levels according to my efforts or manhours put into these works.
Level 1 : interesting script snippets or distinctive improvement from classic indicators or strategy. Level 1 scripts can usually appear in more complex indicators as a function module or element.
Level 2 : composite indicator/strategy. By selecting or combining several independent or dependent functions or sub indicators in proper way, the composite script exhibits a resonance phenomenon which can filter out noise or fake trading signal to enhance trading confidence level.
Level 3 : comprehensive indicator/strategy. They are simple trading systems based on my strategies. They are commonly containing several or all of entry signal, close signal, stop loss, take profit, re-entry, risk management, and position sizing techniques. Even some interesting fundamental and mass psychological aspects are incorporated.
Level 4 : script snippets or functions that do not disclose source code. Interesting element that can reveal market laws and work as raw material for indicators and strategies. If you find Level 1~2 scripts are helpful, Level 4 is a private version that took me far more efforts to develop.
Level 5 : indicator/strategy that do not disclose source code. private version of Level 3 script with my accumulated script processing skills or a large number of custom functions. I had a private function library built in past two years. Level 5 scripts use many of them to achieve private trading strategy.

Milan OscillatorBill Williams Breakout Setup
I have referred to the man multiple times whether tweeting about him or writing a blog post. Now I want to relearn how breakout trading works, again. A while ago, my friend invited a bunch of us into a Zoom conference sharing us how his setup works for him. He reintroduced me to Bill Williams' indicators which looked like below.
The rules are simple:
Prices are moving away from Alligator, open and closed above the first time.
AC is twice consecutively at par with the direction.
AO is twice consecutively at par with the direction.
Entry on the third candle to be sure, or the second if you're willing to risk it.
The chart above is an example from the 4 hourly time-frame. Before going into any entry, to get a macro perspective, should check on these time-frames first:
Weekly
3 Days
Daily
Bonus points if monthly time-frame is also at par with the bias. Here are the charts for the larger time-frame.
It's been profitable trading with the above setup but then I have an itch to scratch. I wanted to have just a single oscillator instead of two to look at. It will enable me to make decisions faster and can use my brain juice to think about something else.
So I combined the two to create a new oscillator. I call it the `Milan Oscillator` in honor of my friend Patris who reintroduced me to Bill Williams yet again. Patris' favorite team is AC Milan, here's to you bro 🍺
Here are the same charts above with Milan Oscillator.
The rules are a bit different than the rules above:
No entry when the oscillator is gray, this means AC and AO are disagreeing.
Prices are moving away from Alligator, open and closed above the first time.
Oscillator is twice consecutively at par with the direction.
Entry on the third candle to be sure, or the second if you're willing to risk it.
On lower volume moves, prices will retest alligator, can be an entry if the retest fails.
Feedbacks are appreciated.

Simple Harmonic Oscillator (SHO)The indicator is based on Akram El Sherbini's article "Time Cycle Oscillators" published in IFTA journal 2018 (pages 78-80) (www.ftaa.org.hk)
The SHO is a bounded oscillator for the simple harmonic index that calculates the period of the market’s cycle. The oscillator is used for short and intermediate terms and moves within a range of -100 to 100 percent. The SHO has overbought and oversold levels at +40 and -40, respectively. At extreme periods, the oscillator may reach the levels of +60 and -60. The zero level demonstrates an equilibrium between the periods of bulls and bears. The SHO oscillates between +40 and -40. The crossover at those levels creates buy and sell signals. In an uptrend, the SHO fluctuates between 0 and +40 where the bulls are controlling the market. On the contrary, the SHO fluctuates between 0 and -40 during downtrends where the bears control the market. Reaching the extreme level -60 in an uptrend is a sign of weakness. Mostly, the oscillator will retrace from its centerline rather than the upper boundary +40. On the other hand, reaching +60 in a downtrend is a sign of strength and the oscillator will not be able to reach its lower boundary -40.
Centerline Crossover Tactic
This tactic is tested during uptrends. The buy signals are generated when the WPO/SHI cross their centerlines to the upside. The sell signals are generated when the WPO/SHI cross down their centerlines. To define the uptrend in the system, stocks closing above their 50-day EMA are considered while the ADX is above 18.
Uptrend Tactic
During uptrends, the bulls control the markets, and the oscillators will move above their centerline with an increase in the period of cycles. The lower boundaries and equilibrium line crossovers generate buy signals, while crossing the upper boundaries will generate sell signals. The “Re-entry” and “Exit at weakness” tactics are combined with the uptrend tactic. Consequently, we will have three buy signals and two sell signals.
Sideways Tactic
During sideways, the oscillators fluctuate between their upper and lower boundaries. Crossing the lower boundary to the upside will generate a buy signal. On the other hand, crossing the upper boundary to the downside will generate a sell signal. When the bears take control, the oscillators will cross down the lower boundaries, triggering exit signals. Therefore, this tactic will consist of one buy signal and two sell signals. The sideway tactic is defined when stocks close above their 50-day EMA and the ADX is below 18

Modified Chaikin OscillatorThis is a modified version of the Chaikin Oscillator. The idea is to find accumulation and distribution phases in the market to identify when institutions are building their positions.
It uses acc/dist but as an oscillator, just like the Chaikin Oscillator, but not to find overbought or oversold areas, but to find trends. It functions like a MACD. It takes a fast moving average of the acc/dist and a slow moving average of the acc/dist, and plots the differense to create the oscillator, and uses a signal line to use for entries.
A strong signal is when the oscillator crosses the signal line while the signal line is on he right side of 0. So a crossover (long) when the signal line is below 0 woul be a weak signal, while a crossover (long) when the signal line is above 0 would be a strong signal.
By default, tick volume is discarded in the calculation, which makes this version behave a bit differently than the standard Chaikin Oscillator. This is because the indicator is mostly used to trade CFD's. If used to trade stocks for example, it is better to include the volume by unchecking that checkbox in the indicator settings.
BRIGHT GREEN = Strong signal LONG (signal line is above 0)
DARK GREEN = Weak signal LONG (signal line is below 0)
BRIGHT RED = Strong signal SHORT (signal line is below 0)
DARK RED = Weak signal SHORT (signal line is above 0)
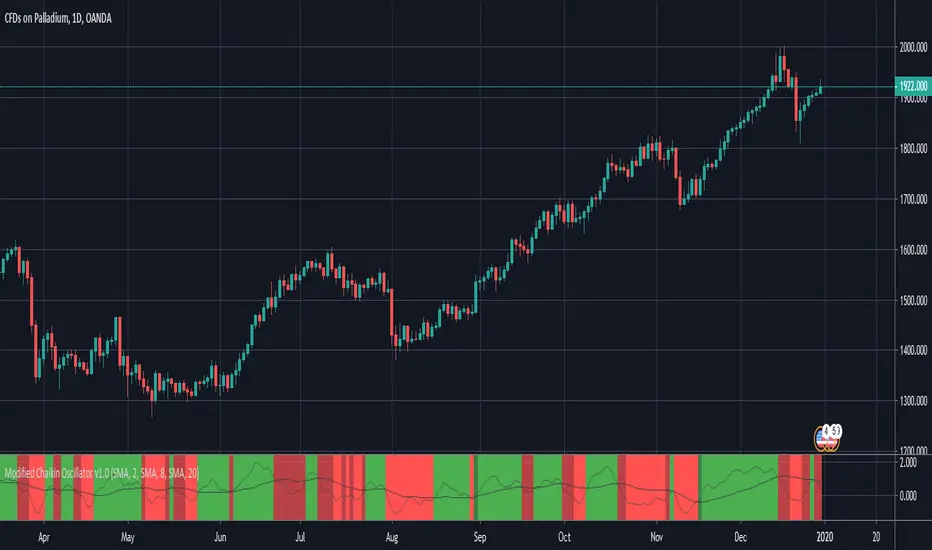
ATR Oscillator with Dots and Dynamic Zero LineWhat It Is
The ATR Oscillator with Dots and Dynamic Zero Line is a custom indicator based on the Average True Range (ATR), designed to provide traders with enhanced insights into market volatility and directional bias. Unlike traditional ATR oscillators that plot continuous lines, this version uses distinct dots to display ATR values and includes a dynamic zero line that changes color based on market direction (uptrend, downtrend, or consolidation).
How It Works
ATR Calculation:
The indicator calculates the Average True Range over a user-defined period (default: 14 bars). ATR measures market volatility by considering the range between the high, low, and close of each bar.
Dots for ATR Values:
Instead of plotting ATR values as a continuous line, the indicator represents each value as an individual blue dot. This format highlights changes in volatility without visually connecting them, helping to avoid false trends and clutter.
Dynamic Zero Line:
A horizontal zero line provides additional directional context. The line changes color dynamically:
Green: Indicates an uptrend (price is consistently closing higher over consecutive bars).
Red: Indicates a downtrend (price is consistently closing lower over consecutive bars).
Gray: Indicates market consolidation or sideways movement (no clear trend in price).
The thickness and step-like style of the zero line make it visually prominent, enabling quick interpretation of market direction.
What It Does
Visualizes Market Volatility:
By plotting ATR values as dots, the oscillator emphasizes periods of heightened or reduced market activity, helping traders anticipate breakout opportunities or avoid low-volatility zones.
Provides Trend Context:
The dynamic zero line gives traders a clear signal of the prevailing market trend (uptrend, downtrend, or consolidation), which can be used to align trading strategies with the broader market context.
Avoids Misleading Trends:
Unlike traditional ATR oscillators that use continuous lines, this version eliminates visual artifacts caused by noise, such as false trends during consolidation periods.
Simplifies Interpretation:
The combination of ATR dots and a color-coded zero line creates a straightforward and intuitive tool for assessing both volatility and market direction.
Why It’s More Useful Than a Traditional ATR Oscillator
Enhanced Visibility:
The use of dots instead of a continuous line makes it easier to spot discrete changes in ATR values, avoiding visual clutter and false impressions of smooth trends.
Dynamic Market Context:
Traditional ATR oscillators only measure volatility, offering no indication of market direction. The dynamic zero line in this oscillator adds valuable directional context, helping traders align their strategies with the trend.
Better for Range-Bound Markets:
The zero line’s color-changing feature highlights consolidation periods, enabling traders to identify and avoid trading during sideways, low-volatility conditions where false signals are common.
Quick Decision-Making:
With clear visual cues (dots and color-coded lines), traders can quickly assess market conditions without needing to analyze multiple charts or indicators.
Improved Confluence:
The oscillator’s signals can easily be combined with other tools like VWAP, Volume Profile, or Order Flow indicators for more confident trade decisions.
When to Use It
Trending Markets:
Use the dynamic zero line to confirm the market’s direction and align trades accordingly.
Breakout Opportunities:
Look for periods of increasing ATR (dots moving higher) to anticipate high-volatility breakout scenarios.
Avoiding Noise:
During consolidation (gray zero line), this oscillator warns traders to wait for clearer signals before entering trades.